TRX/USD bear trend might be in troubles!HELLO everybody
TRON losing his selling power
Smaller swings, a LOT of divergences (both from RSI14 and MACD 3-10) which makes me think the trend is about to correct.
It looks like we also broke the discending support (for the bears) and / or falling wedge formation (orange lines) with a decent burst of momentum, which could be identified as a Kick-off , namely the first signal of the beginning of a possible correction.
If so, we are now testing the orange trendline to then move higher.
We also have a pretty big resistance (dotted red horizontal line) and the 20MA is close for a 50MA cross.
SO, power is being lost, what do You think?
NOW: I really can't be sure of the entity of the correction. in this 7H chart I placed 3 blue rectangle boxes, which are the most important areas of resistance.
In my strategy, I will wait to see what price does and how the buyers will behave to decide where to consider the correction depleted.
I am not a professional Trader, these are only my opinions on TRX USD and I wanted to share this idea with You to gather feedbacks and maybe improve it togheter =)
let me know your thoughts on this
Up

FRAN going upFor at least the next week or two, FRAN is a safe bet going forward. Wait for the dip, buy on the upswing.

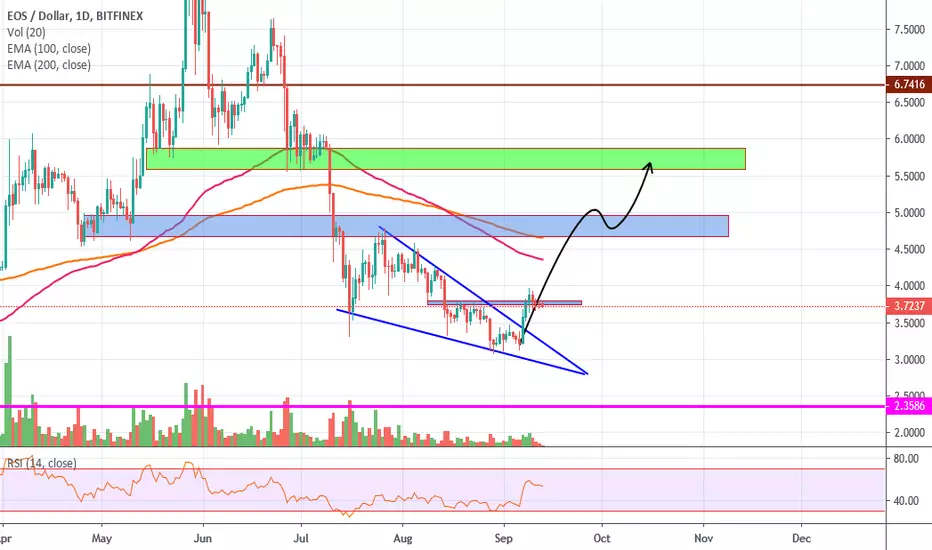
EOS time to go up !We should going up because on the chart is confirmed falling wedge pattern.The first we need cross up the blue s/r zone and then we will must bounced to green s/r zone, which can be TP. We must be carefuly when price will cross EMA 100,200 and blue s/r zone. At this zones price can slowdown or go down. Dont forget work with SL.
MSFT - Microsoft up trend. Time to buy?In my opinion, the share price of Microsoft will rise slow and safe until earnings reports.
I think it is a good time to buy.
What is your opinion?

11.9.2019 - Bitcoin (BTC / USD)Hi Traders!
Today we look at BTC / USD. The summer is over and we are waiting for the key movement that will determine the direction of Bitcoin for the next months.
We are currently in a key area where upward bounce to USD 11,000 should occur. We can annotate the previous move to 5 waves and we are currently at the end of ABC correction . The fact that we are in a very strong area, where reflection is likely, suggests a few facts:
Fibonacci retracement - There are 0.65 - 0.786 retracement in this zone which are very strong zones
Fibonacci extension - The whole correction is in the form of ABC correction and in this zone is 1.01 extension projection AB
Volume gap on horizontal volumes
These are three reasons for which we assume that we are now in a zone that is expected to grow to USD 11,000. The daily chart is still in either a triangular or a channel formation . We have been creating this formation for more than two months and we are not yet able to tell which side the weight minds are leaning towards. If the zone is confirmed, we have a potential upward movement of 10% that you can trade.
In the case of the triangle , we need to overcome the top trend resistance on the daily chart, and in the case of the channel , it will be confirmed that we will do a new local minimum and exceed the strong support of USD 9,000. Neither scenario has occurred yet and therefore we have to catch what we have.
May the crypto be with you!

#BTC continuation of the ideacontinuation of the idea
#thinking out loud
Why look up ?
1) Shave shortists
2) drive the price so that the crowd would believe in the next native FOMO
3) money is pushing the price, there is more positive funding-longs on bitmex ...
4) a bullish figure which is drawn.
5) there is a bullish figure in front of the level of $ 11,000
Now I’m thinking, maybe it’s more profitable to select shorts?
False break up, and stone down, noo


4.9.2019 - MaticHi Traders!
Today we look at MATIC/USD. Matic is a new cryptocurrency that passed through the Binance Launchpad . The coins that have gone through the Binance Launchpad have quite similar charts and the big point is that they usually start to grow among the altcoins first.
Matic is also marked by a decline, and although we have seen slight growth in the last few hours that could be plotted into 5 waves, the decline may not yet be at the end, as we are below the trend resistance. In the analysis of the higher time zone, however, we came to the key support and the final zone, so the point of entry was ideal. We are currently expecting ABC correction and then breaking the trend resistance . Looking at the graph in more detail, the breakthrough might well be based on the 3rd subwave in 3rd wave .
Elliot's wave theory tells us that the third wave is often the longest one, never the shortest, and usually breaks the RSI into the extreme zone and has a high volume . To put it simply, if you see a pump or break on the chart, then it is 95% 3rd wave. Logically, therefore, 3rd subwave in 3rd wave is the longest and most impulsive. So Matic looks like preparing land for a break . Coin rarely breaks such a strong resistance for the first time, and therefore it usually happens that coin arrives at the resistance and bounces downward to recharge and then break. This is our bullish scenario.
May the crypto be with you!


EURUSD Key level movement upJust was analysing the chart EURUSD and I saw a good opportunity to wait for the movement up. We are close to the support level and it is a key level. Now we have to wait for the movement up to the resistance level.
My plan on this trade you can see on the chart.


XAUUSD 1802$ Confirmed ... Play With TrendXAUUSD 1802$ Confirmed ... Play With Trend
MAKE MONEY IN TONS
FOR MORE MESSAGE ME ....
Invalid Point
Break
1479 (LAST LOW)
The expected trading range is between 1479.00 support and 1802.00 resistance.
The expected trend : Bullish


DIS is getting momentum for a bull runaccumulation started a while ago
Don't miss out the break out NYSE:DIS

GBPJPY Movement up (fifth wave)Hey everyone. We can see clear correction and now it is going to be the fifth wave also we can see a little RSI divergence.
My plain is :
BUY STOP - 129.168
STOP LOSS - 128.982
1TP - 129.494
2TP - 129.682
3TP - 129.911

USDCAD Movement upIn the chart we can see clear up trend and now we are close to the support level and we can wait for the movement up
My plan is
BUY STOP - 1.32771
STOP LOSS - 1.32508
TAKE PROFIT - 1.33254


Buy EUR/USDI am going long on Eur/Usd. I think eur/usd will break down to around 1.11684 then price will go up to around for 1.12800 area. With dxy dropping at a fast pace on Friday a pullback might come when the markets open which supports the idea of Eurusd going down a little before it goes up.

NANO to recover a bitNANO just broke the trendchannel and bounced ontop of it. It also broke above the 50-day moving average for the first time since april.
Watch for overbought situations to find the local top.

very close for btcbitcoin is a great crossroads. We could lose the current parabolic channel we are in. thus obtaining a larger correction. let's be attentive to what happens. I see 2 possible ways. enter a new channel temporarily bearish or retest the current minima and continue with the rise in the same parabolic channel in which we are.

BITCOIN in a wedge up. Soon $1000 p/day?BITCOIN in a wedge up. Soon $1000 p .day?
Bitcoin is following this wedge so nicely. If we break above the recent top we can see another nice parabolic pump. Maybe up to 17k
This price can accumulate with $1000 pday again. All ALTS are bleeding now because of the BTC dominance. ALTS are getting chances soon but first
Bitcoin needs to reach a higer price.
If we fell out this wedge we can see a retest of te gap around 8500?!.
Share your idea please!
Please also dont forget to follow me and like this post if u agree.
Goodluck my bulltraders.
#BTC100k

[UPBTC](298%) UpToken Huge Jump! Trade Signal @AlanMastersWe've been looking at some charts on Bittrex and we are seeing some common patterns and signals, followed by a huge breakout...
Right now we are looking at these for the UpToken (UPBTC) chart.
These are the signals... feel free to hit like now... and let's get started!
A Strong and steep drop.
Mini uptrend with multiple green candles and increasing green volume.
Bullish divergence showing simultaneously on the MACD and RSI.
Break above EMA5 and EMA10...
These signals are followed by a strong breakout to the upside... Let's see if this time it happens again.
Thanks a lot for reading...
Below the trade.
----------
Pair: Uptoken (UPBTC)
BUY: 0.00000097 - 0.00000109
NEXT SUPPORT: 0.00000085
TARGET:
(1) 0.00000134
(2) 0.00000164
(3) 0.00000184
(4) 0.00000214
(5) 0.00000260
(6) 0.00000290
(7) 0.00000340
(8) 0.00000374
(9) 0.00000414
POTENTIAL PROFITS: 298%
(Buy calculated at 0.00000104)
STOP: Close weekly below 0.00000080.
----------
This is not financial advice.
Thanks a lot for the continued support.
This is Alan Masters.
Namaste.
