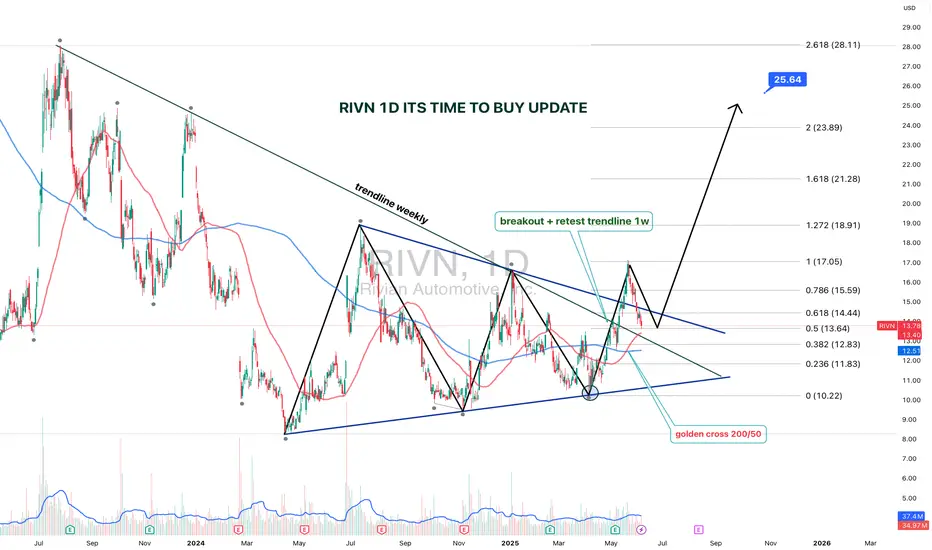
RIVN 1D — It’s Time to Buy: Setup UpdateThe setup on Rivian (RIVN) just got upgraded from “interesting” to “strategically significant.” We’re looking at a textbook symmetrical triangle that’s been developing since July 2023, with a clean breakout and retest on the weekly trendline.
The breakout was followed by a bullish retest, right at the intersection of the triangle base and the key trendline. Volume kicked in, price held — and that’s what smart money calls confirmation.
Now, the Golden Cross is live: the 50-day MA just crossed the 200-day MA from below. Price is confidently holding above both — momentum is shifting hard. Fibs from the bottom (10.22) to the last local top (17.05) project the first target at $17, and the extended Fibonacci confluence gives us $25.64 as a long-range goal (2.618 extension).
The weekly trendline — which acted as resistance for over a year — has flipped to support. Price action respects it, bulls are loading, and structure is clean.
This is not just a bounce. It’s a technical rotation from accumulation to expansion.
The time to talk about potential is over — price action has spoken.
Update
GBP/JPY Bullish Continuation Toward 215.00 TargetGBP/JPY is trading around 201.09, maintaining an upward trendline support. The pair is consolidating near resistance at 201.50, with a potential bullish target set at 215.00 if price breaks above the current range.

Gold Price Breakout Above Trendline Targets 3980 Gold (XAU/USD) is showing bullish momentum, breaking above the trendline resistance around 4000. Price is currently near 4008, with potential pullback targets around 3980 and 3965 if retracement occurs. Trend remains positive above the rising trendline.

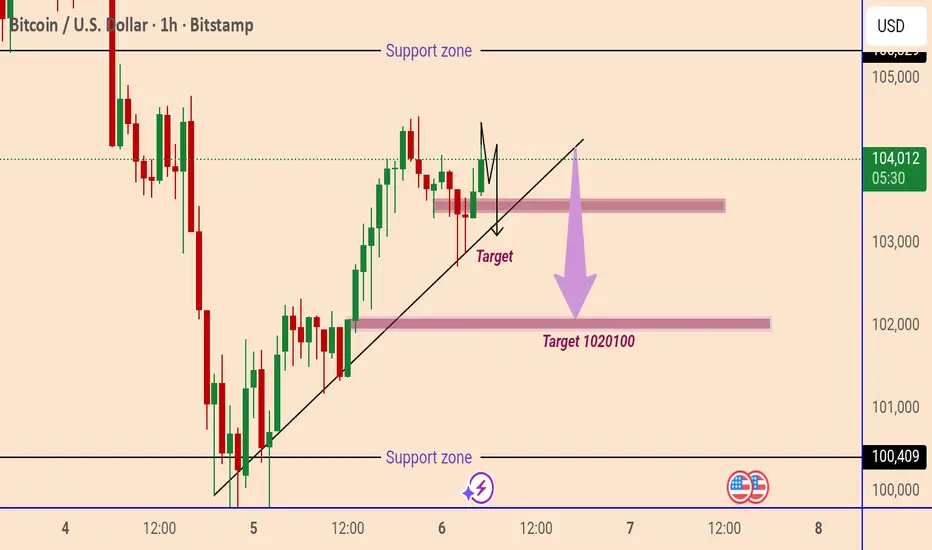
Bitcoin Trendline Breakdown SetupBitcoin (BTC/USD) is trading around $104,010, showing a mild bullish correction. However, the chart suggests a potential downward move if price breaks below the trendline support. The next targets are around $103,000 and $102,000–$102,100, with a major support zone near $100,400.
EUR/USD Bullish Reversal Toward 1.1510 TargetEUR/USD is trading near 1.1483, holding above the 1.1468 support zone. A bullish move is expected if the pair stays above support, with potential targets at 1.1500 and 1.1510.

Gold Price Targets 3990 After Support ReboundGold (XAU/USD) is trading around 3966, showing bullish momentum after rebounding from the support zone near 3928. The price is moving within an ascending channel, with a short-term target set at 3990. A breakout above this level could push prices toward the next resistance near 4006.

Bitcoin Rebounds Toward 103,500 Target ZoneBitcoin (BTC/USDT) on the 1-hour chart shows a rebound from the support zone around 99,900, forming a bullish move toward the target area at 103,500. A break above the mid-resistance zone could confirm further upside momentum.

Gold Price Pullback Targets After Recent RallyGold price is trading around $3,980, showing a 1.22% gain on the 1-hour chart. The chart suggests a potential pullback with downside targets at $3,971 and $3,960 after recent bullish momentum.

Bitcoin Bullish Breakout Toward 112,000 TargetBitcoin (BTC/USD) is showing bullish momentum, trading above the trend line support. The price is targeting the 112,000 level, with potential resistance zones ahead. A sustained move above 110,000 could confirm further upside continuation.

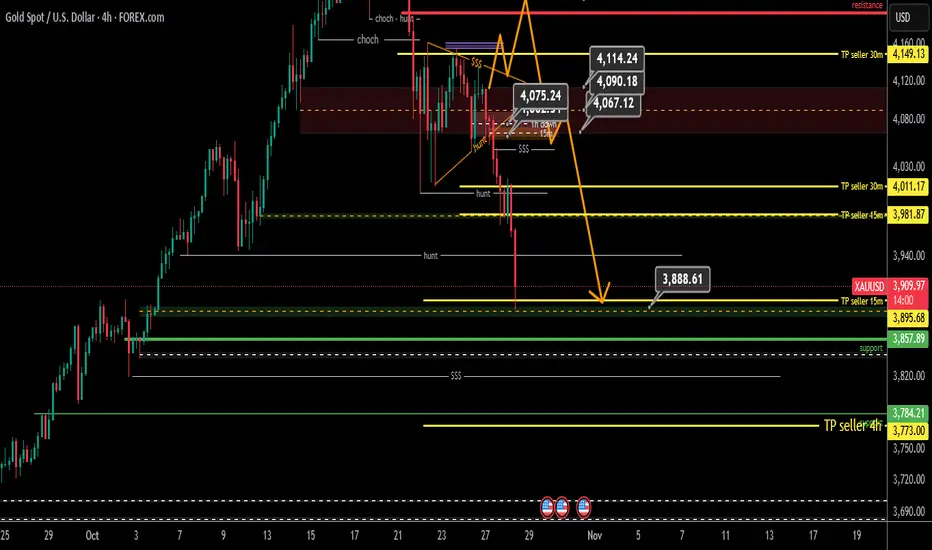
Update Two 4-Hour Gold Analysis
Hello Traders
So far, yesterday's analysis target has been touched, but the seller is still present in the market, and today the 4-hour seller entered the market, and the long-term 4-hour analysis that we had last week gained more strength, the 4-hour sellers target was defined as 3773, which was explained in the relevant post about the entry of sellers. So, every pullback will still have more sellers in the market. For the sell, all the yellow lines of the TPs settled by the candlestick failure act as current resistance and are considered the pullback zone.
Good luck.
Links to the two analyses:
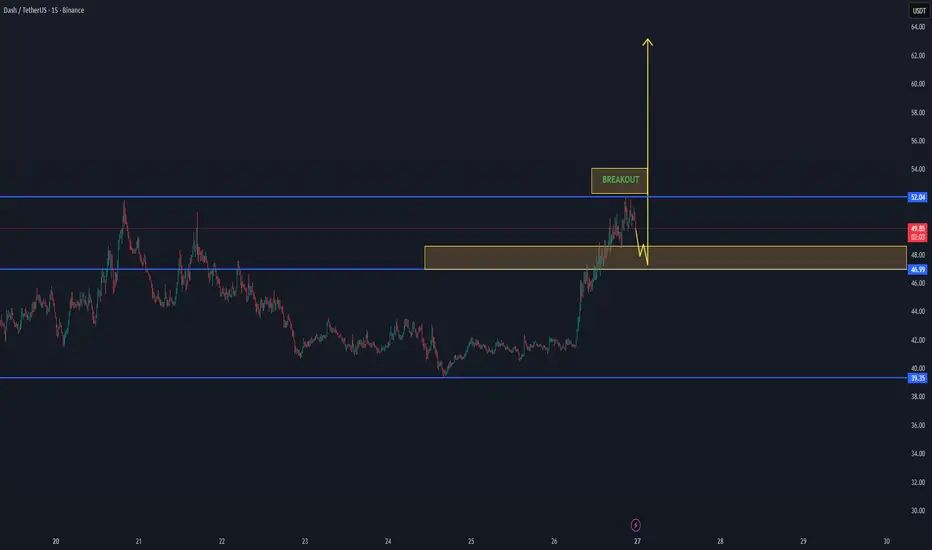
DASH/USDT Market Update – Breakout Tested, Pullback ExpectedDASH/USDT recently confirmed a breakout above the previous resistance zone near 46.9–47.0 USDT, showing strong upside momentum.
However, after this breakout move, the market is currently cooling down, suggesting a potential pullback retest before continuation.
The key support zone sits around 46–47 USDT — holding this level would confirm healthy consolidation and prepare the structure for a potential next leg up toward the 52–66 USDT range.
If price fails to hold the zone, a deeper retracement toward 39.3 USDT remains possible before another attempt to push higher.
📊 Summary:
Support zone: 46.0 – 47.0 USDT
Resistance target: 52.0 – 66.0 USDT
Structure: Breakout → Retest → Potential continuation
Bias: Bullish, but expecting short-term correction first
🔎 Focus: Watching for retest confirmation and buy pressure re-entry around the support range before any renewed upside.
$ETH market update 5-10-2025📊 Ethereum Market Update (on request)
Right now, there’s nothing major happening for Ethereum. It continues to consolidate in a range between the ATH at $4800 and the $3800 level, because of this massive bearish divergeance.
On the daily chart, the MACD is bullish and the Stochastic RSI is supportive, but momentum looks exhausted. There isn’t much conviction in this move. Bitcoin is the real superstar, while Ethereum is fading in its shadow.
From my analysis, we might still have about one more week of growth, potentially pushing to a new ATH — but don’t expect a parabolic rally. This looks more like a technical follow of BTC rather than genuine investor interest.
⚠️ That means the probability is high that we see a dump back below $4000, likely testing $3800 as support.
If bulls regain control and Bitcoin rotation restarts, ETH could resume its rally. Otherwise, we may see deeper consolidation, possibly down to $3400, before finding the energy to push again toward a new ATH.
#Ethereum #ETH #EthereumPrice #Crypto #CryptoNews #CryptoMarket #Bitcoin #BTC #Altcoins #Trading #TechnicalAnalysis #CryptoUpdate #MACD #StochasticRSI #ATH #CryptoTrading #Investing

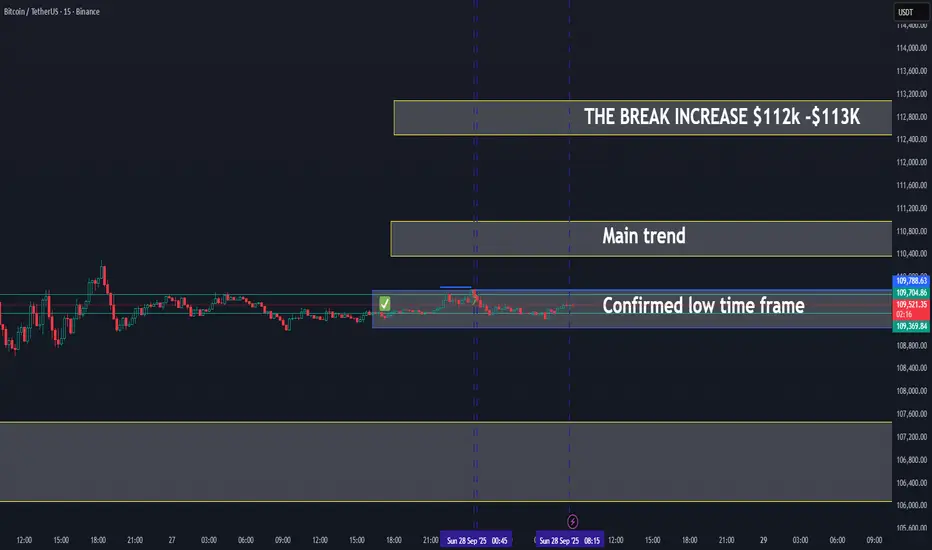
BITCOIN ON WAY TO MAINTREND - UPDATE 28-09-2025📊BTC/USDT Trading Update
✅ Low time frame confirmed: Bitcoin has established support in the $109.3K – $109.7K zone, which now acts as a strong base.
📈 Price is moving toward the main trend zone ($110.8K – $111.5K). This will be the key resistance area to watch.
🔑 Breakout potential:
If BTC clears the main trend zone, momentum could accelerate with the next target around $112K – $113K.
This would confirm a stronger continuation of the short-term uptrend.
Scenarios:
Bullish case: Hold above $109.3K and break $111.5K → expansion toward $112K – $113K.
Bearish case: Failure to break the main trend could lead to sideways action or retest of $109K support.
📌 Summary:
BTC has confirmed its low time frame breakout and is now targeting the main trend zone. A break above this range will likely fuel a push toward $112K – $113K.
BTCUSD update May 22nd, 2025I have returned and here is my updated chart. I'm such a perfectionist sometimes when it comes to lines that it takes my hours to get them exactly how I envision. To start off, yes I am bullish on Bitcoin and believe that this cycle hasn't ended yet but I will admit that I think the end of it is closer than the beginning. With that being said, I will not disappear when the bear market starts, I will simply make updates and try to catch the bottom like I did in the past. So far I am going with history and my bottom target is above 66,800 and I expect the floor to fizzle out around 71-73k; if it ends up being higher than that, great! Overall this idea is just an update for my own personal records and my prediction is based on what has happen that last time this pattern was brought to us.
Stay safe out there, happy trading, and as always--Cheers!

BTC/USD 1h chart Pateern.From this updated chart, "TARGET POINT" label more clearly.
The horizontal green box you marked is roughly between $122,000 and $123,000 (though this seems like a different scale—possibly a derivative or index, not direct BTC price in USD).
The price is breaking above the descending trendline and heading toward that high-volume resistance zone.
The main targets I see from your own chart markings are:
First target: around $118,991 (blue label) — likely the nearest resistance.
Second target: around $120,137 (yellow label) — next key high-volume node.
Final target (your green box): around $122,000–$123,000.
These seem to be based on volume profile gaps and resistance levels.

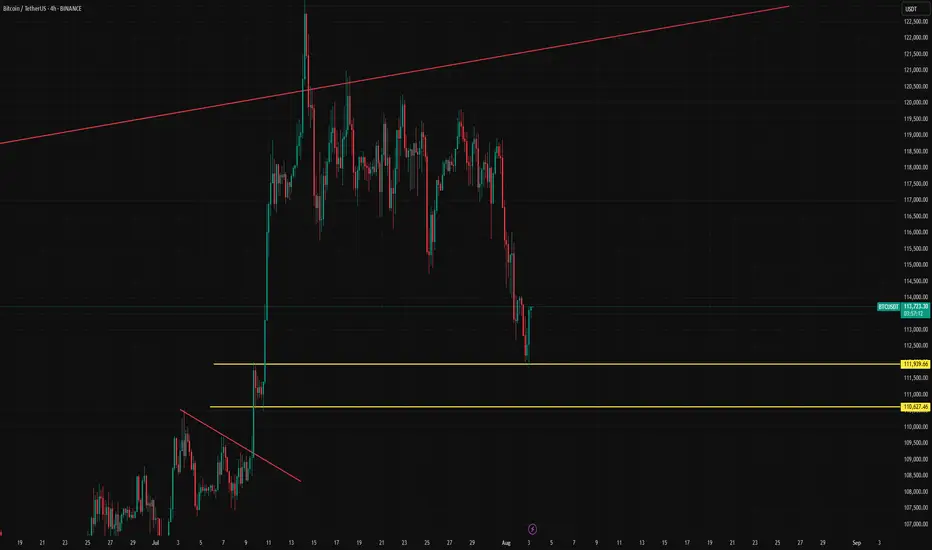
BTC/USDTWell, well, well, I see that Bitcoin has hit its main support. Those who bought and made profits can slowly exit.
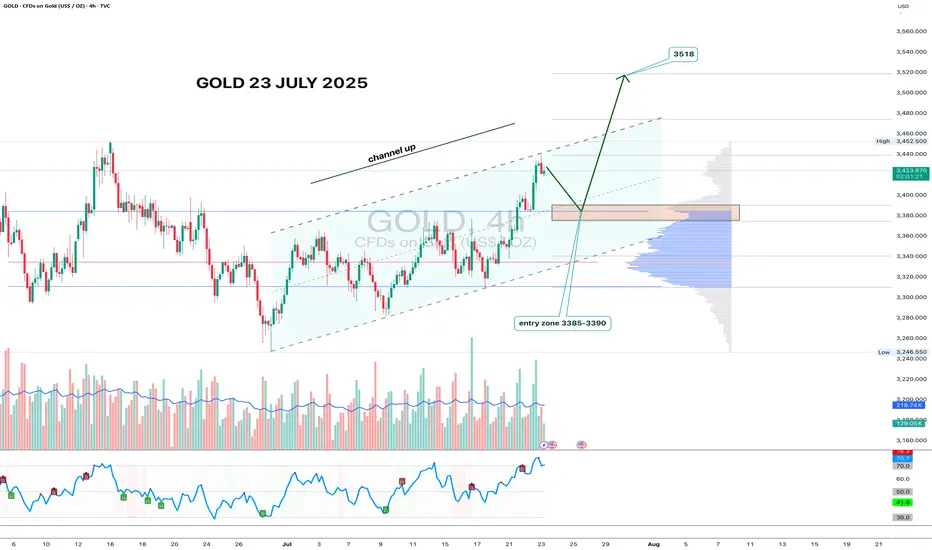
Gold 4H - channel breakout, looking for 3518 nextGold has formed a clean ascending channel on the 4H chart, broke out above resistance, and is now pulling back into the 3385–3390 zone. This area aligns with volume clusters - a perfect entry zone for bulls waiting on the sidelines.
If price holds this zone and prints a reversal candle with volume, the upside target remains at 3518 - the 1.618 Fibonacci extension and historical resistance. Volume increased during the breakout move, confirming interest. RSI still has room to go higher, supporting the bullish continuation.
Fundamentally, gold remains a safe-haven asset amid geopolitical tension, USD weakness, and potential Fed easing. Central bank accumulation further supports the bullish case.
Tactical setup:
— Entry zone: 3385–3390
— Trigger: candle confirmation + volume
— Target: 3518
— Invalidation: break below 3360 without buyer volume
If the plan plays out — gold might shine bright while bears squint in disbelief.
Gold 22 July 2025 updateGood afternoon, update to last week's post of 21 July on gold, which worked yesterday, new zone to buy, the chart shows everything in detail, so today with the message "brevity is the sister of talent"
#GOLD
BUY LIMIT ZONE 3365-3370
🎯 TP1: 3385
🎯 TP2: 3400
🎯 TP3: 3412
🎯 TP3: 3428
⛔️ Stop loss: 3355
Regards, Totoshka™

btc/usdtI think it's time for Bitcoin to grow. It doesn't matter what the news is. This time, Bitcoin and Tether's dominance have reached their peak and are ready to make Bitcoin grow. This is my analysis. What do you think?

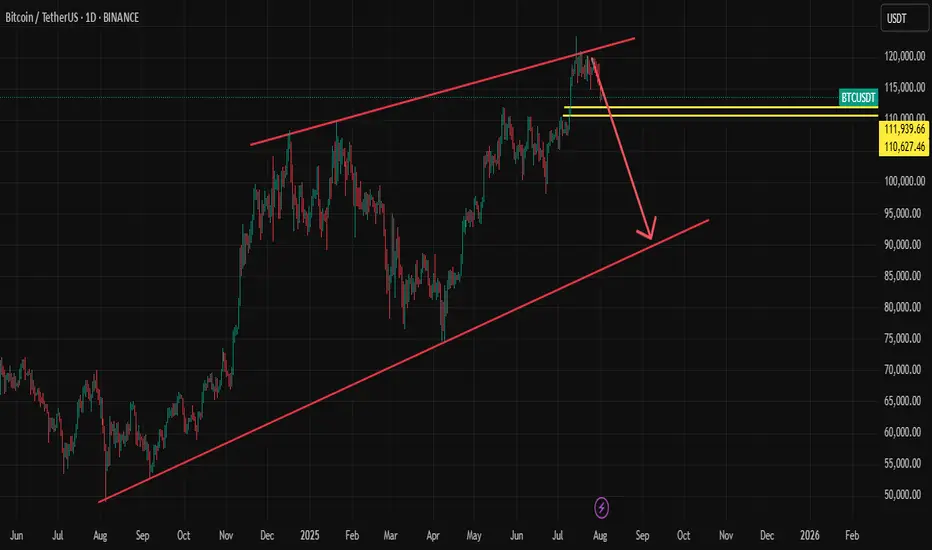
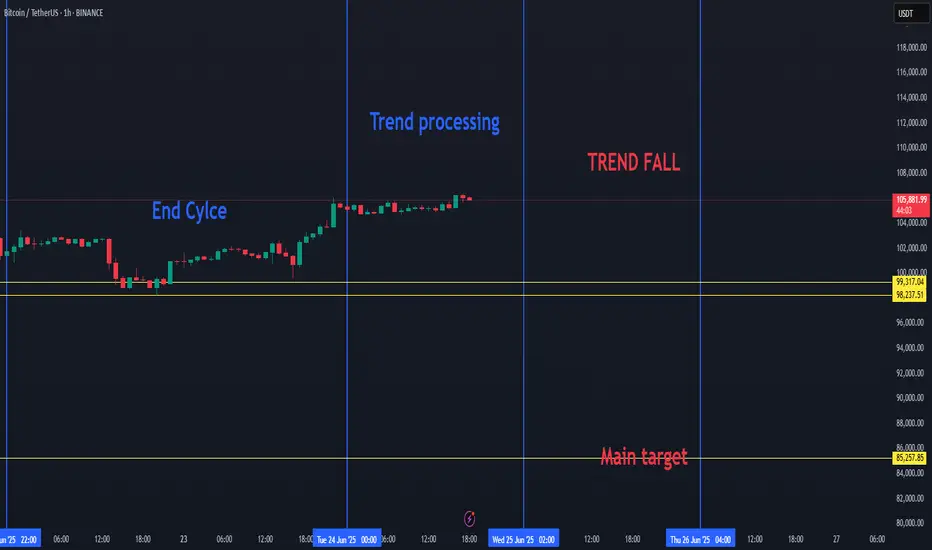
BTC HIGH DATA SHOW BREAKDOWN TO 85K FOR BITCOIN SOON.Bitcoin Market Update
BTC SEEMS TO ENTER A NEW CORRECTION PHASE SOON.
Recent data suggests that the current Bitcoin (BTC) cycle is coming to an end. As a result, we may soon see a downward move in BTC's price. The key target in this potential drop is around $85,000, with expectations that BTC will fall below $100,000.
This week, Bitcoin completed its cycle trend and is now entering a processing or transitional phase. Once this phase ends, we anticipate another decline in price.
This outlook is based on recurring patterns seen in previous BTC cycles, which have shown similar behavior in the past.
BTC can play on the low time frame with uptrends and downtrends, but if we will choice a side, then it will be the red trend.. since BTC cycle is ending.
WTI(oil)For oil, what I have in mind, considering the conditions we are in, if the Strait of Hormuz is not closed, we will remain at the same prices, that is, $75 to $80. But if the Strait is closed 100%, the price will go up to $130 and $150 in the short term.

BTC/USDTHello friends, I hope you are doing well. This analysis came to my mind for Bitcoin. On the 4-hour time frame, if Bitcoin crosses the areas I specified, it will move towards its targets. It could be bullish because gold and oil were bearish yesterday. What do you think, friend?
