The Crypto Black Swan Event > 10 bln USD of liquidations🧭 Executive Summary of the Crypto Black Swan Event
⚡ A sudden U.S. announcement of 100% tariffs on Chinese imports triggered a broad risk-off move across assets. Crypto, heavily levered near record highs, absorbed the shock via a forced-deleveraging cascade.
📉 Bitcoin fell sharply off its Oct 5 all-time high ~$125.2k to intraday lows near $105k–$102k, a ~16%–19% peak-to-trough drawdown across venues.
💥 Within 24h, liquidations surged to a record: credible tallies cluster around ~$9.5B–$19B, with ~1.4M–1.66M accounts affected; longs comprised the vast majority.
______________________________________________________________________________
🧨 What Caused the Liquidations
🧱 Macro shock: The tariff announcement plus mooted export controls abruptly repriced global growth, supply chains, and corporate margins—sparking equity weakness and a USD bid.
⛓️ Leverage overhang: Elevated perpetual futures and options positioning into fresh BTC highs left the market top-heavy. The macro jolt flipped bids thin → stops → liquidations.
🧪 Microstructure feedback: As price gapped, market makers widened spreads; taker flow ate depth; liquidation engines sold into deteriorating liquidity, magnifying slippage and triggering further margin calls.
______________________________________________________________________________
📊 Key Stats of the Black Swan Event
🧮 Total liquidations: ~$9.5B–$19B
👥 Accounts liquidated: ~1.4M–1.66M.
📉 Side: Longs 80%–88% of notional; shorts a minority share.
₿ BTC liqs: Roughly $1.3B–$5.3B depending on the data cut.
Ξ ETH liqs: Roughly $1.2B–$4.4B depending on the data cut.
🏦 Largest single order: About $203M (ETH-USDT) reportedly auto-closed on a perps venue during the flush.
🧾 Open interest: Per-asset OI fell sharply; sample snapshots show ETH OI down mid-single-digits to double-digits %, with billions of OI notionals erased.
🗂️ Cross-asset context: U.S. equities slid >2% on the day; risk proxies weakened as the tariff shock hit.
______________________________________________________________________________
🧩 Price Action & Drawdown
🚦 BTC: From ATH ~$125.2k to low ~105k–102k during the liquidation wave ~16%–19% drawdown, then partial stabilization above ~$110k.
🧷 ETH: Intraday range ~$4.39k → ~$3.54k ~19% swing before retracing part of the move.
🧭 Timing: The steepest losses clustered around the tariff headlines, with > $6B in liquidations occurring in a short burst as per some trackers.
______________________________________________________________________________
🧠 Microstructure Dissection
🪙 Perps dominance: Crypto’s price discovery has migrated to funded perpetuals. When the macro shock hit, perps funding and basis compressed, and auto-deleveraging/liquidation engines amplified downside.
🧰 Liquidity thinning: As volatility spiked, market makers reduced top-of-book size and widened quotes. Forced sell-flows then walked the book, increasing impact and triggering adjacent liquidation thresholds
🧷 Stop-density near round levels: Crowd positioning clustered around psychological levels e.g., $120k / $110k BTC, increasing stop-gamma once those levels broke.
🔁 Vol-targeting & risk controls: Systematic players and options desks cut exposures as realized vol surged; put-skew firmed, further pressuring delta hedges.
______________________________________________________________________________
🧯 Why This Was Worse Than Usual
📌 Catalyst clarity + leverage: A binary, headline-driven macro shock met crowded, momentum-long positioning near all-time highs.
📌 Time-of-day liquidity: Parts of the move unfolded during lower-depth periods, elevating market impact of forced sells.
📌 Cross-venue fragmentation: Liquidation telemetry differs by exchange; some engines throttle reports, but the flows were real—depth collapsed across majors simultaneously.
______________________________________________________________________________
🧪 BTC & ETH: By the Numbers
₿ BTC:
• ATH (Oct 5): ~$125.2k → flush low ~$105k–$102k → settle ~$112k.
• Liquidations: ~$1.3B–$5.3B depending on window/venue.
• Narrative: From “ETF & macro tailwinds” to “trade-war risk & deleveraging.”
Ξ ETH:
• Intraday: ~$4.39k → ~$3.54k (~−19%), partial rebound thereafter.
• Liquidations: ~$1.2B–$4.4B depending on window/venue.
• Options: Defensive put demand rose as traders sought convexity; skew biased to protection.
______________________________________________________________________________
🔭 What to Watch Next
🧷 Policy path: Will tariff scope/timing evolve? Any China counter-measures e.g., rare-earths could extend risk-off.
📉 Residual leverage: Track perps funding, aggregate OI, and basis—a second-wave flush risk fades as these stabilize.
🏦 Liquidity recovery: Top-of-book depth and spreads on major venues Binance/OKX/Bybit/CME are key to gauging re-risk appetite.
🧪 Dealer positioning: Elevated implied vol and persistent downside skew would signal hedging demand and slower mean-reversion.
______________________________________________________________________________
🧰 Risk-Management Takeaways
✅ De-crowd near extremes: Size leverage down when price, positioning, and macro all point one way.
✅ Respect liquidity regimes: Use impact-aware sizing and time-of-day execution filters around macro catalysts.
✅ Hedge the tail: Cheap convexity (puts/put spreads) into binary events offsets liquidation-engine reflexivity.
✅ Diversify collateral: Avoid single-stablecoin collateral concentration; maintain spare margin buffers across venues.
Uptober

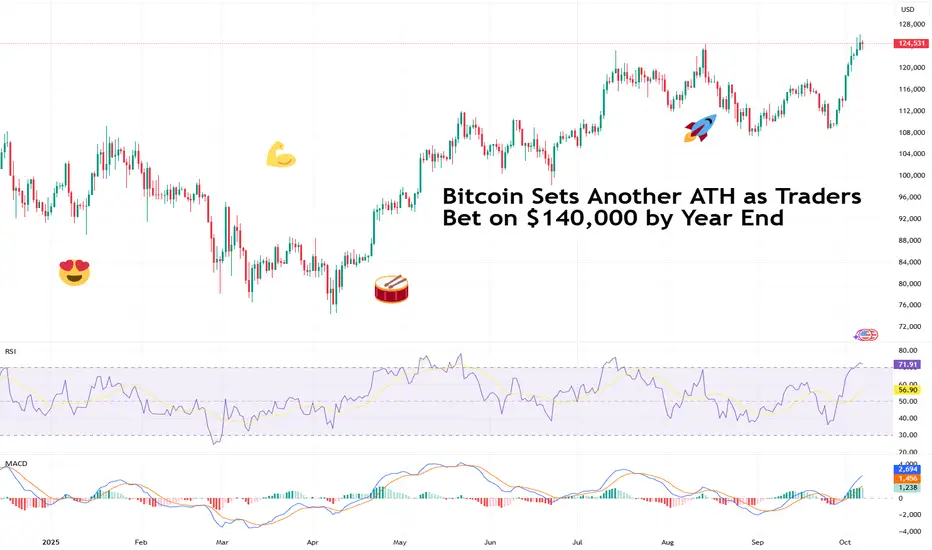
Bitcoin Sets Another ATH as Traders Bet on $140,000 by Year EndBlink and you’ll miss it. Bitcoin’s recent leg up caught lots of traders unprepared. After sinking below $110,000 few weeks back, the OG coin slingshotted to a fresh record high above $126,000 this week. Not a bad way to start October Uptober .
Now, traders are adding to bets that the price will crack $140,000 by year end. How realistic is that?
🌕 “Uptober” Strikes Again
October has a reputation in crypto lore and it’s living up to it.
Over the last 13 Octobers, Bitcoin BITSTAMP:BTCUSD has ended in the green 10 times. The pattern is set to continue as the coin rides a broader wave of optimism fueled by the Fed’s rate cuts, a messy US government shutdown, and the return of that dangerous four-letter abbreviation: FOMO.
But the real kicker? Spot Bitcoin ETFs are on fire.
US-listed Bitcoin ETFs kicked off the month with their second-best week ever, attracting $3.24 billion in net inflows — nearly matching their record of $3.38 billion set in November 2024. Are we… so back ?
💥 Options Traders Go Big: $140K or Bust
In the options market, optimism is loud and clear. Data from Deribit shows open interest piling up around the $140,000 strike for contracts expiring in December — meaning plenty of traders are betting we’ll see new highs just in time for the holiday season. (Not that easy to gift a BTC now, is it?)
At the same time, a few cautious traders are hedging with puts, just in case this turns into another one of those “too-fast, too-furious” rallies.
📈 You Get a Record and You Get a Record
It’s not just Bitcoin exploring new horizons. The S&P 500 SP:SPX and the Nasdaq Composite NASDAQ:IXIC both logged their 30-something record closes of 2025, powered by relentless AI strength ( some huge OpenAI deal ) and investors betting that rate cuts will stretch the bull run.
But also, gold bugs are turning into the Scrooge McDucks of the market, backstroking through piles of gold in impenetrable fortresses.
The shiny stuff OANDA:XAUUSD is up 55% year to date and hovering just under $4,000 per ounce, a milestone that would make even die-hard crypto bulls nod in respect.
Apparently, the market’s hot across the board.
🧠 Why Bitcoin’s Rally Makes Sense (Kind Of)
Underneath the euphoria, there’s some logic to this madness:
• Lower rates = cheaper money. When the Fed cuts, non-yielding assets like Bitcoin suddenly look more attractive.
• Inflation’s still sticky. Investors want something that can’t be printed at will. The US government shutdown only strengthened that flow of cash.
• Institutional influx is real. ETFs, family offices, and even corporate treasuries are allocating to Bitcoin BITSTAMP:BTCUSD , Ethereum BITSTAMP:ETHUSD , and Solana PURPLETRADING:SOLUSD.
At its current market cap of $2.5 trillion, Bitcoin is now bigger than Amazon NASDAQ:AMZN ($2.4 trillion), the world’s fifth-largest company .
🧭 The “Uptober” Mindset
Here’s where psychology comes in. After weeks of choppy sideways trading, boredom gave way to disbelief — then disbelief turned to excitement. Now? We’re entering the danger zone where conviction and euphoria start to blur.
Some veterans call this the “emotional compression” phase — when every dip feels like an entry and every green candle feels eternal. But cycles never die; they just rotate. Those who chase late often learn that momentum cuts both ways.
Still, momentum traders have history on their side. Every October since 2012 (barring 2018, 2014, and 2012), Bitcoin has delivered solid gains. It’s hard to argue with a pattern that reliable — until it breaks.
🤔 What Could Trip Up the Bulls
Even the most euphoric chart has risk baked in:
• Profit-taking. After a 100% gain over the past twelve months, short-term traders can decide to lock in profits fast.
• Macro shocks. One bad inflation print ECONOMICS:USCPI or a hawkish Fed comment could cool the mood.
• Overheated sentiment. When everyone in your barbershop agrees it’s going up, it usually doesn’t — at least not immediately.
The chart’s near-term support sits between $120,000–$122,000. Lose that, and a retest of $110,000 is possible. Hold it, and $140,000 becomes more than just a meme.
📢 $140K by Year-End: Dream or Data?
Statistically speaking, Bitcoin would need roughly a 4% monthly gain from here to hit $140,000 by December. Considering it’s already up over 100% year-to-date, that’s not outrageous.
To get there, the stars must stay aligned:
• ETF inflows keep building momentum.
• The Fed sticks to its dovish script.
• Stocks stay buoyant, giving traders room to take risk.
• No black swans, no rug pulls, no sudden panic tweets.
If all that holds, a single Bitcoin closing the year north of $140,000 isn’t fantasy. It’s just crypto doing what crypto does — defying logic, gravity, and your risk management plan.
👉 Off to you : Where do you see Bitcoin by end of year? Cast your predictions in the comment section!
BTC - Weekly Breakout!📈 BTC has already broken out of its correction phase and is holding strong above $118k.
As long as $118k holds, the next targets sit between $126k–$140k.
Only a drop below $114k would delay the bullish outlook.
Trend remains strongly bullish after the breakout.
⚠️ Disclaimer: Not financial advice. Manage risk properly.
All Strategies Are Good; If Managed Properly!
~Richard Nasr.

PUMPTOBER: History Repeats Faster (x1.25 in 30 Days?)🚀 PUMPTOBER: History Repeats Faster (x1.25 in 30 Days?)
Bitcoin doesn't break the pattern — it compresses it.
We've now transitioned from mania to maturity, and the chart says it loud and clear:
⏱️ The Compression Pattern:
📍 October 1st, 2017 — x5 gain in 60 days
📍 October 1st, 2021 — x2.5 gain in 45 days
📍 October 1st, 2025 — x1.25 potential in 30 days?
(Current price: $114,000 → +25% pattern target: $142,750 )
This isn't speculation — it's rhythm.
The cycle continues, but it's compressing: faster timelines, tighter gains, greater capital efficiency.
🔍 Current Structure:
BTC/USD opened October 2025 at $114,000 .
It's currently sitting just under key short-term resistance, with support around $107,851 and Fib confluence at $112,927 .
Professor's roadmap shows:
→ Primary Target : $138,888 (my technical target)
→ Extended Target : $174,840 (if euphoria returns)
→ Macro Support Zones : $107,851 → $100K → $89,313
📊 Chart Elements:
→ Three vertical cyan lines mark each October 1st cycle start
→ Yellow circles highlight the exact price level each October 1st
→ "WE → ARE → HERE" progression visually aligns the cycles
→ Clear visual anchors: 2017 (x5), 2021 (x2.5), 2025 (x1.25?)
📈 The Maturity Thesis:
As Bitcoin matures, its market cap expands — and explosive gains give way to efficient moves .
A 25% rally at this level isn't small — it's a $29,000 gain in 30 days.
In 2017, that required chaos.
In 2025, it might only require structure.
The chart doesn't scream anymore. It whispers. But the message is still bullish.
💡 Thought of the Day
"Cycles don't die — they evolve.
x5 was hype.
x2.5 was influence.
x1.25? That's adoption speed.
Same heartbeat. Just faster...
oh! and Trump needs Jesus to take BTC higher so the debt seems smaller."
📌 Disclaimer
This analysis reflects my personal market observations and is not financial advice. I am not a licensed financial advisor. All trading carries risk. I am just the best you will find in Provlepsis through Prognosis. Just remember to follow the levels: I buy over and I sell/short under all major levels on my chart.
One Love,
The FXPROFESSOR 💙
→ I know you want to know about Alts... we will get there too in the days to come.

MYX: History Repeats – Will We See Another Boom?LSE:MYX has been following a clear accumulation pattern, with a sharp rally after each phase. Currently in a similar setup, the price is consolidating, and if history repeats, we could see another breakout soon.
Keep an eye on this, as the next move could be significant.
DYOR, NFA
#PEACE

WHAT IF.. $BITCOIN holds? New ATH incomingHey again traders!
BTC is leaving no man alive. What everybody thinks about the 107K level ( masive bearish breakout) was invalidated by a bullish breakout to 114K.
The sad part? We are in a bearish channel.
The good one? If we hold 110K - 112K there is a high probabilty that 117K - ATH will come on the upcoming weeks.
Have to be mentioned that we are entering in Q4 historically the most bullsh Q for markets!

Bitcoin establishes early Uptober support baseToday was a positive sign as bitcoin rose $3236, or 2.9%, to $114,3500. That move potentially helped establish a potential floor for the Uptober rally.
From a technical perspective, Bitcoin is holding above the rising 100-day exponential moving average, which has acted as dynamic support at times since April. The price has broken this trendline multiple times over the past few months, and each time buyers have stepped in to defend it.
Upside levels to watch:
$116,500 – First resistance from late September intraday highs.
$120,000 – Key swing high from July, a strong psychological barrier.
$124,000 – Major resistance from August.
$128,000 – Year-to-date peak.
$140,000 – Round number resistance and measured move target if Bitcoin clears $128K. Also lines up with Fibonacci extensions of the April–August rally.
$150,000 – Big psychological milestone.

"Uptober" hopes tested as Bitcoin and Ethereum slideWhile Ethereum has outperformed Bitcoin in recent months, today’s session shows a reversal of that trend. ETH is down roughly 6.5%, underperforming BTC, which has slipped around 3.8%.
Historically, September has been a weak month for crypto, with a tendency for a recovery in “Uptober”.
Uptober might be helped by further rate cuts from the Fed , the SEC deciding on multiple crypto ETFs and more information about Morgan Stanley’s plans to roll out crypto trading for retail clients through E-Trade in early 2026.

BTC TO 99K OR MORE?Its indeed UPTOBER, BTC Broke the Trend to the upside, I'm excited to see this progress and US Election is on the way. This will be the era of the Crypto Elections. Lets see how this unfolds.

UPTOBER ENDS Bitcoins monthly close is behind us and it's an interesting one...
For most of the last day of the month BTC was above the previous monthly close high of $71,413.40. However, Bitcoin failed to close above that level coming up 1.67% short.
Despite this the monthly candle is very strong, historically October is a good performer hence the "UPTOBER" nickname and this time around was no exception with an +11% move. I said in a previous post that a retest of the '21 ATH @ $69,000 is possible and likely, in the last 8 months BTC has routinely rejected off this level with no acceptance above, just SFPs galore. This is the chance to retest and accept as new support. that would set up a move for ATH and above.
Q4 so far has been positive, we know that this month will be a strange one as the US election is in a few days and can sway markets so volatility can be expected. In the end I think the trajectory is new highs by the end of the year.

Chainlink Price Poised for a Breakout: Can $LINK Reach $13?Chainlink ( BIST:LINK ), one of the most talked-about cryptocurrencies in the blockchain space, is showing signs of a potential breakout this October. After a volatile few months, the token has seen steady gains, rising from $10.60 to $11.13—a nearly 4% increase within the last week. This upward movement, alongside promising network developments and technical indicators, has investors speculating on whether the token can surpass the $13 mark in the near term.
Technical Outlook: Chainlink’s Path to $13
Technically, Chainlink’s price action presents both challenges and opportunities. The token is currently trading below its 200- and 100-day moving averages (MAs), reflecting a cautious market sentiment. However, the narrowing of the Bollinger Bands suggests a breakout could be on the horizon, with $13 as a potential upside target. Additionally, the MACD indicator is converging into a positive territory, hinting at a bullish momentum that may push the price higher in the coming days.
Despite some recent bearish signals, including a 2.53% decline as of this writing and a moderate RSI of 50.03, the token has held strong above key support levels. The next major test for Chainlink ( BIST:LINK ) will be overcoming the $12 pivot, a point seen by analysts as a significant resistance. If BIST:LINK breaks through, it could solidify the move to $13, especially given the bullish environment often associated with "Uptober"—a historically favorable month for cryptocurrencies.
Drivers of Chainlink’s Growth
Chainlink’s recent network upgrades and strategic partnerships are driving its price momentum. The introduction of staking has boosted investor confidence, offering them an opportunity to lock up tokens and earn rewards, reducing the circulating supply and increasing scarcity. Moreover, Chainlink’s Oracle services, which provide secure and reliable off-chain data to smart contracts, have expanded with the integration of Secure Mint.
The adoption of Chainlink’s Cross-Chain Interoperability Protocol (CCIP) by major players like Ronin, the gaming-focused EVM blockchain, is further strengthening the network’s ecosystem. As more platforms adopt Chainlink’s technology, the demand for LINK tokens continues to rise.
Whale Accumulation and Market Sentiment
Chainlink’s whale activity has surged, which is often a bullish signal. According to data from Santiment, the number of large BIST:LINK holders has increased from 489 to 502 in early October. Whale accumulation typically indicates that major investors expect the price to rise in the future, reinforcing the narrative of a potential breakout. Additionally, increased active addresses and transaction volumes reflect growing interest and usage of the Chainlink network.
Increased whale activity also raises the possibility of a short squeeze. Many traders currently hold short positions, and if Chainlink ( BIST:LINK ) can break through the $12 resistance, it could force short sellers to cover their positions, leading to a rapid price increase.
Potential Risks and Support Levels
While Chainlink’s future looks bright, there are risks to consider. The token remains vulnerable to broader market corrections, and a failure to hold above the $10.27 support level could see it retrace further, potentially to the $9.50 mark. Additionally, its underperformance compared to Bitcoin ( CRYPTOCAP:BTC ), which has seen stronger gains in recent days, highlights the possibility of more bearish moves if the overall market sentiment shifts.
However, if Chainlink ( BIST:LINK ) can continue building on its network upgrades and overcome key technical hurdles, the stage is set for a strong October performance, with $13 well within reach.
Conclusion: Is Chainlink Set for a Rally?
As of now, Chainlink is positioning itself for a potential breakout above $13, with the technical indicators and fundamental drivers both supporting an optimistic outlook. Increased whale activity, low exchange reserves, and major network developments all contribute to the bullish sentiment around the token. While the token faces immediate resistance at the $12 pivot, a successful breakout could set Chainlink on a bullish trajectory for the rest of October and beyond.

UPTOBER: Bitcoin’s Pump and Higher Low FormationSince May, Bitcoin has been trapped in a bearish price structure, characterized by lower highs and lower lows . Every attempt to break out was met with resistance, pushing the price lower. However, after the August lower low , Bitcoin began a reversal , producing two consecutive higher highs and higher lows . This shift is crucial because it indicates a bullish price structure, meaning the market is finally beginning to move upward again.
While a small reset in Bitcoin’s price from $66K to $60K was expected and I stand here to say, I was wrong and I apologize to fail giving you the other side of the apple for being bearish during my live stream and other documents and shot calls, the retracement was largely influenced by external factors, specifically the geopolitical tensions in Israel. Even though the pullback occurred earlier than anticipated, the market structure remains bullish, and we could soon see Bitcoin break through the $68K resistance level. As the chart shows, Bitcoin has created a solid foundation for this next leg of the rally.

Bitcoin Falls Marking the Worst 'Uptober' in Nearly a DecadeMarket Update - October 4th 2024
Takeaways
Bitcoin fell following the news of Iran’s retaliation on Israel, and the election of Japan’s new prime minister: The decline comes after a recent rally spurred by the Federal Reserve's rate cut.
Net inflows into global crypto funds reached $1.2 billion last week, marking their largest increase in 10 weeks: US-based spot bitcoin ETFs contributed $1.1 billion in these inflows, while Ethereum products ended a five-week streak of outflows by adding $87 million.
Changpeng Zhao, founder of Binance, was released from prison after completing a four-month sentence for failing to establish money laundering controls: Zhao paid a $50 million personal fine and is no longer allowed to hold executive positions at the company.
Ohio State Senator Niraj Antani introduced a bill that would require all political subdivisions in Ohio to accept cryptocurrency payments for state and local taxes: The proposal also allows state universities and pension funds to invest in cryptocurrencies, positioning Ohio at the forefront of crypto adoption.
More than 94% of FTX's Dotcom creditors voted in favor of a reorganization proposal: The proposal would see 98% of creditors receiving at least 118% of their claim value.
🥩 Topic of the Week: How Can I Make Returns or Rewards on My Crypto?
🫱 Read more here

Bitcoin Enters ‘Uptober’ After Exiting Q3 Flat: What to ExpectCrypto traders are keen to see another ‘Uptober’ — a term coined by the community to describe the outsized gains in Bitcoin prices for October. Historically, in eight of the last 11 Octobers the original cryptocurrency has pulled ahead big time. So what’s it gonna be this time? There’s a lot to unpack — let’s ride.
Bitcoin prices BTC/USD signed off for September at just over $63,000 per coin, with a modest (by crypto standards) 8% rise . But if you zoom out to wrap up the third quarter, you’ll see that prices stayed flat, tight-lipped and straight up boring. Bitcoin barely realized a gain — it went up by less than 1% for the September quarter but seesawed like there’s no tomorrow.
In true crypto fashion, the fire-breathing beast feeding on volatility went as low as $49,600 and as high as $70,000 — a wide gap of 40% from top to bottom. All who’ve been in crypto long enough are familiar with the stomach-churning volatility that can make even the most disciplined traders doubt their choices.
Speaking of volatility, traders are now bracing for what’s historically shaping up to be a solid month for Bitcoin gains. October, dubbed by crypto faithful as “Uptober,” is already here and brings with it a whole new wave of expectations.
Here’s why that is:
October 2023 — Bitcoin was up 27% .
October 2022 — Bitcoin was up 6%.
October 2021 — Bitcoin was up 40%.
October 2020 — Bitcoin was up 30%.
October 2019 — Bitcoin was up 10%.
October 2018 — Bitcoin was down 5%.
October 2017 — Bitcoin was up 50%.
October 2016 — Bitcoin was up 15%.
October 2015 — Bitcoin was up 38%.
October 2014 — Bitcoin was down 12%.
October 2013 — Bitcoin was up 69%.
What you see is that October performance is a thing — traders are already on the edge of their seats in anticipation of the next leg up. But before that, there’s a mosaic of data that needs to pan out.
Nonfarm payrolls (NFP) data (drops October 4): The good old jobs report will show how many new workers joined the US economy in September. Fairly low expectations this time — Wall Street is eyeballing 144,000 new jobs, about the same as the previous month . The NFP figure will be complemented by the unemployment rate, expected to stay flat month-on-month at 4.2%.
Consumer price index (drops October 10): US inflation is another big report that is likely to shake up the crypto landscape . For September, prediction gurus expect inflation to keep moving toward the Federal Reserve’s 2% target from an August clip of 2.5% . Lower inflation is good for solidifying prospects of interest rate cuts. And that is super good for the broader investment world, cash flows and overall liquidity across markets.
Retail sales (drops October 17): retail sales are a solid measure of consumer spending. The more people buy expensive watches and things they don’t necessarily need, the better reading this report will carry. In other words, a strong retail sales figure will breathe more confidence in investors looking to jam cash into risk assets (yes, crypto included ).
All that good stuff is likely to shape the trajectory of Bitcoin prices. But — and maybe even more important in the long run — these three data dumps will help the Federal Reserve decide if it’s a good idea to chop down the interest rate and how much, following the super-sized 50-bps slash . Rate moves and broad monetary policy decisions are likely to have an impact on Bitcoin, which has been increasingly sensitive to macroeconomic winds.
For the technical minds, there is an interesting technical analysis pattern that might be worth looking into. A descending parallel channel is in the works, tracing its origins back to March 14, 2024. Fun fact: that’s the all-time record high for Bitcoin when prices peaked at more than $73,000 a pop .
Since then, prices have been gradually losing their momentum, painting lower highs and lower lows. The latest bottom (September 6), which has provided enough resistance for a solid bounce, is sitting at $52,500. The next potential leg up is expected to take the price all the way up to around $67,000 in the short term, while the next potential leg down could pressure prices to a fresh low of $51,500 in the medium term.
As traders set their sights on "Uptober," excitement is in the air, but it's not all confetti and moon rockets. October has a track record of delivering some big numbers, yes. But keep in mind that it’s not just a monthly performance number — behind it is an underlying force that has powered the price. So, should you blindly trust in historical performance? You could. But more importantly, you’ll likely be better off by preparing for what’s coming.

BEAM- the Top Crypto Gaming Project?BEAMUSDT – Breaking Out and Aiming for New Highs! 🚀
📈✨ BEAM is Up 7% Today - Can We Hit $0.05? 💹
BEAM is one of my top picks, and today it's up 7%, bringing us to $0.02. Having scooped up some BEAM at $0.005, we’re sitting comfortably now. If you're in this trade, make sure to take some profits to cover your initial investment.
I see a small breakout above $0.020 with my next target being $0.027. From there, I’m eyeing the orange level just under $0.050 for a larger profit-taking opportunity. With BEAM now over the $1 billion market cap, be mindful of potential whale activity as we push toward the next targets.
Volume remains modest, which is good news for now, but keep an eye on potential pullbacks to the $0.013 support level.
Let’s see if this breakout has the legs to reach our targets!
One Love,
The FXPROFESSOR 💙

Ready to Soar higher? Very likely in Uptober, yes!📈💥 SEI on the Rise - Is $1.10 Next? 💹
Happy "Uptober," everyone! SEI is showing strong momentum, up 3% today and already 100% higher from the $0.23 support, which marked a great entry for us. After a period of consolidation, I’m expecting an explosive move toward $0.60–$0.67 and eventually $0.77.
If SEI can break into the larger structure (parallelogram), we could be looking at $1.10, with the longer-term target of $1.50–$1.72 on the horizon. With China's rate cuts injecting billions into the markets and potential moves by the Fed, things are looking bullish.
SEI’s high-speed blockchain platform, engineered for Web 2.0 and packed with scalability and security, is one of my top picks. Currently ranked 53rd, SEI has the potential to break into the top 20 and possibly even the top 10 with continued development. October might just be the month to make this happen.
Let’s see how this unfolds. Stay tuned for more updates!
One Love,
The FXPROFESSOR 💙

Up 46% Since Last Entry. What's next?
🔥📊 SUI Surges 47% Since September - Is $3 Next? 💥
Since my last post on September 19th, SUI has soared by 47%, moving from $1.31 to the current $1.88. We’re now approaching the first major resistance at $2.03, where I'll be considering taking some profits. However, the next big target is at $3.02.
For more details on mid-term targets, be sure to check out my previous chart linked below. As always, October tends to be a historically strong month for the markets, so this momentum could continue.
Stay sharp, and let’s make the most of it!
One Love,
The FXPROFESSOR 💙
Main chart and levels:

Uptober Mode? - Will We See the Big Breakout?
📈🔥 Altcoins Ready for Uptober? 60% Breakout Probable! 🚀💥
It's been just 11 days since my last post, with TOTAL3 sitting at $584B. Now, as we step into October (or should we say "Uptober"?), the market cap has surged to $629B—almost 8% higher!
The chart is signaling a potential breakout at the $645B level, with a 60% probability given the current macroeconomic factors, including easing from China and potential interest rate cuts from the Fed. However, there are alternative scenarios: a 20% chance for sideways movement and another 20% for a drop back to $592B support.
This could be a pivotal moment for altcoins. What do you think? Let’s make the most of this exciting month!
One Love,
The FXPROFESSOR 💙
Big chart and previous (well timesd) breakout post here:

GRTUSDT - October Set to Ignite the Next Big Move?
🚀🔥 GRT Poised for a Breakout - October's Momentum is Building! 💥📈
Welcome to Uptober! As we enter a month historically favorable for crypto markets, GRT is shaping up for a potential breakout. We’ve moved from $0.15 to $0.18, and this 15-minute chart shows strong bullish signals, backed by key support levels.
I’m keeping my primary target at $1.97, with an ambitious moonshot scenario of $13.7! Stay tuned—this could be the moment we’ve been waiting for as October unfolds its magic. 📊🌕
Let’s make the most of it!
One Love,
The FXPROFESSOR 💙
ps. we keep our eyes on the charts as we live in nasty world and we can never relax, FUD or FOMO.... charts first: 0.1641 is a level that if someone must be adding to their position not subtracting!

October Picks: Stacks (STX) Gearing Up for new ATHs
📈🔥 October Picks: Stacks (STX) Gearing Up! 💥📊
Kicking off October with a promising setup! Historically a strong month for crypto, and Stacks (STX) is already up by 4% today. The chart reveals an ascending channel, with a rejection at 1.943.
Key Levels to Watch:
Support: 1.789 and 1.735
Breakout Zone: 1.95
Next Target: 2.76 🚀
This month, I’ll be sharing some of my favorite chart setups early on, so stay tuned for more picks coming soon! For more insights on STX, check out my previous analysis .
One Love,
The FXPROFESSOR 💙
Big chart and targets here:

Bullish breakoutMcade (Metacade) picked up liquidity around $0,005. A new week started very good and made a higher high. If we stay above the $0,007 and close at the end of the week above $0,007, more upward movement expected in UPTOBER!

Bearish Outlook on USDT Dominance (USDT.D)Hello Everyone! 👋
I hope you’re all doing well. I’ve shared my thoughts on the USDT.D price in the chart below. I believe this analysis could be useful for your trading decisions.
📈 Rationale:
Market Dynamics:
A decrease in USDT dominance typically reflects a shift in investor confidence toward altcoins, leading to increased liquidity and buying pressure.
Technical Analysis:
Recent price action indicates weakening in USDT.D. Indicators such as support a bearish outlook.
Impending Breakout:
A break below 4.28% to 4.31% could trigger swift market reactions, providing ample trading opportunities.
CRYPTOCAP:USDT.D
Best Regards

BTC Sept - Dec Historical Returns#BTC has performed very interestingly during September - December months.
Almost every single year had a make or break movement.
Check out the returns for every year
Given the very long reaccumulation / retracement that started in March this year, I expect some very impulsive movement towards the 90k region, which will mark the 5th wave, and start the 3rd wave for altcoins
