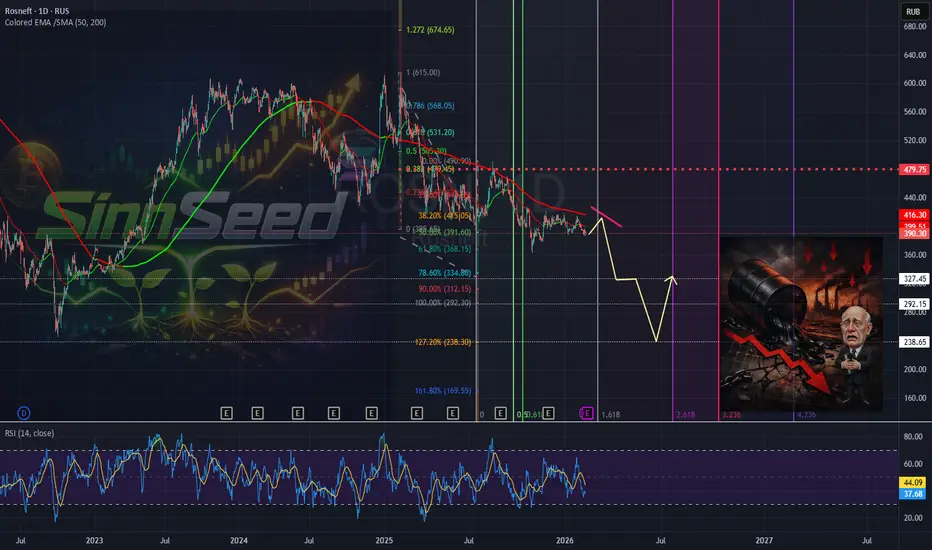
SinnSeed | ROSNEFT (ROSN) | Overview - 15.02.2026🛢 #SinnSeed | ROSNEFT (ROSN) | Overview: News, Financials, Forecast 🔗
🖥 Latest Developments & Impact on Stock Price
⚠️ Sanctions & Exports . In October 2025, the US included #Rosneft (along with #Lukoil ) in a new sanctions package. The consequences are already being felt:
🔴 Exports plunged ~32% by December 2025 — the Urals discount widened to 25 USD/bbl 🔴 Oil volumes stuck on tankers at sea — shares dropped 3.8–5.6% depending on the exchange 🔴 India's imports of Russian oil fell to the lowest since 2022 — ~1.1M bbl/day in January 2026
⚠️ The PCK Schwedt Problem. The German refinery, held under trust management, remains a point of tension. Sanctions threaten fuel supplies to Berlin. Rosneft has officially warned of the risks — deadline April 29, 2026.
💥 Incidents & Production. A series of #drone attacks in November–December 2025 damaged oil depots and #refineries . The result — a loss of 350K bbl/day in January 2026. No major new contracts. The company is pivoting to the domestic market and counting on tax incentives of ~10B RUB/year for 2026–2030.
📉 Combined effect: shares have lost 12–15% since October 2025. Financial crisis. H1 2025 profit collapsed by 68%. #CEO Sechin publicly blames Western restrictions. 🤥
📊 Financial Analysis | 9M 2025 (IFRS)
🔻 Revenue → 6,288B RUB (−17.8% YoY) 🔻 EBITDA → 1,641B RUB (−29.3% YoY) 🔻 Net Income → 277B RUB (−70.1% YoY) ▪️ Free Cash Flow → 591B RUB 🔻 Net Debt / EBITDA → 1.3x ▪️ Total Debt → ~36B USD
Quarterly Profit Dynamics: Q1 → 170B ▸ Q2 → 74B ▸ Q3 → 32B RUB The trend is clear — an accelerating decline. 🔽
Key Pressure Drivers:
🔻 Low oil prices + market surplus (~2.6M bbl/day) 🔻 Ruble appreciation eating into RUB-denominated revenue (thanks to the NWF and the fiscal rule) 🔻 High CBR key rate → debt servicing costs +2.5–3.8B USD 🔻 Declining gas production (−13.1%) and refining (−7.8%)
🔮 Forecast Through August 2026
The base case assumes continued sanctions pressure and a market surplus of ~2.4M bbl/day in 2026.
Выручка: −10–15% YoY → ~8T RUB/year, assuming Urals doesn't hold above 50 USD Net Income: stabilization or −20% → ~300–350B RUB/year
🔸 Upside support — tax incentives and the Vostok Oil project (launch in 2026, target capacity up to 2M bbl/day by 2030)
Debt load: Net Debt / EBITDA → 1.5–1.7x, with risk of increased borrowings
Stock: — if oil > 60 USD → rebound potential +5–10% — if oil < 60 USD → further decline likely −5–10%
Technical Picture 👨💻
📉 A correction to the 38.2% level indicates a strong downtrend.
By 20.03.2026, I expect a drop to 325 RUB. Followed by a continuation to 290 RUB. A potential impulse move toward the 260–240 RUB zone is possible, after which a local reversal could be considered.
No buying before 260 RUB .
What do you think about the forecast? Share in the comments.
Urals
The Calm Before the Storm: $16/Gallon Forecast by 2035Greetings to the seekers of signal amidst the noise. To those who prefer the cold clarity of reality over the polished narratives of mainstream forecasts.
While the majority are distracted by Valentine’s Day cards, we are looking at a "valentine" of a completely different scale—one written in crude oil, blood, and gunpowder across the pages of world history.
In the history of "Black Gold," mid-February isn't about romance; it’s about the hard-nosed handshakes that defined the fate of our civilization:
February 14, 1945: Aboard the USS Quincy, FDR and King Ibn Saud signed the blueprint for the modern world. This birthed the "Quincy Pact"—the foundation of the petrodollar system that has underpinned the global financial dominance of the United States for the last 80 years.
February 14, 1971: The Tehran Agreement struck the first blow to this monopoly. It signaled the end of the era where Western oil giants (the "Seven Sisters") dictated prices, shifting the initiative to the exporters of OPEC.
Today, February 14, 2026: We stand at the final decommissioning of these legacy rules. The old paradigm is collapsing; the Quincy Pact has been functionally annulled by history itself. The Strait of Hormuz is becoming the ultimate "bottleneck" through which the global economy must pass—with significant friction and at a heavy cost.
This is not just another market update. It is a Strategic Warning. While "market hype-peddlers" distract the public with fairy tales of a "Green Transition" and "Soft Landings," we will analyze why the world's primary energy source is preparing for a vertical lift-off. This surge will likely reset the savings of millions and force the public onto electric scooters—not out of environmental concern, but out of necessity driven by systemic inflation.
Today, we will break down the current phase using Elliott Wave Theory, identify which energy stocks are still in the "accumulation zone" before they hit the stratosphere, and take a look behind the curtain of global geopolitics where the final pieces are being moved for the endgame.
________________________________________
📈 Technical and Wave Analysis: The Super-Cycle Perspective
Prices are entering the home stretch before a vertical surge, a scenario we have already witnessed in precious metals. While many expected this move sooner, we must remain objective about the asset: the oil market is not just about supply and demand—it is the ultimate expression of global power and strategic monopolies.
To understand the future, we must acknowledge the psychological extremes of the past five years:
⚫️ 2020 (The COVID-19 Shock): A point of total capitulation. Brent TVC:UKOIL crashed to $17, and deliverable WTI futures TVC:USOIL famously committed "historical hara-kiri," dropping into negative territory at -$37 per barrel. The shock of a seller having to pay to get rid of their product was the ultimate "blood in the streets" moment.
⚫️ 2020–2022 (The QE Impulse): Massive monetary expansion and "helicopter money" created a violent inflationary pulse. Prices recovered by +600%, peaking near $135 in the first half of 2022. According to Elliott Wave theory, this entire move from $17 to $135 should be interpreted as Wave 1 of a new global bullish super-cycle.
⚫️ 2022–2026 (The Great Consolidation): For the last four years, the market has been trapped in Wave 2—the phase of disappointment and exhaustion.
Wave A (or W): The sharp correction from $135 down to $70.
Wave B (or X): A grueling two-year sideways grind (range-bound $70–$90) that forced out the last of the retail optimists.
Wave C (or Y): The recent "cleansing" dip toward $60, which served as the final flush before the next major impulse.
________________________________________
📊 The Great American Energy Paradox: Exporting Surplus, Importing Necessity
At first glance, the data seems contradictory: the United States is one of the world’s largest producers and exporters, yet it remains tethered to foreign supply. In 2024, the U.S. exported nearly 4 billion barrels of oil—over half of its total domestic production. This massive outflow of crude and petroleum products underscores America's status as a global energy powerhouse.
The Refinery Mismatch: Why export 55% of your production while continuing to import heavily, particularly from Canada? The answer lies in Quality and Configuration.
The Supply: Most U.S. shale production is "Light, Sweet" Crude (LTO)—low in sulfur and easy to process.
The Infrastructure: However, the massive refinery complexes on the Gulf Coast were engineered decades ago to process "Heavy, Sour" grades—the thick, high-sulfur oil typical of traditional giant fields.
Consequently, the U.S. exports its light surplus to global markets while importing the heavier grades its refineries actually crave. This isn't a failure; it’s a Logistical Optimization.
The Canadian Lifeline: In 2024, 61.7% of U.S. crude imports came from Canada. While South and Central America contribute about 16.3%, the dependency on our northern neighbor is the real story. Since 2013, Canada’s share of U.S. imports has skyrocketed from 33% to over 60%. Despite record domestic production of 13.4 million barrels per day, the U.S. refinery system—and by extension, its economy—is more reliant on Canadian "heavy" barrels than ever before.
________________________________________
⏳ The Current Setup: Accumulation and the "Market Flush" Risk
For the past year, "Black Gold" has been consolidating in a tight, frustrating range between $60 and $70 per barrel. For the retail speculator, this is a "boring" market; for Smart Money, this is a Class-A Accumulation Zone.
🗯 The Core Thesis: "Any price print below $70 should be viewed as an anomalous entry point—a generational 'gift' that will be envied in the years to come."
However, we must address the Tactical Deleveraging Risk. As we look toward a potential 40–50% correction in overextended Tech and Equity indices during 2026, oil will likely be caught in the "Margin Call Crossfire."
When systemic deleveraging begins, large funds sell what is liquid to cover what is losing. We should prepare for a "Flash Flush" toward $50—or lower in a 2020-style panic.
Why the "Flush" is Mathematically Necessary:
Total Capitulation: To wipe out "weak hands" and leveraged bulls who are betting on a bounce too early.
Asset Transfer: To move the final physical barrels from panicked retail hands into institutional vaults and the Strategic Petroleum Reserve (SPR) at bottom-tier prices.
Psychological Warfare: To create a "Death of Oil" narrative in the mainstream media, masking the beginning of the actual vertical impulse.
The Investor’s Playbook: A temporary dip to $50 is not a reason to flee; it is the ultimate opportunity to increase energy exposure. Historically, oil doesn't linger at these forced lows. The moment the Fed reactivates the printing presses to save the collapsing equity indices, and the geopolitical "Hormuz Trigger" is pulled, oil will be the first asset to enter a vertical price discovery phase.
This is where we get into the "Meat and Potatoes" for the Western investor—the actual numbers and the strategic logic that explains why the status quo is a ticking time bomb.
I’ve adapted the tone to be analytical yet urgent, framing the $300 target as a logical outcome of monetary debasement rather than just a "wild guess."
________________________________________
❓ What’s Next? The 2020–2035 Macro Forecast
Once the current "bottoming" structure completes, the market will enter Wave 3. In technical analysis, the third wave is the most powerful, the longest, and the most merciless to short-sellers. It doesn't offer "second chances" on pullbacks; it simply re-prices reality.
Short-term Volatility (2026): If the broader equity markets face a 30-50% deleveraging event, oil could see a sharp -30% "liquidity flush" toward $50. This will be a blink-and-you-miss-it event.
The Near-Term Goal: A return to the triple-digit zone—$100+. This is when the legacy media will start screaming about an "Energy Crisis," but for us, it’s just the beginning.
The Global Target: Long-term projections suggest a range of $300–$500 per barrel by 2030–2033.
While these numbers sound like hyperbole today, remember that Gold at $2,500+ sounded like a hallucination in the early 2000s when it traded at $250. When you factor in the debasement of fiat currencies, the dismantling of global supply chains, and a decade of chronic underinvestment in drilling, these targets aren't just possible—they are a mathematical inevitability.
________________________________________
📊 The "Canadian Shield" and the "Shale Cul-de-Sac"
There is a fundamental misunderstanding of U.S. energy "independence." Let’s look at the hard data:
The Technology Paradox: The U.S. is the #1 producer (21.7 million barrels/day), but it cannot consume its own "menu." American shale is Light Sweet Crude (LTO). However, 70% of the complex refinery capacity in Texas and Louisiana is "hard-wired" to process Heavy Sour (sulfuric) crude.
Canada as the Lifeboat: This is why U.S. imports from Canada have surged to 61.7% (approx. 4 million barrels/day). Canada provides the heavy bitumen that keeps U.S. refineries from seizing up. The U.S. is "addicted" to Canadian heavy barrels.
The Strategic Pivot: OPEC’s share of U.S. imports has cratered to 11.9%. The U.S. is physically separating from the Middle East, but they are still vulnerable to the global price set by OPEC+.
The Venezuelan Logic: Venezuelan crude is the "twin" of Canadian heavy oil and the perfect feed for U.S. refineries. More importantly, it is significantly cheaper to extract than Canadian oil sands.
The "Trump" Realism: Instead of fighting environmental battles over the Keystone XL pipeline from the North, it is strategically more efficient to secure the Venezuelan supply to the South. A short sea route through the Gulf of Mexico is the ultimate insurance policy.
________________________________________
🌡️ The Gasoline Pulse: Breaking the "1–2–4" Paradigm
To gauge where we are going, ignore the tech-heavy Nasdaq and look at the price sign at your local gas station. The FRED:GASREGW (US Regular Gas Price) is the true pulse of the economy, reflecting the real cost of logistics and consumer purchasing power.
The Era of Social Stability (1990–2022): For 35 years, the Western world operated under the "1–2–4 Rule." This range was the "holy grail" of social peace:
The 90s: Post-Cold War dividend. Gas was stable at $1–$1.50.
The 2000s: Emerging market demand shifted the corridor to $2–$4.
The 12-Year Trap (2008–2020): After the 2008 peak ($4), prices spent 12 years in a "Symmetric Triangle." In Wave Theory, this is a compressed spring, coiling energy for a violent release.
In 2020, as the world exited the pandemic shock, the "spring" finally snapped. Price shot through the $4 resistance and hit an all-time high of $5 by the summer of 2022. What the public thinks is a "return to normal" right now is actually a re-test of the breakout. We are sitting on the old $3–$4 ceiling, which has now become the new floor.
________________________________________
🚀 The Transition: Entering the "4–8–16" Reality
What the public mistakes for a "return to normal" is actually a textbook technical move: a prolonged re-test of a broken resistance level. From a macro-technical perspective, the price has simply returned to the midpoint of the old $2–$4 range to establish a massive new support base.
As of early 2026, we’ve seen prices dip toward $2.77/gallon—a nearly 50% retracement from the 2022 all-time highs. To the untrained eye, it looks like the crisis is over. To the analyst, it looks like a spring being coiled.
The 2026–2040 Paradigm: The era of $2.00 gasoline is officially a museum exhibit. We are entering a cycle where price targets are essentially doubling across the board:
The Floor: $4.00 (the old ceiling).
The Median: $8.00.
The Cycle Target: $16.00 per gallon.
This isn't just "price movement"; it is a forced transformation of the American lifestyle. With 80% of U.S. logistics dependent on trucking, $12–$15 gasoline makes traditional internal combustion (ICE) ownership a luxury and turns standard delivery services into "premium" expenses.
This serves as a cynical but effective tool: using an inflationary shock to "reset" the public’s savings and move them toward a digital, electric-based economy—not through incentives, but through the sheer inability to afford the old way of life.
________________________________________
🧮 The Math of the "CP-Lie": Inflation Alchemy
When gasoline prices inevitably surge by +300% toward the $12 mark, it will trigger a chain reaction that no amount of statistical massaging can fully hide:
Direct CPI Contribution: A surge of this magnitude adds an immediate 10–15% to the headline Consumer Price Index.
The Real Number: Combined with baseline inflation, we are looking at CPI prints of +20%—levels associated with war-time economies or hyperinflationary collapses.
The "Statistical Pivot": To prevent a total panic, expect the Bureau of Labor Statistics (BLS) to engage in "methodological adjustments." We will likely see the "weighting" of gasoline in the CPI basket reduced, under the guise that "consumers are driving less," thereby artificially dampening the reported inflation rate.
The objective is clear: create such friction for ICE vehicle owners that the transition to EVs (Tesla and its peers) becomes a survival tactic rather than a choice.
________________________________________
📈 The SPR Trap: Refilling the War Chest
While oil prices are being "marinated" in this lower range, the U.S. administration is executing a classic "buy the dip" strategy. Looking at the US Strategic Petroleum Reserve (SPR) ECONOMICS:USCOSPRE chart, we are seeing the active reconstruction of the nation's energy cushion.
After the previous administration drained the reserves to combat the 2022 price spike, the current leadership has pivoted to aggressive accumulation. Over the last 30 months, reserves have climbed by 70 million barrels (+20%), rising from a critical floor of 354 million to the current 415 million barrels.
The Market Signal: This accumulation creates a massive, artificial floor under the market. As long as "Texas Tea" stays below $80, the U.S. government remains the ultimate "Whale" buyer, preventing a total price collapse. They are racing to restore the strategic buffer before the Semiquincentennial (250th Anniversary of the US) celebrations and the next election cycle are over.
The Warning: The current "discount" at the pump ($2.80/gallon) is a temporary pre-election/pre-celebration gift. Once the SPR tanks are topped off and the political cycle concludes, the accumulated supply deficit will hit the consumer with triple force. The safety valve is being closed—those barrels are now being held for the "Black Swan" of a hot war, leaving the domestic market to face the new $8–$16 paradigm alone.
________________________________________
📊 The Inventory vs. Production Gap: A Glaring Anomaly
When we look at the global energy map, we see a striking contradiction that the mainstream media rarely discusses. It is the contrast between "The Sprint" (U.S. Shale) and "The Marathon" (Conventional Super-Giants).
The Reserves Paradox: Venezuela holds 19.4% of the world’s proven oil reserves (#1 globally), yet its current production is a fraction of its potential due to years of infrastructure decay and sanctions.
The U.S. Mirage: In contrast, the United States—currently the world's #1 producer—controls only 2.9% of global reserves.
This is the definition of a "burn rate" problem. The U.S. is sprinting to maintain its dominance while its underlying "fuel tank" is dangerously low compared to its competitors.
♟️ The Concentration of Power: The New Geopolitical Axis
The "Big Three"—Venezuela, Saudi Arabia, and Iran—collectively control nearly 50% of the planet's oil. This is the ultimate geopolitical fulcrum. If these three nations coordinate their policies (or fall under the influence of a single bloc like BRICS+), they possess the absolute power to dictate global energy prices.
The "Refinery Symbiosis" (The Hidden Detail): Venezuelan oil is primarily Extra-Heavy Crude from the Orinoco Belt (API gravity <15°). It is difficult to extract, but here is the catch: the most sophisticated refineries on the U.S. Gulf Coast were specifically "over-engineered" to process exactly this type of heavy, sulfurous grade.
Venezuela has the raw material.
The U.S. has the specialized "kitchens" to cook it. It is a symbiotic relationship that Washington cannot ignore.
⚠️ The Shale Limit: America’s "Pedal to the Metal" Problem
On paper, the U.S. looks like an untouchable hegemon, pumping 20 million barrels per day (mb/day)—nearly double the output of Saudi Arabia or Russia. However, this record production is not a sign of infinite strength; it is a sign that the U.S. is redlining its engine.
Depletion Rates: The nature of shale (LTO) is that well productivity drops off a cliff very quickly. To maintain 20 mb/day, U.S. operators must drill faster and more aggressively every year just to stand still. This is "production at the limit."
OPEC’s "Wait and See" Strategy: While the U.S. pumps at 100% capacity, Saudi Arabia and Russia are intentionally "idling." They have significant spare capacity but are playing the long game—saving their resources and manipulating the market by tightening supply.
The Strategic Dead End: The U.S. is depleting its scarce 2.9% reserve base at record speed, leaving itself with zero margin for error in the coming decade.
🕵️ The Macro Assessment: Preparing for the "Grand Swap"
When you overlay these two realities—depleting U.S. reserves vs. massive Venezuelan potential—the true picture of the global energy crisis emerges:
The Geopolitical Cul-de-Sac: To maintain superpower status and prevent domestic gas prices from hitting $15/gallon, the U.S. vitally needs access to foreign heavy reserves.
Venezuela as the Only Exit: It is the only country in the Western Hemisphere that can replace the depleting U.S. shale fields. Its 303 billion barrels are the "Holy Grail" for Washington’s long-term survival.
The Iranian Variable: While Iran pumps 5.1 mb/day, it remains a fierce competitor. The strategy is clear: neutralize or bypass Iranian influence while "on-shoring" Venezuelan supply. This is the only way for the U.S. to reformat the market and secure its energy leadership for the next 30 years.
The Bottom Line: We are witnessing a global "castling" move. The U.S. is pumping its own soil dry to bridge the gap until it can secure control over the Venezuelan resource. This isn't just economics; it's a fight for the physical survival of the American system. Without the Venezuelan "backstop," the current U.S. production record will turn into a precipitous decline within years, threatening both the Dollar and the "American Dream."
________________________________________
📊 The Strategic Playbook: Black Gold Through 2035
On a decade-long horizon, the logic is as simple as it is cold: focus on the two sectors that sit at the very beginning of the value chain: E&P (Exploration & Production) and Oilfield Services.
In an environment of global currency debasement and fractured supply lines, these companies act as the ultimate inflation sponges. They own the physical molecules and the proprietary technology required to extract them. This allows them to pass rising costs directly to the end consumer, protecting—and often expanding—their margins while the rest of the economy struggles to breathe.
________________________________________
🏁 Epilogue: On the Ruins of the Old Order
________________________________________
The world we’ve known for decades—the world of cheap logistics, affordable V8 muscle cars, and Petrodollar-induced stability—is evaporating like a drop of gasoline on hot asphalt. While the general public is distracted by currency swings and the latest tech gadgets, the "curtain" has already been raised on the Era of Great Scarcity.
We are at a unique and daunting juncture in history. The 2026–2028 period will be remembered as the moment when financial masks were stripped away and virtual wealth (the "zeros" in bank accounts) lost the battle against physical reality.
The choice today is binary:
You understand the mechanics of this Systemic Wealth Transfer and own the assets physically required for this civilization to function.
Or, you become the "fuel" that pays for the elite's transition into the new technological paradigm.
A Final Warning: When oil moves into the triple digits and stays there, and supply chains finally snap under the weight of geopolitical ambition, it will be too late to seek a "safe haven." Inflationary shocks do not respect borders or political affiliations—they simply reset the wealth of those who lived in the illusion of eternal abundance.
The companies identified in this report are not just "tickers" on a screen; they represent your seat in the First Tier—the group that exits this storm with real capital instead of a pile of devalued paper.
I have converted the chaos of the headlines into a clear strategic roadmap. If this analysis has challenged your perspective or sharpened your focus, hit the "Rocket" 🚀 icon below.
See you at the "refueling stations of the new reality." Fasten your seatbelts; we are entering a zone of maximum turbulence. The ascent will be vertical, and only the prepared will remain on board.
________________________________________
🙏 "Thank you for your attention to this matter." ©
☘️ Good luck, and stay vigilant.
📟 Over and out.

Analysis of the BRENT chart with expectations for 2025-2026◽️Technically, all conditions for the completion of the second wave correction have been met, and now quotes can be safely reversed up. However, current events in the global economy do not yet provide grounds for confidently asserting this. Locally, the price may still be driven down to $50 per barrel and even slightly lower. One way or another, it is important to understand a simple thing: everything below $70 per barrel should be seen as an opportunity to buy oil and everything related to it cheaply.
◽️According to my estimates, there is probably still time for deliberation on purchases until the end of spring. But further, from the beginning of summer, I expect a sharp rise in prices amid the escalation in the Middle East. From above, in the $100-150 range, growth will likely be contained for some time, which will be interpreted as the formation of sub-waves (i)-(ii), where after sharp rise in the first sub-wave from approximately $50-60 to $120-130, a local correction will follow within the second sub-wave.
◽️The growth period may take 3-6 months, and the correction to it another 2-4 quarters, and then a breakout of the $120-150 resistance zone and further "to the moon" in the third waves is expected.
🙏 Thank you for your attention and 🚀 for the idea.
☘️ Good luck, take care!
📟 See you later.

#BRENT Gold/Oil Ratio, Stocks/Oil RatioOn chart I tried to fit three instruments at once:
1️⃣ Bottom (white) chart: Gold to Oil Ratio.
2️⃣ Middle (red) chart: BRENT crude oil price.
3️⃣ Top (blue) chart: Dow Jones Industrial Average to Oil Price Ratio.
1️⃣ The first thing to pay attention to is the white chart: GOLD/OIL Ratio , specifically where this ratio is today. Over the last 75 years of observation, the ratio has reached unprecedented levels. The spread is once again testing the record values of the COVID-19 hysteria of 2020, when panic caused oil prices to plummet sharply. At the current moment, the ⚖️Gold to Oil Ratio is around the 50 mark, meaning that one ounce of gold can buy as much as 50 barrels of oil. Over the last century, when the spread exceeded 25 barrels per ounce, it was interpreted as a moment of cheap oil relative to gold. Today, against the backdrop of the chaos reigning in the world, the GOLD/OIL Ratio is entering what can be called the " MAGA Mega Cheap Oil Zone" if it is again valued in gold, and not in fiat green piece of paper. Further, we should expect at least a return to its average values, and here three scenarios are possible:
1. First Scenario. Let's assume that today's price of $60-70 per barrel of oil is "fair" and this is where it belongs. In this case, gold is currently strongly overvalued, and it's time for a correction from $3300 to the $2500-2800 range.
2. Second Scenario. Everything is fine with gold, and it will continue to rise without correction. In this case, oil is severely undervalued relative to gold, and it's time for it to catch up so that the spread of 50 returns to its average values in the 10-25 range.
3. Third Scenario suggests that both oil is significantly undervalued and gold has risen too sharply, and now it's time for a correction in gold and a rise in oil prices.
In any of the three scenarios described above, the GOLD/OIL Ratio will sooner or later return to its normal values of the last century, that is, to the range of 10-25 barrels per ounce of gold. And most likely, we will see the third scenario unfold this year, where against the backdrop of a stock market crash, problems with liquidity in the global financial system, the entry of Western economies into recession, as well as the start of a full-scale war in the Middle East this summer, all of this together will provoke a correction in gold and an explosive growth in oil prices, and consequently, a return of the gold to oil ratio to its historical averages.
2️⃣ On the second (red) linear chart of BRENT crude oil prices , everything looks quite ordinary. If we briefly describe the chart for the last twenty years in simple terms, it's worth saying the following: since 2008, they have been trying in every possible way to keep the oil price below $130 per barrel, and as soon as the price approaches the $120-150 zone, some "invisible hand of the market" throws it down. The first test of this resistance zone occurred during the GFC global financial crisis of 2008, the second test with prolonged trading took place during the Eurozone debt crisis of 2011-2014 (culminating in the Greek default), and the third test was in 2022, as a consequence of the monetary madness of 2020 (global lockdown, unlimited QE, and as a result: a wave of monetary + structural inflation worldwide). One way or another, from the fourth or fifth time, the $120-150 per barrel boundary will be finally broken. And then the price above, like a samurai, "has no destination, only the path," and this path is upwards, "to the moon"🚀
3️⃣ Now it remains to consider the last (blue) chart at the top, the ⚖️Dow Jones Industrial Average to Oil Price Ratio . This chart should be understood as a long-term trend indicator of cycle changes in financial markets. When it rises, it implies a 10 or even 20-year growth cycle in the stock market, and accordingly, corrections in the commodity market. And when it falls, then vice versa, the cycle changes to growth in the commodities market and a correction in the risky stock market, which also lasts one or even two decades. Today, it can be said with certainty that since 2020, the cyclicality has changed, and we are just entering a ten or even twenty-year growth trend in the commodity sector, which portends a change from the "eternally" growing trend in the American stock market to a fall or at least a multi-year sideways movement a la the 1970s.
🙏 Thank you for your attention and 🚀 for the idea.
☘️ Good luck, take care!
📟 See you later.

OIL short term UP!Despite recent OPEC+ agreement, oil prices look like it will not make them bullish for long. Long-term forcast - it's going down. Right now there is a possibility for short-term pullback.


