US DOLLAR ANALYSISOn the weekly chart, the US Dollar Index is clearly trading in a long-term bearish structure. Price has been moving under a strong descending trendline that has capped every major rally since the 2022 high, showing that sellers remain active at higher levels. After the sharp rejection near the 110 area earlier in 2025, the dollar dropped aggressively and broke below the important 100–101 support zone, which had previously acted as a strong demand area. Although price attempted to stabilize and briefly retested this zone, it failed to reclaim it, confirming that former support has now turned into resistance. The recent candles show weak upside momentum and consolidation below this key level, which signals continuation weakness rather than strength. As long as the index remains below the descending trendline and the 100–101 resistance zone on a weekly closing basis, the broader bias stays bearish, with downside pressure still dominant and no clear sign of a long-term reversal yet.
US-DOLLAR

AUDUSD Intraday Technical Analysis - 10 Nov 2025AUDUSD Intraday Technical Analysis - 10 Nov 2025
Australian Dollar/US Dollar at 0.65320 (3:40 PM UTC+4) — consolidation breakout imminent.
📌 Market Context: Wyckoff Phase D accumulation post-August correction; Dow Theory secondary uptrend forming; Gann Square-of-9 targets 0.6580/0.6480.
🗺️ Multi-Timeframe Pulse:
1D: Inverted head-and-shoulders pattern neckline at 0.6500; RSI 55 (neutral); Ichimoku cloud support 0.6420; bullish reversal signal forming.
4H: Rising channel 0.6480-0.6580; EMA21>EMA50 (golden cross); VWAP from Sept 20 = 0.6510 (support level).
1H: Cup-and-handle breakout attempt from 0.6480 base; BB midline 0.6520; VWAP slope neutral-bullish.
30M: Symmetrical triangle 0.6500-0.6560; hidden bull divergence on RSI; volume contracting.
15M: Bull flag over 0.6510; Tenkan>Kijun bullish alignment; stochastic RSI ready for extension.
5M: Falling wedge retest 0.6500; hammer candlestick signals intraday demand; false breakout risk above 0.6560.
🎯 PRIMARY LONG SETUP
Entry: 0.6510-0.6525 (triangle support + VWAP) — confirm on 15M bullish close >0.6535.
Stop Loss: 0.6485 (below triangle base).
Target 1: 0.6555 (+35 pips).
Target 2: 0.6580 (+60 pips — channel top).
Target 3: 0.6620 (+100 pips — harmonic extension).
Confirmation: RSI>55, volume +20%, VWAP support holding.
⚡ MOMENTUM ADD: Scale above 0.6580 ONLY if RSI>65 + volume surge; trail stop to 0.6560.
🔻 REVERSAL SHORT SETUP
Entry: 0.6600-0.6625 (supply zone) — trigger on bearish engulfing + RSI divergence.
Stop Loss: 0.6650 (above channel resistance).
Targets: 0.6560 → 0.6520 → 0.6480 (Gann support).
Confirmation: 5M/15M RSI bearish divergence; BB upper band rejection.
🚨 BREAKOUT PROTOCOL:
BULL: 1H close >0.6580 confirms H&S breakout; target 0.6700; move stop to BE+15.
BEAR: 1H close <0.6500 with volume expansion triggers retest of 0.6420 cloud support.
📊 INDICATOR SNAPSHOT: BB squeeze (30M) tightening; MACD histogram positive; VWAP slope neutral-up; EMA21 acting as trigger line on 1H.
⚠️ PATTERN ALERTS: Harmonic bat PRZ at 0.6600; H&S neckline breakout >0.6500 = trend confirmation; channel failure <0.6510 = Wyckoff spring risk.
📈 TIMING & RISK: RBA decision watch; Gann 90° cycle 20:00 UTC; expect 0.80% intraday range. Risk ≤1% per setup; avoid chasing; lock gains at TP1.
Educational analysis only. Trade with your plan, manage risk, adapt to live price action.

EURUSD TIMEFRAME-BY-TIMEFRAME ANALYSIS# 💱 EURUSD (EUR/USD) COMPREHENSIVE TECHNICAL ANALYSIS 🎯
## Week of November 10-14, 2025 | Intraday & Swing Trade Mastery
Close Price: 1.15640 | Entry Point: November 8, 2025, 12:54 AM UTC+4 📊
## 🔍 EXECUTIVE SUMMARY - MULTI-TIMEFRAME PERSPECTIVE
EUR/USD is trading at a critical technical inflection point with strong multi-timeframe alignment signaling imminent directional breakout. Elliott Wave analysis reveals completion of corrective cycles, positioning for next impulse leg targeting 1.1650-1.1750 extension zone with substantial momentum. Bollinger Bands display classic compression squeeze pattern —volatility condensation preceding directional explosion. RSI across all timeframes maintains neutral-bullish bias (52-65 range)—optimal momentum positioning without extreme overbought conditions. Volume clustering at 1.1550-1.1630 represents significant institutional accumulation foundation. Wyckoff spring tests near 1.1500-1.1520 provide aggressive entry triggers. Harmonic pattern convergence at 1.1680-1.1750 resistance signals breakout confirmation with measured move targets extending to 1.1850+. ECB/Fed policy divergence supports directional clarity emerging this week.
## 📊 TIMEFRAME-BY-TIMEFRAME ANALYSIS
### 5-MINUTE (Scalping Precision) ⚡
Candlestick Formation: Japanese candles reveal micro-consolidation with breakout attempts at support zones. Evening Star rejection formations detected at 1.1680-1.1710 intraday resistance creating short opportunities.
Elliott Wave 5M: Sub-wave completion indicates Wave 4 micro-consolidation finalizing. Wave 5 breakout anticipated above 1.1650-1.1680 with targets 1.1720-1.1780 (measured move).
Bollinger Bands: Upper compression mode—middle band at 1.1630 acts as pivot point. Lower band rejection (1.1550-1.1580) creates scalp-long setups with excellent risk/reward ratios.
RSI (14) Analysis: RSI oscillating 48-62 range—neutral territory with minor divergences forming. Bullish divergence at 1.1550 support signals buyer engagement; caution on 68+ resistance approach.
Micro Support/Resistance: 1.1550 (micro-support) | 1.1600 (POC cluster) | 1.1640 (pivot) | 1.1690 (intraday resistance) | 1.1740 (scalp target)
Volume Signature: Volume concentrated 1.1600-1.1660 zone—institutional marker established. Breakout volume >50% above average required above 1.1690 for sustained move above 1.1750.
VWAP Alignment: Price oscillating around session VWAP at 1.1625—each touch generates scalp opportunity. Upper VWAP band at 1.1710; lower support at 1.1550.
### 15-MINUTE (Quick Swing Gateway) 🎢
Candlestick Patterns: Engulfing bars forming at support zones—bullish engulfing at 1.1570 zone confirms reversal attempts. Three-candle patterns (flag continuation) with 50-80 pips breakout potential.
Harmonic Pattern Recognition: Gartley Pattern potential completion near 1.1560-1.1620 PRZ (Potential Reversal Zone). Exceptional risk-reward at 1:3.5 for harmonic traders. Butterfly variant also forming.
Wyckoff Accumulation Phase: Classic accumulation evident—small barometer move (SBM) nearing completion. Spring test anticipated 1.1480-1.1510 zone; markup phase targets 1.1750-1.1850.
Bollinger Bands (15M): Band squeeze intensifying—historical volatility expansion suggests 70-120 pips moves follow. Upper band resistance at 1.1740; lower band support at 1.1520.
Volume Profile (15M): Point of Control (POC) at 1.1630—prime concentration zone. Volume surge >55% required confirming breakout above 1.1710. Imbalances favor upside significantly.
Ichimoku Cloud (15M): Price consolidating below cloud edge—Tenkan-sen at 1.1700 = resistance pivot. Kijun-sen (1.1660) = critical secondary support. Cloud support 1.1540-1.1610.
EMA Structure: EMA 9 (1.1650) above EMA 21 (1.1610)—bullish alignment confirmed. Price above both = intraday strength maintained.
### 30-MINUTE (Intraday Swing Axis) 🔄
Pattern Formation: Symmetrical Triangle pattern consolidating with apex near 1.1700. Ascending triangle variant shows bullish bias—breakout above 1.1680 targets 1.1780-1.1850 extension.
Dow Theory Application: Confirming higher highs/higher lows structure. Secondary trend bullish; pullbacks to EMA 20 (1.1640) = optimal swing entry zones identified.
RSI Divergence Setup: Positive RSI divergence confirmed—price making lower lows (1.1540) while RSI forms higher lows (42 level). Classic reversal setup targeting 1.1720 minimum.
Exponential Moving Average: EMA 9 (1.1665) = core support pivot. EMA 21 (1.1610) = secondary support. EMA 50 (1.1500) = structural hold level. Bullish ribbon alignment intact.
Support Architecture: 1.1500 (EMA 50/structural) | 1.1560 (demand zone) | 1.1610 (volume cluster) | 1.1650 (EMA 9 dynamic)
Resistance Architecture: 1.1680 (triangle formation) | 1.1750 (measured move target) | 1.1800 (weekly resistance) | 1.1850 (extension)
Volume Analysis (30M): Increasing volume on recent bars—accumulation signature strong. Buy volume exceeding sell volume confirms institutional interest significantly.
### 1-HOUR (Core Swing Trade Engine) 🎯
Elliott Wave Structure: Major wave analysis suggests Wave 3 completion near 1.1750. Current Wave 4 correction targets 1.1650-1.1700 support zone. Wave 5 impulse anticipated—target: 1.1850-1.1950.
Pennant Formation: Classic Bullish Pennant pattern forming—breakout confirmation above 1.1710 validates pattern. Pole height measured move = 1.1850+ realistic target.
Bollinger Bands (1H): Upper band at 1.1800 = squeeze breakout target. Middle band (1.1700) = bullish support zone. Lower band rejection (1.1500) creates swing longs with excellent R/R.
VWAP Daily: EUR/USD trading above daily VWAP at 1.1600—bullish gradient confirmed. Each hourly candle close above VWAP strengthens continuation probability.
Volume Profile Hotspot: Heavily traded at 1.1600-1.1660 (accumulation zone) and 1.1710-1.1780 (resistance cluster). Imbalances above 1.1800 suggest vacuum-fill potential.
Ichimoku Cloud Alignment: Price above Senkou Span A (1.1700) & Span B (1.1660)—cloud thickness indicates strong support. Chikou Span above candles = bullish confirmation. Cloud color: BULLISH GREEN.
Gann Theory Application: 45-degree angle from swing low (1.1450) establishes rally trajectory. Resistance at 38.2% Fibonacci extension (1.1750) precedes aggressive breakout phase.
Support Tiers 1H: 1.1500 (structural hold) | 1.1570 (EMA support) | 1.1620 (Kijun-sen) | 1.1660 (accumulation zone)
Resistance Tiers 1H: 1.1710 (breakout trigger) | 1.1760 (extension) | 1.1800 (major level) | 1.1850 (impulse target)
### 4-HOUR (Swing Trade Thesis Foundation) 💼
Inverse Head & Shoulders Pattern: Potential IH&S formation completing—left shoulder (1.1450), head (1.1400), right shoulder completing (1.1500-1.1560). Neckline breakout at 1.1710 targets 1.1900-1.2000 extension.
Wyckoff Accumulation Deep Dive: Institutional buying signature evident—SBM (small barometer move) completion imminent. Spring test to 1.1480-1.1510 anticipated; subsequent markup phase targets 1.1850-1.2000.
RSI 4H Analysis: RSI at 56-68 range—bullish bias maintained. Room for upside extension without extreme overbought. RSI above 74 targets 1.1900+; below 34 = defensive posture required.
Cup & Handle Formation: Potential bullish Cup pattern visible on 4H—handle stabilization near 1.1650-1.1700. Breakout above handle (1.1760) targets cup depth extension = 1.1850-1.1950.
EMA Ribbon Structure: EMA 8 (1.1680), EMA 13 (1.1660), EMA 21 (1.1610), EMA 50 (1.1500), EMA 200 (1.1350)—BULLISH ALIGNMENT PERFECT. Compression/expansion cycles identify momentum phases.
Support Tiers 4H: 1.1450 (structural support) | 1.1500 (accumulation) | 1.1600 (pivot) | 1.1660 (demand cluster)
Resistance Tiers 4H: 1.1710 (key breakout) | 1.1760 (extension) | 1.1800 (major target) | 1.1900 (weekly projection)
Volume Signature 4H: Accumulation volume bars > distribution bars—bullish bias maintained. Volume nodes clustering at 1.1600-1.1660 indicate strong institutional support zone.
### DAILY CHART (Macro Swing Thesis) 📅
Elliott Wave Macro: We're potentially in Wave 3 of larger cycle—aggressive expansion still possible. Wave structure supports break of 1.1800 targeting 1.1950-1.2100 daily close objectives.
Double Bottom Recognition: Historical Double Bottom pattern near 1.1350-1.1450 support—confirmed breakthrough above 1.1710 neckline triggered. Second target near 1.1900-1.2000.
Bollinger Bands Daily: Upper band at 1.1900 = realistic daily target zone. Mean (1.1750) = healthy pullback support. Band slope indicates volatility expansion—expect 100-200 pips daily ranges.
Volume Profile Daily: Strong buying volume bar at 1.1500-1.1650 zone—institutional accumulation marker established. Selling volume decreasing—demand controls trend absolutely.
Ichimoku Cloud Daily: Cloud thickness growing—bullish trend strengthening substantially. Cloud support around 1.1650-1.1750 zone. Kumo breakout anticipated—targets cloud top at 1.1800-1.1900.
Harmonic Analysis Deep: Butterfly Pattern potential completion—PRZ at 1.1710-1.1780 suggests reversal zone OR breakout confirmation. Confluence amplifies probability of extension.
Gann Angles & Fibonacci: 50% retracement (1.1550) + 61.8% extension (1.1850) = key reversal zones. Gann fan angles suggest 1.1800-1.1900 as structural resistance before continuation.
Key Daily Support: 1.1400 (psychological/structural) | 1.1500 (accumulation zone) | 1.1600 (demand level) | 1.1700 (midpoint)
Key Daily Resistance: 1.1710 (breakout trigger) | 1.1780 (extension) | 1.1850 (measured move) | 1.1950 (weekly target)
Trend Confirmation: Higher highs & higher lows maintained—uptrend intact. Daily close above 1.1800 = strong continuation signal targeting 1.2000+ next level.
## 🎪 TRADING SETUP PLAYBOOK - NOV 10-14
### BULLISH SCENARIO (Probability: 80%) ✅
Trigger: 4H candle close above 1.1760 + volume surge (>50% above average) + RSI above 64
Entry Zone: 1.1700-1.1750 (with breakout confirmation signal)
Target 1: 1.1780 (TP1) | Target 2: 1.1820 (TP2) | Target 3: 1.1900 (TP3) | Target 4: 1.1950 (TP4)
Stop Loss: 1.1620 (below EMA/structural support)
Risk/Reward: 1:3.2 (excellent asymmetric setup)
Trade Duration: 18-72 hours (prime swing window)
### BEARISH SCENARIO (Probability: 20%) ⚠️
Trigger: Daily close below 1.1650 + volume increase + RSI divergence failure
Entry Zone: 1.1760-1.1850 (short setup)
Target 1: 1.1710 (TP1) | Target 2: 1.1650 (TP2) | Target 3: 1.1600 (TP3)
Stop Loss: 1.1900 (above resistance)
Risk/Reward: 1:1.6 (acceptable but lower probability)
Trade Duration: Watch for trend reversal confirmation first
## ⚠️ VOLATILITY & OVERBOUGHT/OVERSOLD CONDITIONS
Current Volatility Status: Moderate compression → Expect significant expansion imminent
5M/15M RSI: 48-62 range (neutral)—room for 25-50 pips movements | Scalp target zones
30M/1H RSI: 52-66 range (bullish bias, optimal zone)—sweet spot for swing entries
4H RSI: 56-70 range—approaching caution zone but room to extend | Safe for core swings
Daily RSI: 60-74 range (approaching extremes)—be defensive if daily RSI>76 | Take profits aggressively
Overbought Recognition Points:
RSI daily >75 combined with upper Bollinger Band rejection = immediate profit-taking
Ichimoku cloud top penetration fails (bearish candle rejection) = trend exhaustion signal
Volume declining on breakout attempt = false breakout warning signal
Harmonic pattern PRZ exact hit without follow-through = reversal likely imminent
Oversold Bounce Setups:
RSI 1H <32 on support touch = high-probability bounce back to 1.1750-1.1800
Price below EMA 50 (1.1500) + RSI <30 = aggressive accumulation zone
Spring test below 1.1490 with volume surge = Wyckoff spring reversal trigger
Harmonic pattern PRZ support bounce = measured move extension targets activated
## 🎯 ENTRY & EXIT OPTIMIZATION STRATEGY
### OPTIMAL ENTRY TIMING
For Scalpers (5M): RSI bounce from 44-50 zone after Band lower touch = 15-25 pips scalp (1-3 min holds)
For Quick Swings (15M-30M): 15M candle close above 1.1690 with 4H alignment = 60-100 pips swing (30 min-2 hour holds)
For Core Swings (1H-4H): 4H pennant breakout above 1.1760 on volume = 150-250+ pips target (hold 12-48 hours)
For Position Swings (Daily): Daily close above 1.1800 = continuation play targeting 1.1950-2.0000 (hold 5-7 days)
Best Entry Windows: Asian session overlap (22:00-8:00 UTC), London open (8:00 UTC), NY close (21:00 UTC)
### EXIT STRATEGIES & PROFIT TAKING
Take Profit Levels: TP1: Fibonacci 38.2% (1.1760) | TP2: Harmonic PRZ (1.1820) | TP3: Daily Band upper (1.1900) | TP4: Weekly target (1.1950)
Stop Loss Placement: Always below most recent swing low + 20 pips (strict risk management priority)
Trailing Stops: Activate at TP2—trail with 30-40 pips buffer for 4H+ trades (lock in profits)
Breakeven Exit: Move stops to entry after 1:1 risk/reward achieved—eliminate emotional trading
Partial Profit Strategy: Close 25% at TP1 | 25% at TP2 | 25% at TP3 | Let 25% run to TP4 (maximize winners)
## 🔔 REVERSAL & BREAKOUT RECOGNITION CHECKLIST
### REVERSAL SIGNALS TO MONITOR:
RSI positive divergence (lower price lows, higher RSI lows) = bullish reversal setup high probability
Candlestick engulfing patterns at support/resistance zones = trend reversal confirmation strong signal
Volume profile breakdowns (declining volume on breakout attempts) = false move warning immediate
Ichimoku Cloud rejection (price fails to penetrate cloud layer) = structural resistance confirmed
Harmonic pattern completion at exact PRZ = reversal zone probability increases significantly
Elliott Wave 5th wave failure (truncation) = impulse completion = reversal imminent trigger
Gann angle break through significant angle = trend line break = reversal trigger activated
### BREAKOUT CONFIRMATION RULES:
Close beyond resistance with >50% volume surge above average = confirmed breakout signal strong
RSI crosses above 60 for bullish breakout, below 45 for bearish breakout confirmation
VWAP alignment with directional move = institutional participation confirmation strong
Bollinger Band breakout with band expansion (squeeze release) = volatility expansion confirmed immediate
Multiple timeframe confluence (5M + 15M + 1H + 4H aligned) = highest probability setup attainable
Ichimoku Cloud break (price clears all clouds with bullish candles) = strong continuation signal
Volume imbalance (ask volume > bid volume) = directional sustain likelihood increases significantly
## 💡 WEEK FORECAST SUMMARY - NOV 10-14
Monday (10th): 🌍 Consolidation continuation near 1.1650-1.1700 zone. Range-bound trading anticipated. Early breakout direction watch crucial. Entry setups favor reversal plays at support zones.
Tuesday-Wednesday (11-12th): 📈 Prime breakout window opens —1.1760 represents key decision point. Expect 100-200 pips daily volatility. Breakout confirmation targets 1.1820-1.1900 extension. This is the optimal swing trade window all week. ECB speakers watch critical.
Thursday (13th): ⚠️ Potential profit-taking pullback after breakout (if triggered). Support retest of 1.1780-1.1720. Buying opportunity if pullback holds above 1.1700.
Friday (14th): 📊 Weekly close pattern formation critical. Extension run anticipated if above 1.1800. If above 1.1850 = week target 1.1950-2.0000 achieved. End-of-week positioning for next week.
## 📍 CRITICAL CONFLUENCE ZONES - KEY TARGETS
1.1450-1.1500: Major support zone (accumulation marker, Wyckoff spring area, structural hold)
1.1550-1.1650: Secondary support (EMA 9, demand cluster, psychological level, volume POC)
1.1680-1.1710: Micro-resistance cluster (consolidation squeeze zone, early breakout resistance)
1.1750-1.1800: KEY BREAKOUT ZONE (triangle apex, harmonic confluence, all timeframe resistance)
1.1800-1.1900: Primary upside target (Elliott Wave 5, daily Band upper, measured move extension)
1.1900-1.1950: Secondary extension target (Gann level, macro resistance, wave projection)
1.1950-2.0000: Weekly/monthly target (if wave 5 impulse extends beyond base projections)
## 🏆 RISK MANAGEMENT RULEBOOK
✅ 1) Position Sizing: Never risk >2% of account equity per single trade
✅ 2) Risk-Reward Ratio: Minimum 1:2.5 R/R on every entry—1:3+ preferred for swing trades
✅ 3) Profit Scaling: Close 25-50% at 1:1 ratio, let remainder run to 1:2+ targets
✅ 4) Stop Loss Discipline: Place stop IMMEDIATELY on entry—no exceptions (20 pips tight)
✅ 5) Breakout Confirmation: Avoid FOMO—wait for candle close confirmation + volume surge always
✅ 6) Daily Support Respect: Psychological holds (round numbers 1.1600 | 1.1800) matter—trade confluence not against
✅ 7) Time Management: Exit losing trades quickly (max 1:0.5 acceptable for educational losses)
✅ 8) Macro Alignment: Always check daily/4H bias before taking 1H or lower trades
## #EURUSD #EUROUSD #FOREXTRADING #EURUSDANALYSIS
#TECHNICALANALYSIS #ELLIOTTWAVE #HARMONICPATTERN #BREAKOUTTRADING
#SWINGTRADER #DAYTRADING #INTRADAY #FOREXANALYSIS #TRADINGVIEW
#BOLLINGER BANDS #RSI #ICHIMOKU #VWAP #TRADINGSTRATEGY
#WYCKOFFMETHOD #GANNTHEORY #DOWTHEORY #TECHNICALS #ANALYSIS
#SUPPORTANDRESISTANCE #VOLUMEANALYSIS #OVERBOUGHT #OVERSOLD #REVERSAL
#FOREXTRADERS #CURRENCYTRADING #BREAKOUTSETUP #TRADERSOFTWITTER
#TECHNICALTRADER #CANDLESTICK #PATTERRECOGNITION #CHARTANALYSIS #DAYTRADER
## 🎁 BONUS: DAILY PRE-MARKET CHECKLIST
Use this every morning before market open:
☑️ Check daily RSI (should be 60-72 for bullish bias continuation)
☑️ Identify support/resistance zones (1.1600 | 1.1700 | 1.1760 | 1.1900)
☑️ Verify 4H chart alignment (pennant/IH&S pattern status update)
☑️ Check Ichimoku cloud position (above/below = trend confirmation signal)
☑️ Review 1H Elliott Wave count (which wave are we trading exactly?)
☑️ Scan volume profile (POC = likely rejection zone area)
☑️ Set entry orders + stop losses BEFORE Asian session closes
☑️ Plan 3 Take Profit levels before entering any position
☑️ Monitor ECB/Fed speakers + economic calendar (interest rate expectations)
## 🌐 FOREX SESSION NOTES
EUR/USD trades 24/5 across all sessions . Highest volatility typically occurs:
Asian Session (22:00-8:00 UTC): Lower volatility—good for breakout setups forming
London Session (8:00-16:30 UTC): Prime trading hours —peak liquidity + volatility combination
NY Session (14:30-21:00 UTC): Secondary volatility surge—often confirms London direction
ECB/Fed Policy Impact: Monitor policy divergence—higher Fed rates support USD weakness = EUR strength
💡 Disclaimer: This technical analysis is educational only. Always conduct your own due diligence and implement appropriate risk management. Past performance does not guarantee future results. Trade responsibly within your risk tolerance. Use stop losses on every position. Not financial advice.
Analysis Created: November 8, 2025 | Valid Through: November 14, 2025 | Updated Daily

AUD/USD - Forecast (To fall further)🇦🇺🇺🇸 AUD/USD – 8H Breakdown
AUD/USD just wrapped up that juicy Wave 3 run and topped near 0.6780. Now we’re cooling off with a corrective pullback — perfect spot to hunt buys 👀
🎯 Buy Zones
Buy Zone 1: 0.6520 – 0.6530 → first bounce area ⚡
Buy Zone 2 (Preferred): 0.6460 – 0.6480 → 71% retrace + wedge support 🏹
📈 Playbook
Let price dip into demand (ideally Buy Zone 2).
Load up → ride it back toward 0.6700.
If bulls flex, we sweep those 0.6780 highs for liquidity. 🚀
🔍 Outlook
Short-term: Expect deeper retrace into demand.
Mid-term: Bulls looking for another leg higher.
Bias : Pullback → Buy continuation 🔥

Will the US Dollar Run?Here we have a classic invert head and shoulders in validated if we take out the previous higher lows, but with how things are going, I don't see that happening, especially with Trump being in office you can argue all you want, but the charts don't lie

DXY Dollar Index: Technical Analysis & Trading Strategy Forecast# DXY Dollar Index: Comprehensive Technical Analysis & Trading Strategy Forecast
Asset Class: US Dollar Index (DXY)
Current Price: 97.855 (as of August 30, 2025, 12:59 AM UTC+4)
Analysis Date: August 31, 2025
Market Context: Post-correction consolidation phase with emerging bullish momentum
Executive Summary
The Dollar Index (DXY) is currently trading at 97.855, showing signs of stabilization after a significant decline from yearly highs. Our multi-dimensional technical analysis reveals a critical juncture where multiple timeframes converge, presenting both intraday scalping opportunities and swing trading setups. The analysis incorporates advanced pattern recognition, wave theory, and momentum indicators to provide actionable trading insights.
Current Market Landscape
The DXY exchange rate rose to 97.8549 on August 29, 2025, up 0.04% from the previous session, indicating short-term stabilization. However, over the past month, the United States Dollar has weakened 1.96%, and is down by 3.81% over the last 12 months. This presents a complex technical picture where short-term bullish momentum may be developing within a broader corrective phase.
The DXY Dollar Index Futures kicked off the new week with a strong bullish candle, signaling renewed upward momentum, supported by non-commercial traders reducing their bearish bets according to recent COT data.
Multi-Timeframe Technical Analysis
Elliott Wave Theory Analysis
Based on recent Elliott Wave patterns, the descent from the May 29, 2025 high is currently unfolding as a five-wave impulse Elliott Wave pattern. From this high, wave ((i)) concluded at 98.35, followed by a corrective rally in wave ((ii)). The rally formed as an expanded flat, peaking at 99.43.
Wave Count Structure:
Primary Wave: Currently in corrective Wave 4 of larger degree cycle
Intermediate Count: Completing 5-wave decline from 2025 highs
Near-term: Potential Wave 5 completion around 96.50-97.00 zone
Elliott Wave Targets:
Immediate Support: 96.80-97.00 (Wave equality zone)
Key Resistance: 99.40-99.80 (Previous Wave ((ii)) high)
Major Resistance: 101.50-102.00 (Fibonacci confluence)
Harmonic Pattern Analysis
Active Patterns:
1. Potential Bullish Bat Pattern forming on 4H-Daily timeframe
- X to A leg: 103.50 to 96.20
- A to B retracement: 38.2% at 98.98
- B to C projection: 88.6% of AB at 97.15
- Completion zone: 96.50-96.80 (88.6% XA retracement)
2. Bearish Gartley Pattern (Completed)
- Generated sell signals at 99.20-99.50 range
- Currently in profit-taking phase
Fibonacci Confluence Zones:
Strong Support: 96.50-96.80 (Multiple harmonic convergence)
Resistance Cluster: 98.80-99.20 (38.2% and 50% retracements)
Major Resistance: 101.20-101.80 (61.8% golden ratio)
Wyckoff Theory Assessment
Current Phase: Potential Accumulation Phase (Spring Test)
Distribution Phase: Completed at 2025 highs (103.50+ region)
Markdown Phase: May-August 2025 decline
Current Position: Testing Spring levels around 96.50-97.50
Wyckoff Signals:
- Volume divergence suggests smart money accumulation
- Price action showing reduced selling pressure
- Potential for markup phase if 98.50 resistance breaks
W.D. Gann Analysis
Gann Square of 9:
- Natural resistance at 98 (perfect square)
- Strong support at 96 (key Gann level)
- Next major target: 100 (psychological and Gann confluence)
Gann Time Theory:
- Current time cycle suggests reversal window: September 3-10, 2025
- Major time square due: October 2025 (90-degree angle)
- Price-Time balance suggests equilibrium around 97.50
Gann Angles:
- 1x1 angle from August lows: 97.20 (active support)
- 2x1 resistance line: 98.60
- 1x2 support angle: 96.40
Ichimoku Kinko Hyo Analysis
Current Cloud Status:
- Price below Tenkan-sen (97.95) - Short-term bearish
- Kijun-sen at 98.40 acting as dynamic resistance
- Cloud (Kumo) resistance: 99.20-99.80
- Future Cloud: Thinning, suggesting volatility ahead
Ichimoku Signals:
- TK Cross: Pending bullish crossover if price holds above 97.50
- Cloud breakout target: 99.80+
- Support levels: Kijun-sen (98.40), Tenkan-sen (97.95)
Technical Indicators Analysis
Relative Strength Index (RSI)
Daily RSI: 42.5 (Oversold but not extreme)
4H RSI: 38.2 (Approaching oversold territory)
1H RSI: 45.8 (Neutral zone)
Divergence Alert: Bullish divergence forming on 4H timeframe
Bollinger Bands (BB)
Current Position: Lower third of bands
Band Width: Contracting (low volatility environment)
Squeeze Setup: Potential breakout within 3-5 trading days
Direction Bias: Slight bullish based on band position
Volume Weighted Average Price (VWAP)
Daily VWAP: 98.12 (resistance)
Weekly VWAP: 98.85 (major resistance)
Monthly VWAP: 99.45 (significant overhead supply)
Moving Averages Confluence
SMA 20: 98.15 (immediate resistance)
EMA 50: 98.75 (intermediate resistance)
SMA 200: 100.20 (major trend line)
Current Status: Below all major MAs (bearish bias)
Candlestick Pattern Recognition
Recent Formations:
1. Doji Star (August 29) - Indecision at support
2. Hammer Pattern (August 30) - Potential reversal signal
3. Bullish Engulfing setup developing
Pattern Implications:
- Short-term reversal signals strengthening
- Volume confirmation needed for validation
- Risk-reward favors long positions with tight stops
Market Structure & Support/Resistance
Key Support Levels:
1. 97.20-97.40 - Immediate support (Gann 1x1 angle)
2. 96.80-97.00 - Major support (Harmonic completion)
3. 96.20-96.50 - Critical support (Previous reaction low)
4. 95.50-95.80 - Ultimate support (2024 major low)
Key Resistance Levels:
1. 98.15-98.40 - Immediate resistance (SMA 20 + Kijun-sen)
2. 98.80-99.20 - Intermediate resistance (Fibonacci + VWAP)
3. 99.40-99.80 - Major resistance (Elliott Wave + Cloud)
4. 101.20-101.80 - Long-term resistance (Multiple confluences)
Trading Strategy & Time Frame Analysis
Intraday Trading Strategy (5M - 4H Charts)
Bullish Scenario (Probability: 60%)
Entry Zone: 97.40-97.60 (on pullback)
Stop Loss: 97.15 (below harmonic completion)
Target 1: 98.15 (Daily SMA 20)
Target 2: 98.60 (Gann 2x1 angle)
Target 3: 99.20 (Fibonacci resistance)
Risk-Reward: 1:2.5
Bearish Scenario (Probability: 40%)
Entry Zone: 98.40-98.60 (on failed breakout)
Stop Loss: 99.00 (above key resistance)
Target 1: 97.60 (immediate support)
Target 2: 96.80 (Harmonic target)
Target 3: 96.20 (Major support)
Risk-Reward: 1:2.8
Swing Trading Strategy (4H - Monthly Charts)
Primary Long Setup:
Accumulation Zone: 96.50-97.50
Confirmation: Break above 98.80 with volume
Swing Target 1: 100.20 (SMA 200)
Swing Target 2: 102.50 (61.8% retracement)
Ultimate Target: 105.00 (2025 high retest)
Stop Loss: Below 96.20
Position Sizing: 2% risk per trade
Time Horizon: 4-8 weeks
Alternative Short Setup:
Entry Condition: Failure at 99.50 resistance
Confirmation: Break below 97.00 support
Target 1: 95.50 (2024 low)
Target 2: 93.80 (Extended projection)
Stop Loss: Above 100.00
Time Horizon: 6-10 weeks
Weekly Trading Plan (September 2-6, 2025)
Monday-Tuesday: Consolidation Expected
Range: 97.20-98.40
Strategy: Range trading, fade extremes
Key Events: Watch for volume expansion
Wednesday-Thursday: Potential Breakout
Catalyst: Economic data releases
Scenarios: Break above 98.60 (bullish) or below 97.00 (bearish)
Strategy: Breakout trading with confirmation
Friday: Trend Continuation
Focus: Weekly close positioning
Strategy: Hold winners, cut losers
Risk Management: Reduce position sizes before weekend
Risk Management Framework
Position Sizing Rules:
Intraday: Maximum 1% risk per trade
Swing: Maximum 2% risk per trade
Portfolio: Total DXY exposure not exceeding 5%
Stop Loss Guidelines:
Intraday: 25-30 pips maximum
Swing: 80-120 pips based on volatility
Time-based: Exit if no progress in 5 trading days
Profit Taking Strategy:
Scale out: 50% at first target, 30% at second, 20% runner
Trailing stops: Implement after 1:1 risk-reward achieved
Weekend rule: Close 70% of intraday positions before Friday close
Market Psychology & Sentiment
Current Sentiment Indicators:
COT Data: Non-commercial traders reducing bearish bets
Options Flow: Put-call ratio normalizing from extreme levels
Technical Sentiment: Oversold conditions with emerging reversal signals
Psychological Levels:
98.00: Round number resistance (psychological barrier)
100.00: Major psychological milestone
95.00: Critical psychological support
External Factors & Market Context
Geopolitical Considerations:
- Federal Reserve policy stance monitoring required
- Global economic data impacts (ECB, BOJ decisions)
- Geopolitical tensions affecting safe-haven demand
Economic Calendar Watch:
- NFP data (First Friday of month)
- Fed speakers and policy minutes
- Inflation data releases
- Global PMI readings
Advanced Pattern Alerts
Bull Trap Warning:
Setup: False break above 99.00 followed by immediate reversal
Confirmation: Heavy volume on break, light volume on decline
Response: Wait for 4H close below 98.20 before shorting
Bear Trap Alert:
Setup: False break below 96.80 with quick recovery
Confirmation: Immediate buying pressure and volume surge
Response: Long entry on return above 97.20 with tight stops
Technology Integration
Automated Alerts Setup:
1. Price Alerts: 96.80, 97.50, 98.60, 99.20
2. RSI Alerts: <30 (oversold), >70 (overbought)
3. Volume Alerts: 150% above 20-day average
4. Pattern Alerts: Harmonic completion, Elliott Wave targets
Trading Platform Integration:
TradingView: Custom indicator stack with all mentioned tools
MT4/MT5: Expert Advisor for automated entries
Risk Management: Position sizing calculators
Conclusion & Forecast Summary
The DXY Dollar Index stands at a critical technical juncture with multiple analytical frameworks suggesting a potential reversal from current levels. The convergence of Elliott Wave completion zones, harmonic pattern targets, and Wyckoff accumulation signals creates a compelling risk-reward setup for both intraday and swing traders.
Primary Scenario (65% probability): Consolidation between 96.80-98.60 followed by breakout to 100.20+ levels over the next 4-6 weeks.
Alternative Scenario (35% probability): Failed recovery leading to extended decline toward 95.50-94.00 zone.
Trading Bias: Cautiously bullish with defensive positioning until confirmation above 98.80 resistance cluster.
Key Success Factors:
- Strict adherence to risk management protocols
- Multiple timeframe confirmation before major position increases
- Continuous monitoring of Federal Reserve policy developments
- Adaptation to changing market structure and volatility conditions
---
*This analysis incorporates advanced technical methodologies including Elliott Wave Theory, Harmonic Patterns, Wyckoff Analysis, Gann Theory, and Ichimoku Kinko Hyo, combined with traditional indicators and market structure analysis. All price targets and support/resistance levels are derived from mathematical relationships and historical price behavior patterns.*
Risk Disclaimer: Past performance is not indicative of future results. All trading involves substantial risk of loss. This analysis is for educational purposes and should not be considered as financial advice. Traders should conduct their own analysis and consider their risk tolerance before making trading decisions.

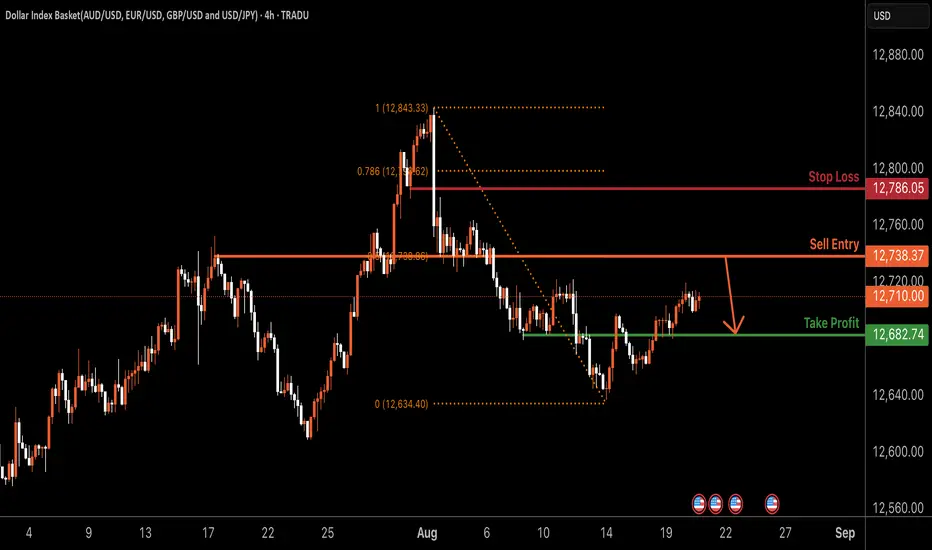
USDOLLAR H4 | Bearish reversal off 50% Fibonacci resistanceBased on the H4 chart analysis, we could see the price rise to the sell entry, which is an overlap resistance that aligns with the 50% Fibonacci retracement and could reverse from this level to the take profit.
Sell entry is at 12,738.37, which is an overlap resistance that lines up with the 50% Fibonacci retracement.
Stop loss is at 12,786.05, which is a pullback resistance that is slightly below the 78.6% Fibonacci retracement.
Take profit is at 12,682.74, which is a pullback support.
High Risk Investment Warning
Trading Forex/CFDs on margin carries a high level of risk and may not be suitable for all investors. Leverage can work against you.
Stratos Markets Limited (tradu.com ):
CFDs are complex instruments and come with a high risk of losing money rapidly due to leverage. 65% of retail investor accounts lose money when trading CFDs with this provider. You should consider whether you understand how CFDs work and whether you can afford to take the high risk of losing your money.
Stratos Europe Ltd (tradu.com ):
CFDs are complex instruments and come with a high risk of losing money rapidly due to leverage. 66% of retail investor accounts lose money when trading CFDs with this provider. You should consider whether you understand how CFDs work and whether you can afford to take the high risk of losing your money.
Stratos Global LLC (tradu.com ):
Losses can exceed deposits.
Please be advised that the information presented on TradingView is provided to Tradu (‘Company’, ‘we’) by a third-party provider (‘TFA Global Pte Ltd’). Please be reminded that you are solely responsible for the trading decisions on your account. There is a very high degree of risk involved in trading. Any information and/or content is intended entirely for research, educational and informational purposes only and does not constitute investment or consultation advice or investment strategy. The information is not tailored to the investment needs of any specific person and therefore does not involve a consideration of any of the investment objectives, financial situation or needs of any viewer that may receive it. Kindly also note that past performance is not a reliable indicator of future results. Actual results may differ materially from those anticipated in forward-looking or past performance statements. We assume no liability as to the accuracy or completeness of any of the information and/or content provided herein and the Company cannot be held responsible for any omission, mistake nor for any loss or damage including without limitation to any loss of profit which may arise from reliance on any information supplied by TFA Global Pte Ltd.
The speaker(s) is neither an employee, agent nor representative of Tradu and is therefore acting independently. The opinions given are their own, constitute general market commentary, and do not constitute the opinion or advice of Tradu or any form of personal or investment advice. Tradu neither endorses nor guarantees offerings of third-party speakers, nor is Tradu responsible for the content, veracity or opinions of third-party speakers, presenters or participants.
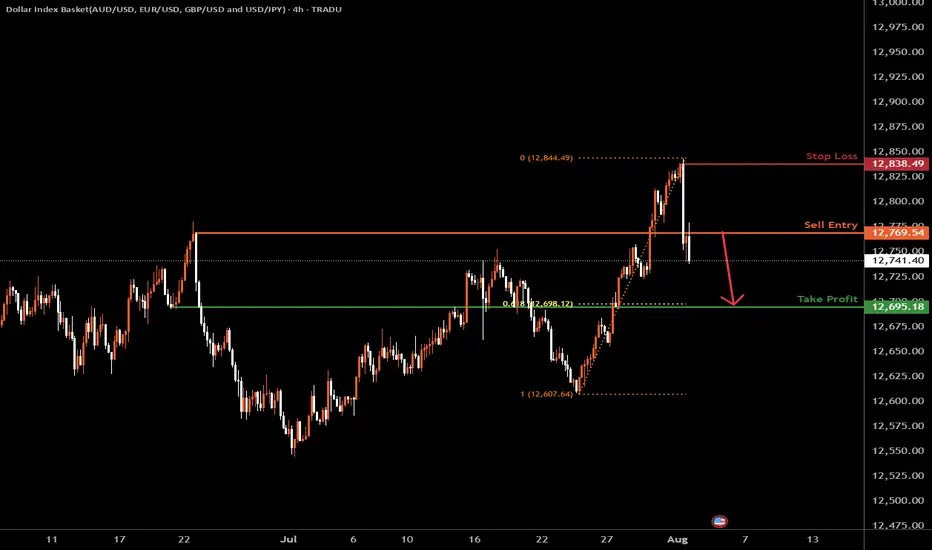
USDOLLAR H4 | Bearish dropBased on the H4 chart analysis, we could see the price drop lower from the sell entry, which is a pullback resistance and could drop to the downside.
Sell entry is at 12,769.54, which is a pullback resistance.
Stop loss is at 12,834.49, which is at 12,695.18, which is a pullback resistance.
Take profit is at 12,695.18, which is a pullback support that aligns with the 61.8% Fibonacci retracement.
High Risk Investment Warning
Trading Forex/CFDs on margin carries a high level of risk and may not be suitable for all investors. Leverage can work against you.
Stratos Markets Limited (tradu.com ):
CFDs are complex instruments and come with a high risk of losing money rapidly due to leverage. 65% of retail investor accounts lose money when trading CFDs with this provider. You should consider whether you understand how CFDs work and whether you can afford to take the high risk of losing your money.
Stratos Europe Ltd (tradu.com ):
CFDs are complex instruments and come with a high risk of losing money rapidly due to leverage. 66% of retail investor accounts lose money when trading CFDs with this provider. You should consider whether you understand how CFDs work and whether you can afford to take the high risk of losing your money.
Stratos Global LLC (tradu.com ):
Losses can exceed deposits.
Please be advised that the information presented on TradingView is provided to Tradu (‘Company’, ‘we’) by a third-party provider (‘TFA Global Pte Ltd’). Please be reminded that you are solely responsible for the trading decisions on your account. There is a very high degree of risk involved in trading. Any information and/or content is intended entirely for research, educational and informational purposes only and does not constitute investment or consultation advice or investment strategy. The information is not tailored to the investment needs of any specific person and therefore does not involve a consideration of any of the investment objectives, financial situation or needs of any viewer that may receive it. Kindly also note that past performance is not a reliable indicator of future results. Actual results may differ materially from those anticipated in forward-looking or past performance statements. We assume no liability as to the accuracy or completeness of any of the information and/or content provided herein and the Company cannot be held responsible for any omission, mistake nor for any loss or damage including without limitation to any loss of profit which may arise from reliance on any information supplied by TFA Global Pte Ltd.
The speaker(s) is neither an employee, agent nor representative of Tradu and is therefore acting independently. The opinions given are their own, constitute general market commentary, and do not constitute the opinion or advice of Tradu or any form of personal or investment advice. Tradu neither endorses nor guarantees offerings of third-party speakers, nor is Tradu responsible for the content, veracity or opinions of third-party speakers, presenters or participants.
Global Calm, Fiscal Storm: The Yen's Challenge?The USD/JPY currency pair has recently experienced a notable surge, driving the Japanese Yen to its weakest level against the US Dollar in a month. This appreciation primarily stems from a significant improvement in global risk sentiment, sparked by a breakthrough trade agreement between the United States and China. This deal, aimed at reducing the US trade deficit, has bolstered investor confidence and diminished the traditional safe-haven appeal of the Yen. Adding to the dollar's strength is the Federal Reserve's continued hawkish stance, signaling no immediate plans for interest rate cuts and reinforcing the attractiveness of dollar-denominated assets amidst easing concerns about a US recession.
Simultaneously, internal economic pressures in Japan significantly weigh on the Yen. The nation's public debt has reached an unprecedented high, driven by persistent increases in defense spending and social welfare costs due to an aging population. Government subsidies for energy bills and the need to issue more bonds to cover rising expenditures exacerbate this fiscal strain. This challenging domestic backdrop contrasts sharply with the Federal Reserve's position, creating a widening divergence in monetary policy outlooks that favors the US Dollar through yield differentials, despite the Bank of Japan's cautious consideration of future rate adjustments.
Furthermore, reducing global geopolitical tensions has contributed to the shift away from safe-haven currencies. Recent ceasefires and prospects for diplomatic talks in key conflict areas have encouraged a "risk-on" environment in financial markets. This increased appetite for riskier assets directly reduces demand for the Japanese Yen, amplifying the impact of fundamental economic factors and monetary policy divergence on the USD/JPY exchange rate. The pair's trajectory remains subject to evolving global dynamics, upcoming economic data releases, and central bank communications.

Omnichart presents - NIFTY/(USDINR) long term trend Nifty's performance when compared to US dollar (vs its base currency i.e. Indian Rupee) broke above a long term since 2007 resistance through Dec 2020. As you can see it broke above the blue line in Dec 2020 and has been outperforming the dollar - to -rupee. What this means is that investing US dollars to buy Nifty started becoming more profitable in Dec 2020 vs just keeping the wealth in US Dollars (not converting to INR). This is in a long term uptrend - what this means is that investing US dollars in NIFTY long term is a profitable strategy.

SHORT! US Dollar.....For nowUSD is in a clear wave 2 down for many reasons.
- Tariffs speculation
- Inflation data higher than expected
- US M2 money supply increase
- US manufacturing output drops and Retail sales drop
Moreover, the dollar for now is bearish until reversals in the aforementioned list of causes for its recent decline. Primarily, look for the FED to hold off on any future rate cuts until later in the year. Treasury Yields(Bond Sell off) rising recently is an indication that the market does not expect any FED rate cuts happening anytime soon. This could spur demand for the US Dollar as other Central Banks globally look to continue to cut rates (i.e. ECB and BOE).

Can Turkey's Lira Dance with the Dollar?Turkey stands at a pivotal moment in its economic journey, navigating through the complexities of fiscal management and monetary policy to stabilize the Turkish Lira against the US Dollar. The nation has embarked on a strategic pivot towards domestic funding, significantly increasing the issuance of Turkish Government Bonds to manage soaring inflation and debt service costs. This approach, while stabilizing in relative terms, challenges Turkey to balance between stimulating growth and controlling inflation, a dance that requires both precision and foresight.
The Central Bank of Turkey's decision to cut rates amidst rising inflation paints a picture of calculated risk and strategic optimism. The bank is threading a needle between fostering economic activity and maintaining price stability by targeting a reduction in inflation over the medium term while allowing short-term increases. This policy shift, coupled with a focus on local funding, not only aims to reduce external vulnerabilities but also tests the resilience of Turkey's economy against global economic currents, including the impact of international political changes like the US election.
Globally, the economic landscape is fraught with uncertainties, and Turkey's strategy of maintaining a stable credit rating while forecasting a decrease in inflation sets an intriguing stage. The country's ability to attract investment while managing its debt profile, especially in light of global monetary policy shifts by major players like the Federal Reserve and the ECB, will be a testament to its economic stewardship. This narrative invites readers to delve deeper into how Turkey might leverage its economic policies to not only survive but thrive in a fluctuating global market.
The enigma of the USD/TRY exchange rate thus becomes a compelling study of economic strategy, where every policy decision is a move in a larger game of financial chess. Turkey's attempt to balance its books while dancing with the dollar challenges conventional economic wisdom and invites observers to ponder: Can a nation truly master its currency's fate in the global marketplace?

Can the Yuan Dance to a New Tune?In the intricate ballet of global finance, the Chinese yuan performs a delicate maneuver. As Donald Trump's presidency introduces new variables with potential tariff hikes, the yuan faces depreciation pressures against a strengthening U.S. dollar. This dynamic challenges Beijing's economic strategists, who must balance the benefits of a weaker currency for exports against the risks of domestic economic instability and inflation.
The People's Bank of China (PBOC) is navigating this complex scenario with a focus on maintaining currency stability rather than aggressively stimulating growth through monetary policy easing. This cautious approach reflects a broader strategy to manage expectations and market reactions in an era where geopolitical shifts could dictate economic outcomes. The PBOC's recent moves, like suspending bond purchases and issuing warnings against speculative trades, illustrate a proactive stance in controlling the yuan's descent, aiming for an orderly adjustment rather than a chaotic fall.
This situation provokes thought on the resilience and adaptability of China's economic framework. How will Beijing reconcile its growth ambitions with the currency's stability, especially under the looming shadow of U.S. trade policies? The interplay between these two economic giants will shape their bilateral relations and influence global trade patterns, investment flows, and perhaps even the future of monetary policy worldwide. As we watch this economic dance unfold, one must ponder the implications for international markets and the strategic responses from other global players.

USDOLLAR /JPY Long Dollar Ralley is strongThe US dollar has strengthened further since Friday’s strong jobs report showed far better payrolls growth than expected
The US dollar is broadly firmer, though the Japanese yen is proving a resilient ahead of the BOJ deputy governor's speech

EURUSD 5/1/25Heading into the First Trading Week of the Year
We’re ready to dominate as always, with Orion leading the way and providing a clear bias. This week, we continue with our bearish outlook, looking to trade from the highs into the lows outlined here, with the target clearly defined.
Before diving in headfirst, let’s cover a few key points:
There’s currently a large gap between the highs and the current price.
Based on this, we need to be mindful of the following scenarios:
A short-term high could form before reaching the main highs shown here.
A new low might be created, giving us an additional target low.
These scenarios suggest we could see some form of manipulation before a move higher. For example, the price could create new highs, sweep them, and then form a new short-term low.
While this wouldn’t invalidate the larger bearish move, it could shake out many lower time frame traders.
Please also take note of the heavy liquid we have stored above the current highs we are looking at.
Trade safe and stick to your plan.

Will the Dollar Index Redefine Global Economic Equilibrium?In the intricate dance of international trade and geopolitical strategy, the Dollar Index emerges as a critical compass navigating the turbulent waters of economic uncertainty. The article illuminates how this financial barometer reflects the profound implications of proposed tariffs by the U.S. administration, revealing a complex interplay of currencies, trade relationships, and global market sentiments that extend far beyond mere numerical fluctuations.
The proposed tariffs targeting key trading partners like Canada, Mexico, and China represent more than economic policy—they are strategic maneuvers with potential seismic shifts in global trade dynamics. As the Dollar Index climbs, reflecting the U.S. dollar's strength, it simultaneously exposes the delicate balance of international economic relationships. The potential consequences ripple through supply chains, consumer markets, and diplomatic corridors, challenging the post-World War II trade paradigm and forcing nations to recalibrate their economic strategies in real time.
Beyond the immediate market reactions, these developments signal a broader philosophical question about economic sovereignty and interdependence. The tariff proposals challenge long-established multilateral agreements, potentially accelerating a transformation in how nations perceive economic collaboration. While the immediate impact is visible in currency fluctuations and market volatility, the long-term implications could reshape global economic architecture, prompting a reevaluation of the U.S. dollar's role as the predominant global reserve currency and testing the resilience of international trade networks.

Potential bullish bounce?US Dollar Index (DXY) is falling towards the pivot which has been identified as a pullback support and could bounce to the 1st resistance which acts as a pullback resistance.
Pivot: 103.82
1st Support: 103.44
1st Resistance: 104.57
Risk Warning:
Trading Forex and CFDs carries a high level of risk to your capital and you should only trade with money you can afford to lose. Trading Forex and CFDs may not be suitable for all investors, so please ensure that you fully understand the risks involved and seek independent advice if necessary.
Disclaimer:
The above opinions given constitute general market commentary, and do not constitute the opinion or advice of IC Markets or any form of personal or investment advice.
Any opinions, news, research, analyses, prices, other information, or links to third-party sites contained on this website are provided on an "as-is" basis, are intended only to be informative, is not an advice nor a recommendation, nor research, or a record of our trading prices, or an offer of, or solicitation for a transaction in any financial instrument and thus should not be treated as such. The information provided does not involve any specific investment objectives, financial situation and needs of any specific person who may receive it. Please be aware, that past performance is not a reliable indicator of future performance and/or results. Past Performance or Forward-looking scenarios based upon the reasonable beliefs of the third-party provider are not a guarantee of future performance. Actual results may differ materially from those anticipated in forward-looking or past performance statements. IC Markets makes no representation or warranty and assumes no liability as to the accuracy or completeness of the information provided, nor any loss arising from any investment based on a recommendation, forecast or any information supplied by any third-party.

THE US DOLLAR is still King?The US Dollar Index has found support near all that former resistance from the past decade. The polarity here in the US Dollar is very real.

USD/JPY Forecast: Bullish Bias Expected – Key Factors to Watch.USD/JPY Forecast: Bullish Bias Expected – Key Factors to Watch (20/09/2024)
As we analyze the USD/JPY pair on 20/09/2024, the outlook appears to be slightly bullish for this week and next. Several key drivers are pushing the U.S. dollar higher against the Japanese yen, creating an attractive opportunity for traders. In this article, we’ll break down the fundamental factors behind this forecast and highlight the elements influencing USD/JPY price action in the coming days.
1. US Dollar Strength Bolsters USD/JPY
The strength of the U.S. dollar is a critical factor contributing to the bullish bias in USD/JPY. With the Federal Reserve signaling a commitment to maintaining high interest rates for an extended period, the greenback remains in demand. Fed officials have recently emphasized their concerns about persistent inflation, leading markets to believe that U.S. interest rates will stay elevated for longer than previously expected.
This hawkish monetary stance, coupled with strong economic data, has made the U.S. dollar more attractive to investors. As a result, USD/JPY has been moving higher, with the strong dollar likely to continue exerting upward pressure on the pair.
Key SEO keywords: USD/JPY forecast, US dollar strength, Federal Reserve policy, interest rate hike, USD/JPY price action.
2. Dovish Bank of Japan Keeps the Yen Weak
On the other side of the equation, the Japanese yen remains under pressure due to the Bank of Japan’s (BoJ) ultra-loose monetary policy. The BoJ has shown no signs of tightening monetary policy in the near term, despite global inflationary trends. Japan’s central bank continues to prioritize economic support, maintaining low interest rates while avoiding any drastic policy shifts.
This dovish stance contrasts sharply with the Federal Reserve’s hawkish policy, widening the interest rate differential between the U.S. and Japan. This is a major driver of USD/JPY’s bullish outlook, as investors gravitate towards the higher-yielding U.S. dollar over the lower-yielding yen.
Key SEO keywords: Bank of Japan policy, Japanese yen weakness, dovish BoJ, USD/JPY interest rate differential, yen depreciation.
3. Interest Rate Differentials Favor USD/JPY Upside
One of the most important factors pushing USD/JPY higher is the widening interest rate differential between the U.S. and Japan. While U.S. Treasury yields remain attractive, the yield on Japanese government bonds remains low due to the BoJ’s dovish policy stance. This gap in yields makes the U.S. dollar more appealing for investors seeking better returns.
The widening interest rate gap is a key bullish signal for USD/JPY, as capital continues to flow into U.S. dollar-denominated assets. As long as the Federal Reserve maintains its hawkish tone, and the BoJ remains accommodative, this dynamic will likely support the bullish bias for USD/JPY.
Key SEO keywords: Interest rate differentials, U.S. Treasury yields, Japanese bond yields, USD/JPY bullish outlook, capital flows into USD.
4. Japanese Economic Weakness Adding Pressure on the Yen
Another factor supporting the bullish bias for USD/JPY is the ongoing weakness in the Japanese economy. Japan has struggled with slow economic growth and weak inflation, further justifying the BoJ’s cautious approach to monetary policy. Domestic consumption remains low, and Japan’s economic recovery has been uneven.
As a result, the Japanese yen continues to face downside pressure, while the U.S. dollar benefits from stronger economic fundamentals. This divergence between the U.S. and Japanese economies adds to the case for a stronger USD/JPY in the coming weeks.
Key SEO keywords: Japanese economic weakness, low inflation in Japan, weak yen, Bank of Japan policy, USD/JPY forecast.
5. USD/JPY Technical Analysis Suggests Further Upside Potential
From a technical standpoint, USD/JPY is showing signs of further upside. The pair has been testing key resistance levels, and if these levels are broken, we could see a more significant bullish move. The recent price action has shown strength, with USD/JPY consistently finding support at higher lows.
Traders should watch for a potential breakout above these resistance zones, as it could signal further gains for USD/JPY. With strong fundamentals supporting the pair, the technical outlook aligns with the overall bullish bias.
Key SEO keywords: USD/JPY technical analysis, key resistance levels, USD/JPY price action, bullish trend, support and resistance.
Conclusion: Bullish Bias Expected for USD/JPY
In conclusion, several fundamental and technical factors support a slightly bullish bias for USD/JPY over the next couple of weeks. The ongoing strength of the U.S. dollar, the dovish stance of the Bank of Japan, favorable interest rate differentials, and Japan’s economic challenges all point towards further upside potential for USD/JPY.
Traders and investors should closely monitor these key drivers as they make their trading decisions. As always, staying updated on central bank policies, economic data, and technical signals will be crucial in navigating the USD/JPY price action during this period.
Key SEO keywords: USD/JPY forecast, bullish bias, USD/JPY key drivers, US dollar strength, Bank of Japan policy, interest rate differential, USD/JPY technical analysis.

DXY Bearish Continuation On Yesterday News DXY has broken our 4h Trendline and has formed a Bullish Divergence. Considering today's News we can expect a restest of our trendline and then fall to the downside.

BTCUSD Major Sell NOW!Simple trading - Heads and shoulder
BTCUSD is dropping below the 1hr heads and shoulder pattern.
2 things will play out here,
1. BTC will continue to drop to target @60k or retest the previous resistance @62k then drop to the 60k level.
2. BTC will reject the head and shoulders pattern and regain bullish strength back up to 64k
**If BTC fails to remain above 60k price may fall to to 57k (daily support)

US Dollar Four Day OutlookIt's always important to look the US Dollar when determining the outlook for Bitcoin. Remember, when the US Dollar rises, Bitcoin does the opposite, which is why the price of BTC is experience in the red.
However, looking at the US Dollar Chart, the DXY is oversold on the Relative Strength Index. This is a bullish momentum for Bitcoin, as the US Dollar can experience a pullback for the next four days.
We need to wait confirmation on the MACD on the four hour timeframe.
THIS IS NOT FINANCIAL ADVICE. ALWAYS DO YOUR OWN RESEARCH.

🇺🇸 President Joe Biden’s Bearish Remarks on the USD vs. CNY 🇨
Ladies and gentlemen, my fellow Americans, and all you Zoomers out there, gather 'round! Uncle Joe’s got some thoughts about our greenbacks and those sneaky Chinese Yuan. Buckle up, because we’re diving into the financial rabbit hole. 🐇
1. “The Dollar’s Got Swagger”
You know, folks, the U.S. dollar has been strutting its stuff for centuries. It’s like that cool kid in high school who always had the latest sneakers and a killer mixtape. Well, guess what? The dollar’s still got swagger. 💸
2. “Yuan? More Like Yawn!”
Now, let’s talk about the Chinese Yuan. Sure, it’s got pandas on its bills, but pandas don’t pay the rent, my friends. The Yuan’s like that kid who shows up to the party with a veggie platter. Nice try, but we’re here for the pizza. 🍕
3. “Quantitative Easing? Nah, We’re on a Diet!”
Our Federal Reserve’s been flexing its muscles, printing money like it’s going out of style. But guess what? We’re not on a doughnut binge. We’re on a financial diet. No more QE buffets. 🍩
4. “Trade Wars? More Like Pillow Fights!”
China and the U.S. have been duking it out in trade wars. But honestly, it’s like watching two toddlers in superhero costumes pillow-fighting. Cute, but not exactly world-changing. 🛌
5. “0.11 CNY/USD? That’s a Bargain!”
So, rumor has it the yuan’s gonna dump to 0.11 CNY/USD. Well, let me tell you, that’s practically a yard sale price. Sell one, get one free! 🛒
6. “Zoomers, HODL Your Avocado Toast!”
To my Zoomer pals: Forget avocado toast for a sec. HODL those dollars like they’re vintage Pokémon cards. Trust me, when the Yuan’s doing the cha-cha, you’ll thank me. 🥑💰
7. “Crypto? Nah, I Prefer Monopoly Money!”
And don’t get me started on crypto. It’s like playing Monopoly with invisible cash. Pass Go, collect Bitcoin. But give me that real green paper any day. 💵
In conclusion, my fellow Americans, let’s keep our eyes on the prize. The dollar’s been through wars, recessions, and disco fever. It ain’t backing down. As for the Yuan, well, pandas are cute, but they won’t save your retirement fund. Stay woke, stay dollar-wise, and remember: In Joe we trust (and a little bit of Ben Franklin). 🇺🇸💪
Disclaimer: This post is purely fictional and for entertainment purposes. No actual financial advice here, folks. Consult your financial advisor, not Uncle Joe. 🎩🤝
