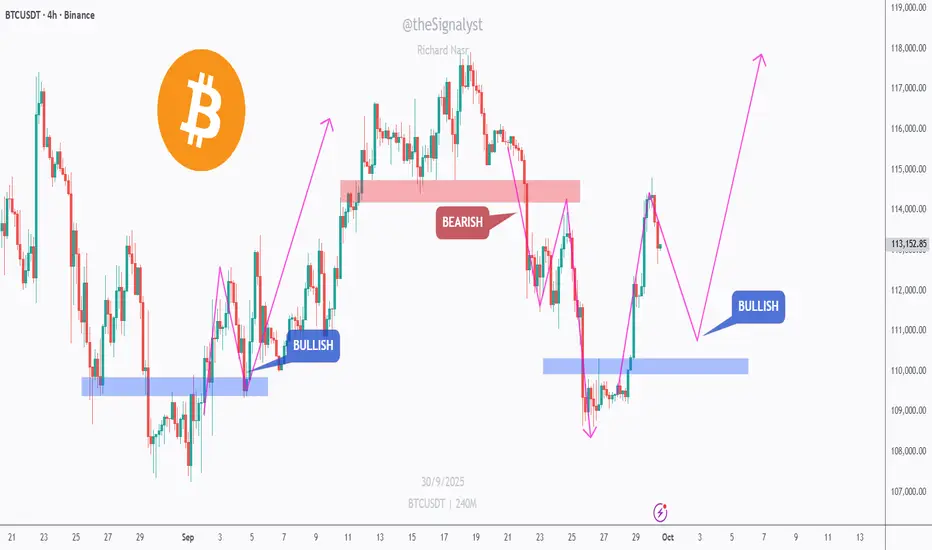
$BTC – Flip Zones Driving 4H StructureCRYPTOCAP:BTC flipped bullish after reclaiming the blue demand, then turned bearish at the red supply. We’re now pulling back from resistance, and the next clean setup likely forms on a retest of the blue zone.
🔑 Key zones
Support (blue) ~$111k area — former base of the last impulse.
Resistance (red) ~$114.5k–$115k — where sellers capped the rally.
🔎 Confluence
Prior bearish rejection at red + bullish reaction at blue.
Clear HH/HL structure only resumes if price holds blue and pushes back above red.
📊 Scenarios
Bullish 📈 Pull back into $111k (blue), print higher-low / bullish candle, then continuation toward $115k → $117k.
Bearish 📉 Lose the blue zone with a strong 4H close → open room for a deeper dip before buyers try again.
⚠️ Disclaimer: This is not financial advice. Always do your own research and manage risk properly.
📚 Stick to your trading plan regarding entries, risk, and management.
Good luck! 🍀
All Strategies Are Good; If Managed Properly!
~Richard Nasr.
US
BTC – Momentum Returns!Hello TradingView Family / Fellow Traders. This is Richard, also known as theSignalyst.
📈BTC has been overall bullish trading within the rising broadening wedge marked in red.
This week, BTC has been retesting the lower bound of the wedge.
Moreover, the orange zone is a strong structure and previous ATH.
🏹 Thus, the highlighted blue circle is a strong area to look for buy setups as it is the intersection of the lower red trendline and orange structure.
📚 As per my trading style:
As #BTC approaches the blue circle zone, I will be looking for trend-following bullish reversal setups (like a double bottom pattern, trendline break , and so on...)
📚 Always follow your trading plan regarding entry, risk management, and trade management.
Good luck!
All Strategies Are Good; If Managed Properly!
~Richard Nasr

AUD/USD - Forecast (To fall further)🇦🇺🇺🇸 AUD/USD – 8H Breakdown
AUD/USD just wrapped up that juicy Wave 3 run and topped near 0.6780. Now we’re cooling off with a corrective pullback — perfect spot to hunt buys 👀
🎯 Buy Zones
Buy Zone 1: 0.6520 – 0.6530 → first bounce area ⚡
Buy Zone 2 (Preferred): 0.6460 – 0.6480 → 71% retrace + wedge support 🏹
📈 Playbook
Let price dip into demand (ideally Buy Zone 2).
Load up → ride it back toward 0.6700.
If bulls flex, we sweep those 0.6780 highs for liquidity. 🚀
🔍 Outlook
Short-term: Expect deeper retrace into demand.
Mid-term: Bulls looking for another leg higher.
Bias : Pullback → Buy continuation 🔥

Key Levels & Trend Confirmation – US30US30 Update
We use advanced data that counts the start of the cycle and all important key levels.
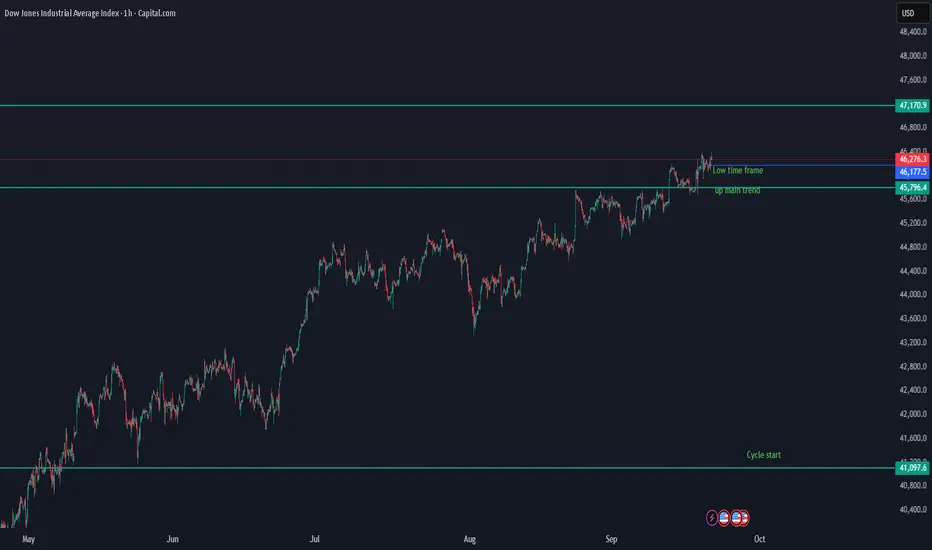
On the low time frame, US30 is holding above the breakout zone (46,177 – 46,214), showing early signs of continuation.
Key levels:
46,214 → first support on the low time frame. Holding this level keeps bullish momentum intact.
46,177 → important confirmation level for the main uptrend. If US30 closes below this, it could trigger a deeper pullback.
As long as price holds above these zones, US30 remains in a bullish structure with potential to push higher.
Downside risk: A breakdown below 46,177 would invalidate the current momentum and open space for correction toward 45,796 support.
Major cycle level: 41,097 remains the cycle start and must-hold support in the bigger picture. Losing this level would shift the cycle to red.
📌 Summary
Above 46,214 – 46,177 → bullish continuation remains in play.
Break below 46,177 → correction risk, watch 45,796 as next support.
Cycle start at 41,097 → key long-term level to keep the broader bullish cycle alive.
MORPHO Market Update📊 CRYPTOCAP:MORPHO Market Update
📉 After the recent uptrend, MORPHO could potentially retrace. If the price touches the 🟢 green zone level, it may bounce up again — giving a 🎯 good entry or re-entry opportunity with confirmation, where buyers previously accumulated.

STBL Market Update📊 AQUISUK:STBL Market Update
🚀 STBL has broken out of the 🔴 red resistance zone — what’s next? 🎯 First target = 🔵 blue line level.

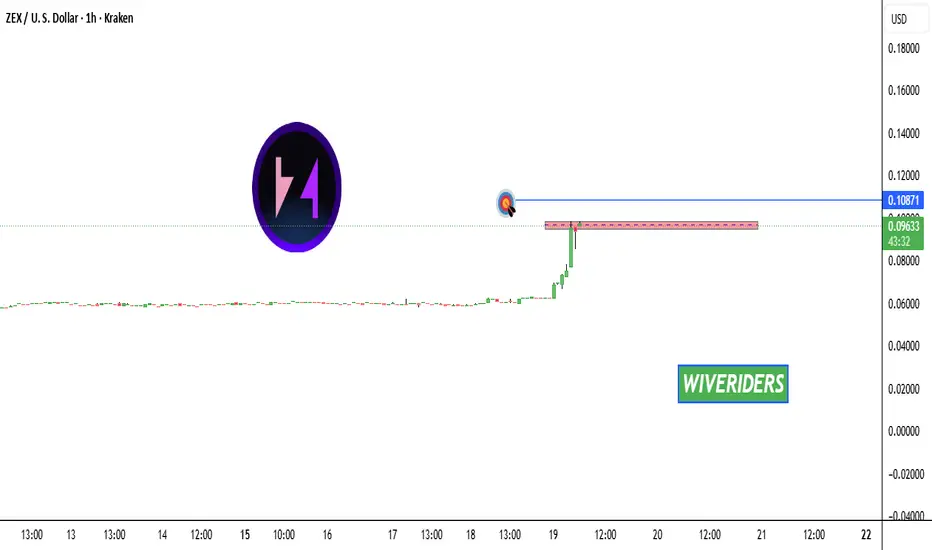
ZEX is in uptrend and now testing the red resistance zone📊 $ZEX Market Update
🚀 ZEX is in uptrend and now testing the 🔴 red resistance zone. If breakout occurs ➡️ 🎯 first target = 🔵 blue line level.
👉 Get real-time trade alerts:
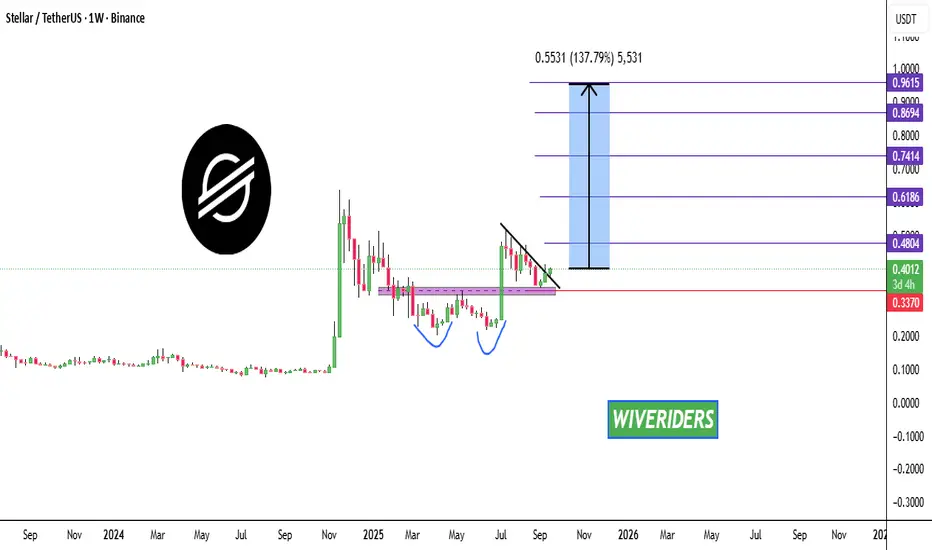
XLM Weekly Market Update – Long Setup📊 CRYPTOCAP:XLM Weekly Market Update – Long Setup
As we can see on the weekly chart, CRYPTOCAP:XLM has formed a bullish double bottom pattern ✅
👉 After the pullback, it broke out of the black resistance zone, confirming a bullish structure.
🔼 Trade Idea:
📈 Entry Price (Current): 0.4002
🎯 Targets:
Target 1 → 0.4804
Target 2 → 0.6186
Target 3 → 0.7414
Target 4 → 0.8694
Target 5 → 0.9615
🛑 Stop Loss: 0.3370
⚠️ Risk: ~15.80%
💰 Potential Reward: ~140.19%
📊 Risk/Reward Ratio: ~8.87
📌 Trade Type: Long
👉 If you’re holding CRYPTOCAP:XLM , these are the weekly targets & stop-loss to watch.
HYPE has successfully broken out of the red resistance zone 📊 GETTEX:HYPE Market Update
GETTEX:HYPE has successfully broken out of the red resistance zone 🔴✅
👉 If price keeps pushing upward, the next target is the blue line level 🎯📈
⚡ Breakout confirms bullish momentum — manage your trades and watch for continuation.

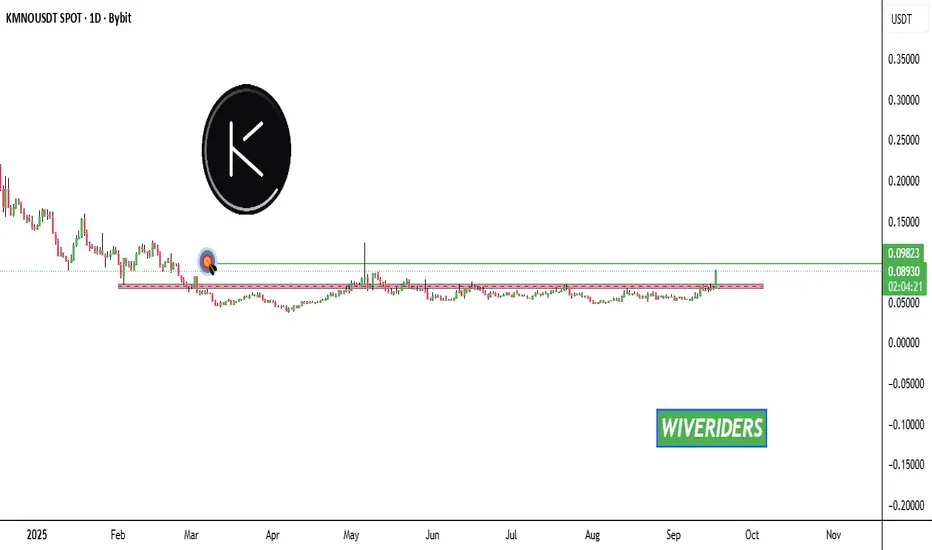
KMNO Market Update (Daily Timeframe)📊 CRYPTOCAP:KMNO Market Update (Daily Timeframe)
CRYPTOCAP:KMNO has finally broken out of the red resistance zone 🔴✅
👉 First target now set at the green line level 🎯
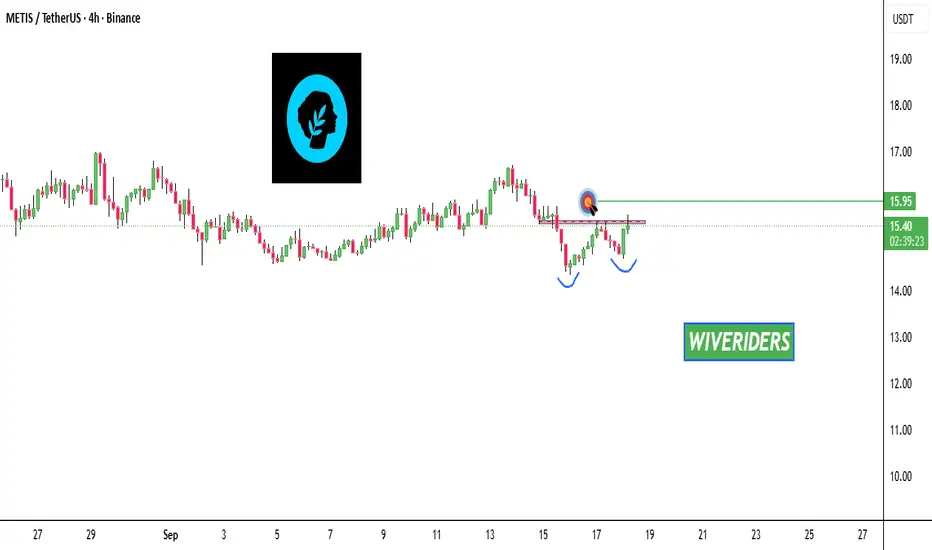
METIS has formed a bullish double bottom 📊 SEED_DONKEYDAN_MARKET_CAP:METIS Market Update
SEED_DONKEYDAN_MARKET_CAP:METIS has formed a bullish double bottom 📈
👉 If it breaks out the red resistance zone 🔴, the first target will be the green line level 🎯
$PAGS Market Update📊 NYSE:PAGS Market Update
NYSE:PAGS has gapped up and broken out of the red resistance zone 🔴✅
👉 The first target is the green line level 🎯
👉 If momentum continues, the second target will be the blue line level 📈
⚡ Manage risk and adjust stop-loss as price moves.

Will the US Dollar Run?Here we have a classic invert head and shoulders in validated if we take out the previous higher lows, but with how things are going, I don't see that happening, especially with Trump being in office you can argue all you want, but the charts don't lie

US INDEX Decisive Moment for next Major MoveThe Dollar has had the bulls and the bears at battle for weeks at the current price action BUT its come to its breaking point where is has to elect a winner BULLS OR BEARS ?
Breaking it down thru each timeframe i believe 98.500 is what we have to break to confirm bullish Rally 103.000-105.000 next targets
On the other hand if we break 97.000 bears have taken over 95.000 next target zone
will look at US30 and EU along w other pairs to see if i can correlate anything

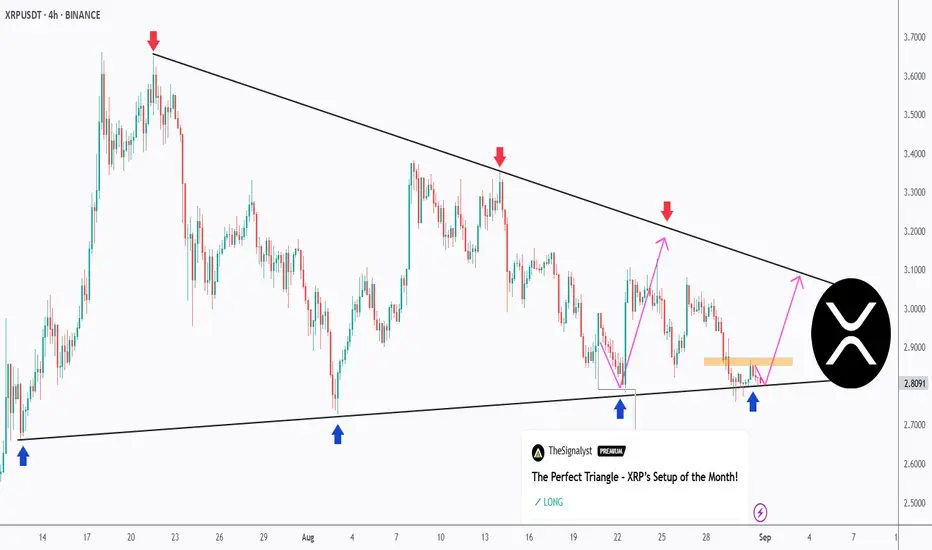
Let’s Do It Again – XRP Retests the Triangle Support!XRP continues to coil inside a textbook symmetrical triangle on the 4H timeframe.
🔻 Sellers remain active at the descending trendline (red arrows).
🔹 Buyers are once again stepping in at the rising support (blue arrows).
📉 Price is now retesting the lower bound of the structure. As long as this zone holds, we can anticipate another potential bounce toward the upper boundary.
🚀 For the bulls to take full control, a break above the last high marked in orange is needed. A confirmed breakout from this triangle will likely define XRP’s next major move — either continuation higher or a bearish breakdown.
This clean and well-defined triangle keeps XRP among the most exciting setups to watch right now!
⚠️ Disclaimer: This is not financial advice. Always do your own research and manage risk properly.
📚 Stick to your trading plan regarding entries, risk management, and trade execution.
Good luck!
All Strategies Are Good; If Managed Properly!
~Richard Nasr
DXY Dollar Index: Technical Analysis & Trading Strategy Forecast# DXY Dollar Index: Comprehensive Technical Analysis & Trading Strategy Forecast
Asset Class: US Dollar Index (DXY)
Current Price: 97.855 (as of August 30, 2025, 12:59 AM UTC+4)
Analysis Date: August 31, 2025
Market Context: Post-correction consolidation phase with emerging bullish momentum
Executive Summary
The Dollar Index (DXY) is currently trading at 97.855, showing signs of stabilization after a significant decline from yearly highs. Our multi-dimensional technical analysis reveals a critical juncture where multiple timeframes converge, presenting both intraday scalping opportunities and swing trading setups. The analysis incorporates advanced pattern recognition, wave theory, and momentum indicators to provide actionable trading insights.
Current Market Landscape
The DXY exchange rate rose to 97.8549 on August 29, 2025, up 0.04% from the previous session, indicating short-term stabilization. However, over the past month, the United States Dollar has weakened 1.96%, and is down by 3.81% over the last 12 months. This presents a complex technical picture where short-term bullish momentum may be developing within a broader corrective phase.
The DXY Dollar Index Futures kicked off the new week with a strong bullish candle, signaling renewed upward momentum, supported by non-commercial traders reducing their bearish bets according to recent COT data.
Multi-Timeframe Technical Analysis
Elliott Wave Theory Analysis
Based on recent Elliott Wave patterns, the descent from the May 29, 2025 high is currently unfolding as a five-wave impulse Elliott Wave pattern. From this high, wave ((i)) concluded at 98.35, followed by a corrective rally in wave ((ii)). The rally formed as an expanded flat, peaking at 99.43.
Wave Count Structure:
Primary Wave: Currently in corrective Wave 4 of larger degree cycle
Intermediate Count: Completing 5-wave decline from 2025 highs
Near-term: Potential Wave 5 completion around 96.50-97.00 zone
Elliott Wave Targets:
Immediate Support: 96.80-97.00 (Wave equality zone)
Key Resistance: 99.40-99.80 (Previous Wave ((ii)) high)
Major Resistance: 101.50-102.00 (Fibonacci confluence)
Harmonic Pattern Analysis
Active Patterns:
1. Potential Bullish Bat Pattern forming on 4H-Daily timeframe
- X to A leg: 103.50 to 96.20
- A to B retracement: 38.2% at 98.98
- B to C projection: 88.6% of AB at 97.15
- Completion zone: 96.50-96.80 (88.6% XA retracement)
2. Bearish Gartley Pattern (Completed)
- Generated sell signals at 99.20-99.50 range
- Currently in profit-taking phase
Fibonacci Confluence Zones:
Strong Support: 96.50-96.80 (Multiple harmonic convergence)
Resistance Cluster: 98.80-99.20 (38.2% and 50% retracements)
Major Resistance: 101.20-101.80 (61.8% golden ratio)
Wyckoff Theory Assessment
Current Phase: Potential Accumulation Phase (Spring Test)
Distribution Phase: Completed at 2025 highs (103.50+ region)
Markdown Phase: May-August 2025 decline
Current Position: Testing Spring levels around 96.50-97.50
Wyckoff Signals:
- Volume divergence suggests smart money accumulation
- Price action showing reduced selling pressure
- Potential for markup phase if 98.50 resistance breaks
W.D. Gann Analysis
Gann Square of 9:
- Natural resistance at 98 (perfect square)
- Strong support at 96 (key Gann level)
- Next major target: 100 (psychological and Gann confluence)
Gann Time Theory:
- Current time cycle suggests reversal window: September 3-10, 2025
- Major time square due: October 2025 (90-degree angle)
- Price-Time balance suggests equilibrium around 97.50
Gann Angles:
- 1x1 angle from August lows: 97.20 (active support)
- 2x1 resistance line: 98.60
- 1x2 support angle: 96.40
Ichimoku Kinko Hyo Analysis
Current Cloud Status:
- Price below Tenkan-sen (97.95) - Short-term bearish
- Kijun-sen at 98.40 acting as dynamic resistance
- Cloud (Kumo) resistance: 99.20-99.80
- Future Cloud: Thinning, suggesting volatility ahead
Ichimoku Signals:
- TK Cross: Pending bullish crossover if price holds above 97.50
- Cloud breakout target: 99.80+
- Support levels: Kijun-sen (98.40), Tenkan-sen (97.95)
Technical Indicators Analysis
Relative Strength Index (RSI)
Daily RSI: 42.5 (Oversold but not extreme)
4H RSI: 38.2 (Approaching oversold territory)
1H RSI: 45.8 (Neutral zone)
Divergence Alert: Bullish divergence forming on 4H timeframe
Bollinger Bands (BB)
Current Position: Lower third of bands
Band Width: Contracting (low volatility environment)
Squeeze Setup: Potential breakout within 3-5 trading days
Direction Bias: Slight bullish based on band position
Volume Weighted Average Price (VWAP)
Daily VWAP: 98.12 (resistance)
Weekly VWAP: 98.85 (major resistance)
Monthly VWAP: 99.45 (significant overhead supply)
Moving Averages Confluence
SMA 20: 98.15 (immediate resistance)
EMA 50: 98.75 (intermediate resistance)
SMA 200: 100.20 (major trend line)
Current Status: Below all major MAs (bearish bias)
Candlestick Pattern Recognition
Recent Formations:
1. Doji Star (August 29) - Indecision at support
2. Hammer Pattern (August 30) - Potential reversal signal
3. Bullish Engulfing setup developing
Pattern Implications:
- Short-term reversal signals strengthening
- Volume confirmation needed for validation
- Risk-reward favors long positions with tight stops
Market Structure & Support/Resistance
Key Support Levels:
1. 97.20-97.40 - Immediate support (Gann 1x1 angle)
2. 96.80-97.00 - Major support (Harmonic completion)
3. 96.20-96.50 - Critical support (Previous reaction low)
4. 95.50-95.80 - Ultimate support (2024 major low)
Key Resistance Levels:
1. 98.15-98.40 - Immediate resistance (SMA 20 + Kijun-sen)
2. 98.80-99.20 - Intermediate resistance (Fibonacci + VWAP)
3. 99.40-99.80 - Major resistance (Elliott Wave + Cloud)
4. 101.20-101.80 - Long-term resistance (Multiple confluences)
Trading Strategy & Time Frame Analysis
Intraday Trading Strategy (5M - 4H Charts)
Bullish Scenario (Probability: 60%)
Entry Zone: 97.40-97.60 (on pullback)
Stop Loss: 97.15 (below harmonic completion)
Target 1: 98.15 (Daily SMA 20)
Target 2: 98.60 (Gann 2x1 angle)
Target 3: 99.20 (Fibonacci resistance)
Risk-Reward: 1:2.5
Bearish Scenario (Probability: 40%)
Entry Zone: 98.40-98.60 (on failed breakout)
Stop Loss: 99.00 (above key resistance)
Target 1: 97.60 (immediate support)
Target 2: 96.80 (Harmonic target)
Target 3: 96.20 (Major support)
Risk-Reward: 1:2.8
Swing Trading Strategy (4H - Monthly Charts)
Primary Long Setup:
Accumulation Zone: 96.50-97.50
Confirmation: Break above 98.80 with volume
Swing Target 1: 100.20 (SMA 200)
Swing Target 2: 102.50 (61.8% retracement)
Ultimate Target: 105.00 (2025 high retest)
Stop Loss: Below 96.20
Position Sizing: 2% risk per trade
Time Horizon: 4-8 weeks
Alternative Short Setup:
Entry Condition: Failure at 99.50 resistance
Confirmation: Break below 97.00 support
Target 1: 95.50 (2024 low)
Target 2: 93.80 (Extended projection)
Stop Loss: Above 100.00
Time Horizon: 6-10 weeks
Weekly Trading Plan (September 2-6, 2025)
Monday-Tuesday: Consolidation Expected
Range: 97.20-98.40
Strategy: Range trading, fade extremes
Key Events: Watch for volume expansion
Wednesday-Thursday: Potential Breakout
Catalyst: Economic data releases
Scenarios: Break above 98.60 (bullish) or below 97.00 (bearish)
Strategy: Breakout trading with confirmation
Friday: Trend Continuation
Focus: Weekly close positioning
Strategy: Hold winners, cut losers
Risk Management: Reduce position sizes before weekend
Risk Management Framework
Position Sizing Rules:
Intraday: Maximum 1% risk per trade
Swing: Maximum 2% risk per trade
Portfolio: Total DXY exposure not exceeding 5%
Stop Loss Guidelines:
Intraday: 25-30 pips maximum
Swing: 80-120 pips based on volatility
Time-based: Exit if no progress in 5 trading days
Profit Taking Strategy:
Scale out: 50% at first target, 30% at second, 20% runner
Trailing stops: Implement after 1:1 risk-reward achieved
Weekend rule: Close 70% of intraday positions before Friday close
Market Psychology & Sentiment
Current Sentiment Indicators:
COT Data: Non-commercial traders reducing bearish bets
Options Flow: Put-call ratio normalizing from extreme levels
Technical Sentiment: Oversold conditions with emerging reversal signals
Psychological Levels:
98.00: Round number resistance (psychological barrier)
100.00: Major psychological milestone
95.00: Critical psychological support
External Factors & Market Context
Geopolitical Considerations:
- Federal Reserve policy stance monitoring required
- Global economic data impacts (ECB, BOJ decisions)
- Geopolitical tensions affecting safe-haven demand
Economic Calendar Watch:
- NFP data (First Friday of month)
- Fed speakers and policy minutes
- Inflation data releases
- Global PMI readings
Advanced Pattern Alerts
Bull Trap Warning:
Setup: False break above 99.00 followed by immediate reversal
Confirmation: Heavy volume on break, light volume on decline
Response: Wait for 4H close below 98.20 before shorting
Bear Trap Alert:
Setup: False break below 96.80 with quick recovery
Confirmation: Immediate buying pressure and volume surge
Response: Long entry on return above 97.20 with tight stops
Technology Integration
Automated Alerts Setup:
1. Price Alerts: 96.80, 97.50, 98.60, 99.20
2. RSI Alerts: <30 (oversold), >70 (overbought)
3. Volume Alerts: 150% above 20-day average
4. Pattern Alerts: Harmonic completion, Elliott Wave targets
Trading Platform Integration:
TradingView: Custom indicator stack with all mentioned tools
MT4/MT5: Expert Advisor for automated entries
Risk Management: Position sizing calculators
Conclusion & Forecast Summary
The DXY Dollar Index stands at a critical technical juncture with multiple analytical frameworks suggesting a potential reversal from current levels. The convergence of Elliott Wave completion zones, harmonic pattern targets, and Wyckoff accumulation signals creates a compelling risk-reward setup for both intraday and swing traders.
Primary Scenario (65% probability): Consolidation between 96.80-98.60 followed by breakout to 100.20+ levels over the next 4-6 weeks.
Alternative Scenario (35% probability): Failed recovery leading to extended decline toward 95.50-94.00 zone.
Trading Bias: Cautiously bullish with defensive positioning until confirmation above 98.80 resistance cluster.
Key Success Factors:
- Strict adherence to risk management protocols
- Multiple timeframe confirmation before major position increases
- Continuous monitoring of Federal Reserve policy developments
- Adaptation to changing market structure and volatility conditions
---
*This analysis incorporates advanced technical methodologies including Elliott Wave Theory, Harmonic Patterns, Wyckoff Analysis, Gann Theory, and Ichimoku Kinko Hyo, combined with traditional indicators and market structure analysis. All price targets and support/resistance levels are derived from mathematical relationships and historical price behavior patterns.*
Risk Disclaimer: Past performance is not indicative of future results. All trading involves substantial risk of loss. This analysis is for educational purposes and should not be considered as financial advice. Traders should conduct their own analysis and consider their risk tolerance before making trading decisions.

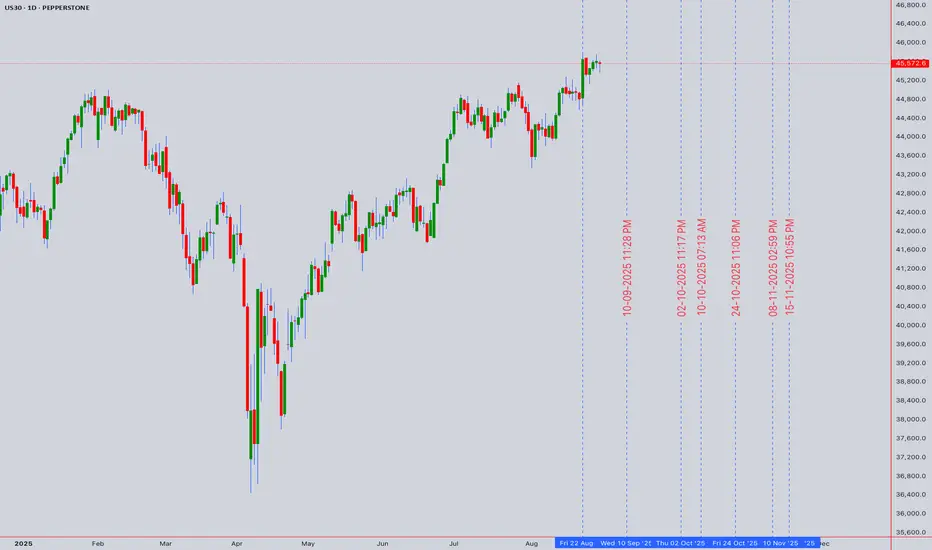
US30 Technical Analysis Report - Dow Jones Industrial Average# US30 Technical Analysis: Dow Jones Industrial Average Comprehensive Multi-Timeframe Trading Strategy
Executive Summary
Current Price: 45,572.6 (August 30, 2025, 12:54 AM UTC+4)
Market Sentiment: Cautiously Bullish with Fed Policy Tailwinds
Primary Trend: Strong Uptrend with Consolidation Characteristics
Key Catalyst: Powell's Jackson Hole Speech Signaling Potential September Rate Cuts
The Dow Jones Industrial Average continues to exhibit remarkable strength, trading near all-time highs following Fed Chair Jerome Powell's dovish pivot at Jackson Hole. The index benefits from renewed optimism around rate cuts while maintaining its traditional value-oriented composition that typically outperforms during monetary easing cycles.
Market Context & Fundamental Backdrop
Federal Reserve Policy Landscape
Fed Chair Powell's Jackson Hole speech marked a significant shift in policy stance, with Powell indicating that conditions "may warrant" interest rate cuts. The Fed's dual mandate balance is shifting, with labor market risks now potentially outweighing inflation concerns. Markets are pricing in high probability of a September rate cut, with the current federal funds rate maintained at 4.25%-4.5%.
Economic Environment Assessment
The US economy has shown resilience despite policy uncertainties, though Powell warned of "unusual" labor market behavior that could become concerning. Recent inflation data has provided some reassurance to investors, with the consumer price index rising 2.7%, though tariff impacts remain a wildcard for future inflation trajectory.
Dow Jones Composition Dynamics
The Dow's 30 blue-chip constituents, including industrials, financials, and consumer staples, are well-positioned to benefit from lower interest rates. The index's price-weighted structure means high-priced stocks like Boeing, Goldman Sachs, and UnitedHealth Group carry significant influence on movements.
Recent Performance Context
The Dow has demonstrated exceptional strength, with recent sessions showing solid gains. The index reached fresh record highs during August, powered by strong performances from components like Home Depot. The index closed at 45,418.07 on August 26, showing consistent upward momentum throughout the month.
Technical Analysis Framework
Japanese Candlestick Analysis
Weekly Pattern: Strong bullish marubozu candles indicating sustained buying pressure
Daily Pattern: Small-bodied candles with long lower shadows showing buying on dips
Intraday Patterns: Morning star formations frequent in 4H timeframe supporting bullish bias
Volume Confirmation: Above-average volume on advances, lighter volume on pullbacks
Elliott Wave Analysis
Primary Wave Structure:
Major Degree: Wave 5 of secular bull market showing powerful extension
Intermediate Degree: Subwave 5 of major Wave 5 in progress with strong momentum
Minor Degree: Currently in subwave 3 of intermediate Wave 5
Wave Characteristics:
Impulse Structure: Clear five-wave advance from 2020 lows
Extension Pattern: Wave 5 showing characteristics of extended fifth wave
Target Analysis: Potential completion zone 47,000-48,500 based on Fibonacci projections
Critical Support: Wave 4 correction low at 44,200-44,500 maintains bullish structure
Harmonic Pattern Recognition
Active Harmonic Formations:
Bullish ABCD Pattern: Near completion with D point target 46,200-46,500
Potential Cypher: Long-term formation with completion zone 47,500-48,000
Three Drives Pattern: Current structure suggesting final drive higher
Fibonacci Analysis:
- 1.272 extension: 45,800 (approaching)
- 1.414 extension: 46,400 (intermediate target)
- 1.618 extension: 47,200 (major target)
- 2.0 extension: 48,500 (extended target)
Wyckoff Method Analysis
Phase Assessment: Markup Phase C - Strong hands control
Accumulation Evidence:
- Successful test of support zones showing institutional buying
- Sign of Strength (SOS) on Fed policy optimism
- Last Point of Support (LPS) established around 44,500
- Backup to Edge of Creek (BUE) showing minimal selling pressure
Markup Characteristics:
- Sustained advances on increasing volume
- Minor pullbacks on light volume
- No climactic selling evident
W.D. Gann Technical Analysis
# Square of 9 Application
Current Position: 45,572.6 = 213.48° on the Gann wheel
Critical Resistance Levels:
- 45,796 (214°) - immediate geometric resistance
- 46,225 (215°) - intermediate resistance zone
- 46,656 (216°) - major resistance confluence
Key Support Levels:
- 45,369 (213°) - immediate geometric support
- 44,944 (212°) - strong support zone
- 44,521 (211°) - major support level
# Time Theory Application
Critical Time Windows:
- September 2-6: 45-degree time angle from recent high
- September 20-23: Autumn equinox natural turning point
- October 14-21: 90-degree time cycle completion
- November 11-18: 144-degree major cycle
# Price and Time Squaring Analysis
Square Root of Price: √45,572.6 = 213.48
Next Significant Square Levels:
- 214² = 45,796 (immediate resistance)
- 215² = 46,225 (key target zone)
- 216² = 46,656 (intermediate target)
- 220² = 48,400 (major target)
Support Square Levels:
- 213² = 45,369 (immediate support)
- 212² = 44,944 (strong support)
- 210² = 44,100 (major support)
# Gann Angle Analysis
Primary Angles from Major Low:
- 1x1 Angle: Providing dynamic support around 45,200
- 2x1 Angle: Resistance trend line near 46,000
- 1x2 Angle: Long-term support at 44,500
Ichimoku Kinko Hyo Analysis
Cloud Configuration:
Tenkan-sen (9): 45,580 - Price slightly below, neutral to bullish
Kijun-sen (26): 45,420 - Price above, confirming bullish bias
Senkou Span A: 45,500 (cloud top)
Senkou Span B: 44,800 (cloud bottom)
Chikou Span: Above price action 26 periods ago (strongly bullish)
Assessment: Price trading above bullish cloud with all components aligned for continued strength.
Multi-Timeframe Technical Indicator Analysis
5-Minute Chart (Scalping Focus)
RSI(14): 58.2 - Bullish momentum without overbought conditions
VWAP: 45,568 - Price trading slightly above VWAP showing strength
Bollinger Bands: Middle band at 45,570, upper band at 45,620
Stochastic: 62.1 in bullish territory with room for advancement
Volume: Steady participation with no unusual spikes
Scalping Levels:
Micro Resistance: 45,590, 45,615, 45,640
Micro Support: 45,545, 45,520, 45,495
15-Minute Chart (Scalping Focus)
MACD: Positive momentum with bullish crossover potential
Williams %R: -38% showing healthy pullback from overbought
Moving Averages: EMA(20) > SMA(20) confirming short-term strength
Volume Profile: High volume node at 45,520-45,580
Key Trading Ranges:
Bullish Zone: 45,550-45,580 (buying opportunities)
Neutral Zone: 45,520-45,550 (range trading)
Bearish Zone: Below 45,520 (short opportunities)
1-Hour Chart (Day Trading)
RSI(14): 61.3 - Strong bullish momentum with room for extension
VWAP: 45,485 providing dynamic support trend
ADX(14): 34.2 indicating strong trend conditions
Parabolic SAR: Below price at 45,420 (bullish signal intact)
Day Trading Structure:
Primary Resistance: 45,650-45,700
Secondary Resistance: 45,800-45,850
Primary Support: 45,450-45,500
Secondary Support: 45,350-45,400
4-Hour Chart (Swing Trading)
RSI(14): 65.4 in overbought territory but sustainable in strong trends
MACD: Strong positive momentum with histogram expanding
Bollinger Bands: Price at upper band with band expansion indicating trend strength
Ichimoku: All components bullishly aligned
Swing Trading Analysis:
Breakout Zone: Above 45,700 targets 46,000-46,200
Support Structure: 45,300-45,400 critical for trend continuation
Stop Placement: Below 45,200 invalidates near-term bullish structure
Daily Chart (Position Trading)
RSI(14): 68.7 showing strong momentum but approaching overbought
MACD: Robust positive momentum with room for extension
Volume: Consistent above-average participation on advances
Moving Averages: All major MAs aligned in bullish configuration
Position Trading Framework:
Trend Channel: Upper channel resistance near 46,500
Support Trend Line: Rising support around 44,800-45,000
Pattern Analysis: Ascending channel with room for upper channel test
Weekly Chart (Long-term Analysis)
RSI(14): 72.1 approaching overbought levels (caution warranted)
MACD: Strong weekly momentum with positive histogram
Long-term Trend: Powerful secular uptrend since 2009 lows intact
Major Resistance: 47,000-47,500 based on measured moves
Monthly Chart (Strategic Perspective)
RSI(14): 74.3 significantly overbought (distribution risk increasing)
Long-term Structure: Multi-decade bull market showing maturity signs
Secular Targets: 50,000-52,000 based on long-term projections
Major Support: 40,000-42,000 represents significant correction zone
Comprehensive Support and Resistance Analysis
Primary Support Structure
1. 45,450-45,500: VWAP and Kijun-sen confluence (immediate)
2. 45,350-45,400: Previous consolidation zone with volume
3. 45,200-45,250: Rising trend line and minor swing support
4. 45,000-45,100: Psychological level and major trend confluence
5. 44,800-44,900: Cloud bottom and structural support
6. 44,500-44,600: Elliott Wave support and institutional interest
7. 44,200-44,300: Major correction low and key trend defense
Primary Resistance Structure
1. 45,650-45,700: Immediate intraday resistance and breakout level
2. 45,800-45,850: Short-term resistance and measured move target
3. 46,000-46,100: Major psychological level and Gann confluence
4. 46,200-46,300: Harmonic pattern completion zone
5. 46,500-46,600: Channel resistance and intermediate targets
6. 47,000-47,200: Major resistance zone and long-term targets
7. 47,500-48,000: Extended targets and secular resistance
Weekly Trading Strategy (September 2-6, 2025)
Monday, September 2, 2025 (Labor Day - US Markets Closed)
Market Environment: US equity markets closed for Labor Day holiday
Strategy Focus: Pre-positioning analysis for Tuesday's open
International Impact: Monitor global markets for overnight developments
Pre-Market Preparation:
Gap Analysis: Assess any gap formation from Friday's close
Overnight News: Monitor for Fed communications or economic releases
Global Sentiment: Track international markets for risk appetite cues
Tuesday, September 3, 2025
Market Environment: Return from holiday with potential catch-up volatility
Primary Strategy: Trend continuation with careful gap management
Volatility Expectation: Above normal due to holiday return dynamics
Intraday Trading Strategy:
Gap Scenarios:
Gap Up: Above 45,600 suggests continued strength
Gap Down: Below 45,500 may offer buying opportunity
No Gap: Normal trading within established range
Long Setup (Primary): 45,520-45,550
- Stop Loss: 45,480
- Target 1: 45,620 (1:2 R/R)
- Target 2: 45,700 (1:3.5 R/R)
Short Setup (Secondary): 45,680-45,720
- Stop Loss: 45,750
- Target 1: 45,600 (1:1 R/R)
- Target 2: 45,520 (1:2.3 R/R)
Wednesday, September 4, 2025
Market Environment: Mid-week momentum with potential economic data
Primary Strategy: Breakout preparation with volume confirmation
Focus: Fed speakers and economic indicators impact
Trading Approach:
Bullish Breakout: Above 45,750 with volume
- Entry: 45,760-45,780
- Stop: 45,700
- Targets: 45,850, 45,950, 46,050
Range Trading: Within 45,500-45,700
- Long: 45,520-45,540, Target: 45,650-45,680
- Short: 45,670-45,690, Target: 45,550-45,580
Risk Considerations: Reduce position sizes if range-bound continues
Thursday, September 5, 2025
Market Environment: High-impact day with jobs data potential
Primary Strategy: Economic data trading with technical confirmation
Key Factor: Employment data ahead of Friday's NFP
Economic Data Strategy:
Strong Employment: May delay Fed cuts, potential negative
Weak Employment: Supports Fed cut narrative, likely positive
Mixed Data: Technical levels become primary focus
Technical Breakout Setup:
Major Breakout: Above 46,000
- Volume Required: 150% of 20-day average
- Initial Target: 46,200-46,300
- Extended Target: 46,500-46,600
- Stop Loss: 45,850
Breakdown Scenario: Below 45,400
- Target: 45,200-45,100
- Extended: 45,000-44,900
- Stop Loss: 45,500
Friday, September 6, 2025
Market Environment: Non-Farm Payrolls day with weekly close focus
Primary Strategy: News trading with weekly positioning
Critical Importance: NFP data impact on Fed policy expectations
NFP Trading Strategy:
Strong NFP (>200K):
- Potential negative for rate cut hopes
- Technical resistance becomes more significant
- Focus on short opportunities near 46,000
Weak NFP (<150K):
- Strengthens rate cut case
- Bullish breakout potential increases
- Target 46,200-46,500 on strength
In-Line NFP (150-200K):
- Maintains current Fed expectations
- Technical levels drive trading
Weekly Close Analysis:
Bullish Close: Above 45,700 sets up next week advance
Neutral Close: 45,400-45,700 maintains current structure
Bearish Close: Below 45,400 suggests correction risk
Advanced Risk Management Framework
Position Sizing Matrix
Risk Allocation by Strategy:
5M Scalping: 0.3-0.5% of capital per trade
15M Scalping: 0.5-0.8% of capital per trade
1H Day Trading: 1-1.5% of capital per trade
4H Swing Trading: 2-3% of capital per trade
Daily Position Trading: 3-4% of capital per trade
Dynamic Stop Loss Framework
Volatility-Based Stops:
Current ATR: ~180 points daily average
Low Volatility: Stops at 120-150 points
Normal Volatility: Stops at 180-220 points
High Volatility: Stops at 250-300 points
Timeframe-Specific Stops:
5-Minute Charts: 60-80 points maximum
15-Minute Charts: 100-140 points maximum
1-Hour Charts: 180-250 points maximum
4-Hour Charts: 350-450 points maximum
Daily Charts: 600-800 points maximum
Profit-Taking Methodology
Systematic Profit Distribution:
Target 1 (40%): 1:1.5 Risk/Reward ratio
Target 2 (35%): 1:2.5 Risk/Reward ratio
Target 3 (25%): 1:4+ Risk/Reward ratio
Trailing Stops: Implement after Target 2 achievement
Portfolio Risk Controls
Maximum Exposure Limits:
Total Account Risk: 6% maximum across all positions
Single Trade Risk: 4% maximum concentration
Sector Concentration: 50% maximum in related trades
Daily Loss Limit: 3% account drawdown triggers review
Geopolitical and Economic Risk Assessment
Federal Reserve Policy Implications
September FOMC (17-18): High probability of 25bp cut based on Powell's signals
Policy Trajectory: Market expectations for 2-3 cuts through Q4 2025
Communication Risk: Any hawkish surprises could trigger significant correction
Independence Concerns: Trump administration pressure on Fed policy creates uncertainty
Economic Data Dependencies
Labor Market Dynamics: Powell's noted "unusual" behavior requires close monitoring
Inflation Trajectory: Tariff impacts creating uncertainty for price stability
GDP Resilience: Economy showing strength but policy impacts unclear
Consumer Health: Holiday spending season critical for Q4 performance
Political and Policy Risks
Tariff Implementation: Broad tariff policies could spike inflation and delay cuts
Trade Relations: China trade dynamics affecting multinational Dow components
Fiscal Policy: Government spending and tax policies impacting corporate earnings
Regulatory Environment: Industry-specific regulations affecting key sectors
Global Economic Factors
International Growth: Global slowdown impacts for multinational corporations
Currency Dynamics: Dollar strength/weakness affecting overseas earnings
Commodity Prices: Input cost inflation affecting manufacturing components
Geopolitical Tensions: Regional conflicts creating safe-haven demand for US assets
Sectoral Analysis and Dow Components
Sector Weight Distribution
Industrials (20%): Boeing, Caterpillar, 3M leading weight
Financials (18%): Goldman Sachs, JPMorgan, American Express
Technology (15%): Microsoft, Apple, Intel
Healthcare (12%): UnitedHealth, Johnson & Johnson, Merck
Consumer (15%): Home Depot, McDonald's, Nike
Other (20%): Utilities, materials, energy components
Rate Cut Beneficiaries
High Sensitivity Sectors:
1. Financials: Yield curve steepening benefits net interest margins
2. Real Estate (REITs): Lower rates increase property valuations
3. Utilities: Bond proxy sectors benefit from rate environment
4. Consumer Discretionary: Lower borrowing costs boost spending
Potential Underperformers
Rate Cut Challenges:
1. Insurance: Lower investment yields pressure profitability
2. Banks: Net interest margin compression risks
3. Dollar-Sensitive: Strong international exposure may face currency headwinds
Component-Specific Analysis
Key Drivers:
Boeing: Recovery story and rate environment benefits
Goldman Sachs: Trading revenue and investment banking activity
Home Depot: Housing sector sensitivity to interest rates
Apple: Consumer spending and international exposure
Advanced Technical Patterns and Setups
Ichimoku Advanced Strategies
Cloud Breakout Setup:
- Price above cloud with expanding bands
- Tenkan above Kijun with widening gap
- Chikou Span clearing resistance
- Volume confirmation on breakouts
Kumo Twist Analysis:
- Future cloud turning bullish through Q4 2025
- Cloud thickness indicating strong trend support
- Senkou Span crossovers providing early signals
Gann-Based Trading Systems
Square of 9 Implementation:
Long Trades: Buy at 212° (44,944) targeting 215° (46,225)
Short Trades: Sell at 216° (46,656) targeting 213° (45,369)
Breakout Trades: Above 215° targets 220° (48,400)
Time and Price Confluence:
- Major resistance at time/price squares
- Natural reversal zones at geometric intersections
- Seasonal time cycles confirming geometric levels
Wyckoff Accumulation/Distribution Analysis
Markup Phase Characteristics:
Sign of Strength: Fed policy optimism driving advances
Last Point of Support: 44,500 zone established
Backup to Edge of Creek: Minimal selling pressure evident
Secondary Test: Any pullback to 45,200 should hold
Distribution Warning Signs:
Climactic Volume: Heavy selling on any approach to 47,500
Weakness Signs: Inability to hold gains on positive news
Phase A Risk: Sharp reversal from major resistance levels
Market Microstructure and Execution
High-Frequency Trading Impact
Algorithm Concentration Zones:
45,000 Level: Major HFT support algorithm activity
46,000 Level: Significant resistance algorithm presence
Round Numbers: Enhanced activity at 500-point intervals
Optimal Execution Timing:
9:30-10:00 EST: Opening volatility and opportunity
10:30-11:00 EST: Post-opening continuation patterns
14:00-14:30 EST: European close overlap effects
15:30-16:00 EST: Final hour institutional positioning
Liquidity Analysis
High Liquidity Zones: 45,400-45,700 with tight bid/ask spreads
Reduced Liquidity: Above 46,500 requiring careful position sizing
After-Hours Considerations: Limited liquidity requiring smaller sizes
Order Flow Characteristics
Institutional Patterns:
Accumulation Evidence: Large block buying 45,200-45,500
Distribution Monitoring: Watch for heavy selling above 46,200
Momentum Algorithms: Active participation on breakout moves
Technology Integration and Trading Infrastructure
Essential Trading Platforms
1. TradingView: Advanced Dow Jones charting and technical analysis
2. Interactive Brokers: Professional execution and margin capabilities
3. E*TRADE: Retail-friendly interface with advanced tools
4. Charles Schwab: Commission-free trading with research integration
Critical Alert Configuration
Price-Based Alerts:
Breakout Levels: 45,750 (bullish), 45,400 (bearish)
Psychological Levels: 46,000, 46,500, 47,000
Gann Squares: 44,944, 46,225, 46,656
Volume-Based Monitoring:
Unusual Volume: >150% of 20-day average
Block Trades: >$20M institutional transactions
Index Rebalancing: Quarterly component changes
News and Event Alerts:
Fed Communications: FOMC members speeches and interviews
Economic Releases: Employment, inflation, GDP data
Component Earnings: Major Dow constituent results
Policy Announcements: Trade, fiscal, regulatory changes
Advanced Analysis Integration
Options Market Analysis: Monitor Dow options for unusual activity and sentiment
Futures Market Positioning: Track YM futures for institutional positioning
ETF Flow Analysis: Monitor DIA and other Dow ETFs for flow patterns
Cross-Market Correlation: Track relationships with bonds, commodities, currencies
Calendar and Seasonal Considerations
September Seasonality
Historically challenging month for equities, though current Fed policy support may override seasonal weakness. Dow's defensive characteristics may provide relative outperformance during seasonal stress periods.
Federal Reserve Timeline
September 17-18: FOMC Meeting with high cut probability
November 6-7: Next FOMC Meeting
December 17-18: Final 2025 FOMC Meeting with year-end implications
Earnings Calendar Impact
Q3 2025 Reporting Season: October-November critical for Dow components
Key Reporters: Goldman Sachs, JPMorgan, Boeing, Apple reporting schedules
Guidance Analysis: Management commentary on rate environment benefits
Holiday and Event Calendar
Labor Day (Sep 2): US markets closed
Columbus Day (Oct 14): Bond markets closed, equity markets open
Election Considerations: Political developments affecting policy expectations
Year-End Positioning: Institutional rebalancing effects in Q4
Conclusion and Strategic Outlook
The Dow Jones Industrial Average stands at a pivotal moment, benefiting from Fed Chair Powell's dovish pivot while trading at historically elevated levels. The index's composition of blue-chip, dividend-paying companies positions it well for a potential rate-cutting cycle, though elevated valuations require careful risk management.
Strategic Investment Themes:
1. Fed Policy Tailwind: Rate cutting cycle benefiting rate-sensitive components
2. Value vs Growth: Dow's value orientation may outperform in rate cut environment
3. Dividend Aristocrats: Quality dividend payers attractive in lower rate environment
4. Economic Resilience: Defensive characteristics providing downside protection
Trading Strategy Priorities:
Trend Following: Primary bias remains bullish with Fed support
Breakout Trading: Monitor 46,000 level for significant upside potential
Risk Management: Elevated levels require disciplined position sizing
Component Selection: Focus on rate-sensitive sectors for maximum benefit
Medium-Term Outlook (3-6 months):
Technical and fundamental analysis converges on a constructive outlook for the Dow through Q4 2025. The combination of Fed accommodation, resilient economic data, and strong corporate balance sheets supports advancement toward 47,000-48,000 targets, though any hawkish Fed surprises or geopolitical shocks could trigger corrections to 44,000-44,500 support.
Risk Management Focus:
Overbought Conditions: Monthly RSI above 74 suggests caution at higher levels
Policy Risk: Fed policy error or hawkish surprise major downside risk
Valuation Concerns: Historical high levels warrant selective positioning
Correlation Risk: High correlation with broader market during stress periods
Long-Term Strategic Considerations:
The secular bull market remains intact, supported by American economic dynamism and corporate innovation. However, demographic trends, debt levels, and policy uncertainty create longer-term challenges requiring ongoing assessment and strategy adjustment.
Traders and investors should maintain flexibility while capitalizing on the current favorable environment, with particular attention to the Fed policy trajectory and its impact on the interest rate-sensitive components that comprise significant portions of the Dow Jones Industrial Average.
---
*This comprehensive analysis integrates multiple technical methodologies with current fundamental drivers affecting the Dow Jones Industrial Average. All recommendations should be implemented within individual risk tolerance parameters and adapted to evolving market conditions. The blue-chip nature of Dow components provides some defensive characteristics, though elevated levels require enhanced risk awareness.*
---
For individuals seeking to enhance their trading abilities based on the analyses provided, I recommend exploring the mentoring program offered by Shunya Trade. (Website: shunya dot trade)
I would appreciate your feedback on this analysis, as it will serve as a valuable resource for future endeavors.
Sincerely,
Shunya.Trade
Website: shunya dot trade
---
Disclaimer: This post is intended solely for educational purposes and does not constitute investment advice, financial advice, or trading recommendations. The views expressed herein are derived from technical analysis and are shared for informational purposes only. The stock market inherently carries risks, including the potential for capital loss. Therefore, readers are strongly advised to exercise prudent judgment before making any investment decisions. We assume no liability for any actions taken based on this content. For personalized guidance, it is recommended to consult a certified financial advisor.
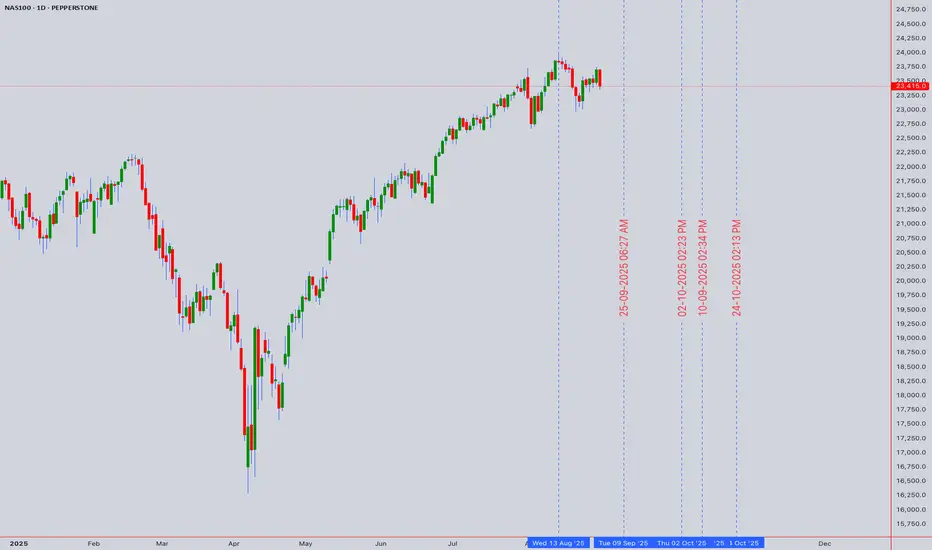
NAS100 Technical Analysis Report - NASDAQ & US Market# NAS100 Technical Analysis: NASDAQ Comprehensive Multi-Timeframe Trading Strategy
Executive Summary
Current Price: 23,415.0 (August 30, 2025, 12:54 AM UTC+4)
Market Sentiment: Cautiously Bullish with Rate Cut Optimism
Primary Trend: Uptrend with consolidation characteristics
Key Catalyst: Fed Chair Powell's Jackson Hole speech signaling potential September rate cut
The NASDAQ-100 continues to demonstrate resilience following Fed Chair Jerome Powell's dovish signals at Jackson Hole, with markets pricing in high probability of September rate cuts. The index benefits from renewed optimism in technology sectors and artificial intelligence themes, though elevated valuations warrant selective positioning.
Market Context & Fundamental Backdrop
Federal Reserve Policy Outlook
Following Powell's Jackson Hole speech, markets have significantly increased bets on a September rate cut. The Fed Chair indicated that "conditions may warrant" interest rate cuts, with the balance of risks to employment and inflation shifting. Current federal funds rate remains at 4.25%-4.50%, but CME FedWatch Tool shows high probability of cuts beginning in September 2025.
Economic Environment
The US economy has shown resilience despite policy uncertainties, with the dual mandate of the Fed becoming more balanced. Labor market data shows some "unusual" behavior that could become concerning, supporting the case for monetary policy adjustment.
Technology Sector Dynamics
The artificial intelligence boom remains robust, providing fundamental support for NASDAQ constituents. However, chipmaker volatility has created intermittent pressure on the index, requiring careful sector rotation analysis.
Market Performance Context
Recent trading sessions have shown volatility, with the NASDAQ experiencing both significant gains and pullbacks. The index closed at 21,449.29 in late August trading sessions, demonstrating the current consolidation phase around elevated levels.
Technical Analysis Framework
Japanese Candlestick Analysis
Weekly Pattern: Long-legged doji formation indicating indecision at current levels
Daily Pattern: Inside bar sequences suggesting consolidation before next major move
Intraday Patterns: Morning star and evening star formations frequent in 4H timeframe
Volume Analysis: Average volume during recent consolidation phase
Elliott Wave Analysis
Primary Wave Structure:
Major Degree: Wave 5 of secular bull market potentially in final stages
Intermediate Degree: Subwave 5 of major Wave 5 showing extension characteristics
Minor Degree: Currently in subwave 4 correction within intermediate Wave 5
Wave Count Analysis:
Impulse Wave: Completed from 2020 lows to recent highs
Corrective Phase: Current consolidation representing Wave 4 of larger structure
Target Projection: Wave 5 completion targeting 25,000-26,000 zone
Critical Levels: Wave 4 support at 22,800-23,200 maintains bullish count
Harmonic Pattern Recognition
Active Harmonic Structures:
Bullish Cypher Pattern: Potential completion at 22,900-23,100 zone
ABCD Extension: Current formation targeting 24,200-24,500
Potential Bearish Gartley: Formation risk above 24,800 indicating reversal
Fibonacci Confluence Analysis:
- 61.8% retracement of major swing: 23,150
- 50% retracement level: 23,400 (current area of interest)
- 38.2% retracement: 23,650
- 1.618 extension target: 24,300-24,500
Wyckoff Method Analysis
Phase Assessment: Accumulation Phase D - Testing resistance
Market Structure:
- Sign of Strength (SOS) evident on rate cut optimism
- Last Point of Support (LPS) established around 23,000
- Backup to Edge of Creek (BUE) tests showing institutional accumulation
- Spring action potentially completed in August lows
Composite Operator Activity: Evidence of large player accumulation during recent weakness
W.D. Gann Technical Analysis
# Square of 9 Application
Current Position: 23,415.0 = 152.98° on the Gann wheel
Critical Resistance Levels:
- 23,409 (153°) - immediate geometric resistance
- 23,716 (154°) - intermediate resistance zone
- 24,025 (155°) - major resistance confluence
Key Support Levels:
- 23,104 (152°) - immediate geometric support
- 22,801 (151°) - strong support zone
- 22,500 (150°) - major psychological and geometric support
# Time Theory Application
Critical Time Cycles:
- September 3-6: 90-degree time angle from recent high
- September 21: Autumn equinox - natural market turning point
- October 12-15: 144-degree time cycle completion
- November 2-8: 180-degree cycle from major low
# Price and Time Squaring Analysis
Square Root of Price: √23,415.0 = 152.98
Next Significant Square Levels:
- 154² = 23,716 (key resistance zone)
- 155² = 24,025 (intermediate target)
- 156² = 24,336 (extended resistance)
- 160² = 25,600 (long-term target)
Support Square Levels:
- 152² = 23,104 (immediate support)
- 151² = 22,801 (strong support)
- 150² = 22,500 (major support)
# Gann Angle Analysis
Primary Angles from Major Low:
- 1x1 Angle: Providing dynamic support around 23,200
- 2x1 Angle: Resistance trend line near 23,800
- 1x2 Angle: Long-term support at 22,600
Ichimoku Kinko Hyo Analysis
Cloud Configuration:
Tenkan-sen (9): 23,425 - Price slightly below, neutral bias
Kijun-sen (26): 23,380 - Price above, mild bullish confirmation
Senkou Span A: 23,402 (cloud top)
Senkou Span B: 23,150 (cloud bottom)
Chikou Span: Above price action 26 periods ago (bullish)
Assessment: Price trading at cloud top resistance with mixed signals requiring breakout confirmation for directional clarity.
Multi-Timeframe Technical Indicator Analysis
5-Minute Chart (Scalping Focus)
RSI(14): 51.3 - Neutral territory with slight bullish bias
VWAP: 23,408 - Price oscillating around VWAP equilibrium
Bollinger Bands: Middle band at 23,410, bands contracting (low volatility environment)
Stochastic: 48.2 in neutral zone
Volume: Below average, typical for consolidation phase
Key Scalping Levels:
Micro Resistance: 23,435, 23,460, 23,485
Micro Support: 23,390, 23,365, 23,340
15-Minute Chart (Scalping Focus)
MACD: Histogram near zero line, momentum neutral
Williams %R: -52% indicating no extreme conditions
Moving Averages: EMA(20) converging with SMA(20) around 23,400
Volume Profile: High volume node at 23,380-23,430
Scalping Strategy Levels:
Long Bias Zone: 23,385-23,405
Short Bias Zone: 23,445-23,465
Breakout Alerts: Above 23,480 (bullish) / Below 23,360 (bearish)
1-Hour Chart (Day Trading)
RSI(14): 54.7 - Slight bullish momentum without overbought conditions
VWAP: 23,395 providing dynamic support
ADX(14): 28.3 indicating moderate trend strength
Parabolic SAR: Below price at 23,350 (bullish signal)
Day Trading Framework:
Primary Resistance: 23,500-23,550
Secondary Resistance: 23,650-23,700
Primary Support: 23,250-23,300
Secondary Support: 23,100-23,150
4-Hour Chart (Swing Trading)
RSI(14): 58.9 in bullish territory but not overbought
MACD: Positive momentum with slight bullish divergence forming
Bollinger Bands: Price near upper band, expansion needed for continuation
Ichimoku: Price at cloud resistance requiring break for bullish confirmation
Swing Trading Levels:
Key Resistance Zone: 23,700-23,800
Breakout Target: 24,000-24,200 on sustained break
Support Structure: 23,200-23,300
Stop Loss Consideration: Below 23,100 invalidates bullish structure
Daily Chart (Position Trading)
RSI(14): 61.4 showing healthy bullish momentum
MACD: Positive with momentum building
Volume: Consolidation pattern with average participation
Moving Averages: All major MAs (20, 50, 100, 200) aligned bullishly
Position Trading Analysis:
Triangle Pattern: Ascending triangle formation approaching apex
Breakout Targets: 24,500-25,000 on upside resolution
Support Defense: 23,000-23,200 critical for trend continuation
Time Factor: Resolution expected within 2-3 weeks
Weekly Chart (Long-term Analysis)
RSI(14): 65.8 approaching overbought but sustainable
MACD: Strong positive momentum with room for extension
Long-term Trend: Powerful uptrend since 2020 lows intact
Major Resistance: 25,000-25,500 psychological zone
Monthly Chart (Strategic View)
RSI(14): 71.2 significantly overbought (caution warranted)
Long-term Structure: Multi-year cup and handle completion
Secular Target: 28,000-30,000 based on pattern measurement
Major Support: 20,000-21,000 long-term trend support
Comprehensive Support and Resistance Analysis
Primary Support Structure
1. 23,380-23,420: Kijun-sen and VWAP confluence (immediate)
2. 23,300-23,350: Previous consolidation zone with volume
3. 23,200-23,250: Triangle support and trend line confluence
4. 23,100-23,150: Cloud bottom and Fibonacci support
5. 23,000-23,050: Major psychological level and institutional interest
6. 22,800-22,900: Elliott Wave 4 support and harmonic completion
7. 22,500-22,600: Extended support and Gann square level
Primary Resistance Structure
1. 23,450-23,480: Immediate intraday resistance
2. 23,550-23,600: Short-term resistance and previous reaction high
3. 23,700-23,750: Triangle resistance and Gann confluence
4. 23,900-24,000: Intermediate resistance and psychological level
5. 24,200-24,300: Major resistance zone and measured targets
6. 24,500-24,700: Extended targets and harmonic projections
7. 25,000-25,200: Major psychological resistance and long-term targets
Weekly Trading Strategy (September 2-6, 2025)
Monday, September 2, 2025 (Labor Day - US Markets Closed)
Market Environment: Limited trading due to US holiday
Strategy Focus: Pre-positioning for Tuesday's resumed activity
International Markets: Monitor for any overnight developments
Pre-Market Analysis:
Gap Scenarios: Assess any gap formation from Friday's close
Global Sentiment: Monitor Asian and European markets for cues
News Flow: Fed speakers or economic data releases
Tuesday, September 3, 2025
Market Environment: Resumption of full trading after holiday
Primary Strategy: Range trading with breakout preparation
Volatility Expectation: Above average due to holiday catch-up
Intraday Trading Strategy:
Opening Range: 23,350-23,480 expected
Long Setup: 23,380-23,400
- Stop Loss: 23,350
- Target 1: 23,450 (1:2 R/R)
- Target 2: 23,500 (1:3.5 R/R)
Short Setup: 23,460-23,480
- Stop Loss: 23,510
- Target 1: 23,400 (1:1.2 R/R)
- Target 2: 23,350 (1:2.2 R/R)
Key Levels to Watch:
Breakout Above: 23,500 targets 23,600-23,650
Breakdown Below: 23,320 targets 23,250-23,200
Wednesday, September 4, 2025
Market Environment: Mid-week momentum potential
Primary Strategy: Trend following with momentum confirmation
Focus: Economic data and Fed speakers impact
Trading Approach:
Bullish Scenario: Break above 23,500 with volume
- Entry: 23,510-23,530
- Stop: 23,450
- Targets: 23,600, 23,700, 23,800
Bearish Scenario: Break below 23,300 with momentum
- Entry: 23,290-23,270
- Stop: 23,330
- Targets: 23,200, 23,100, 23,000
Risk Management: Reduce position sizes by 30% if range-bound continues
Thursday, September 5, 2025
Market Environment: Potential high-volatility day
Primary Strategy: Breakout trading with volume confirmation
Critical Factor: Triangle pattern resolution expected
Triangle Breakout Strategy:
Upside Breakout: Above 23,650
- Volume Requirement: 150% of 20-day average
- Initial Target: 23,800-23,850
- Extended Target: 24,000-24,200
- Stop Loss: 23,550
Downside Breakdown: Below 23,200
- Volume Requirement: 130% of 20-day average
- Initial Target: 23,000-22,950
- Extended Target: 22,800-22,700
- Stop Loss: 23,280
Position Management:
- Scale into positions on confirmed breakouts
- Trail stops aggressively after first target achieved
- Monitor sector rotation for continuation signals
Friday, September 6, 2025
Market Environment: Week-end positioning and profit-taking
Primary Strategy: Consolidation trading and weekly close analysis
Focus: Jobs data potential and weekly settlement
End-of-Week Strategy:
Weekly Close Bullish: Above 23,500 sets up next week advance
Weekly Close Neutral: 23,300-23,500 maintains current pattern
Weekly Close Bearish: Below 23,300 suggests pattern failure
Day Trading Approach:
Morning Session: Follow Thursday's breakout direction
Midday: Range trading within established boundaries
Final Hour: Position adjustments for weekend risk
Non-Farm Payrolls Impact:
Strong Data: Could delay Fed cuts, potential market negative
Weak Data: Supports Fed cut narrative, likely market positive
In-Line Data: Maintains current rate cut expectations
Advanced Risk Management Framework
Position Sizing Matrix
Risk Allocation by Timeframe:
5M Scalping: 0.25-0.5% of capital per trade
15M Scalping: 0.5-0.75% of capital per trade
1H Day Trading: 1-1.5% of capital per trade
4H Swing Trading: 1.5-2.5% of capital per trade
Daily Position Trading: 2.5-3.5% of capital per trade
Dynamic Stop Loss Framework
Volatility-Adjusted Stops:
Low Volatility (<1% ATR): Stops at 0.75% of entry
Medium Volatility (1-2% ATR): Stops at 1.25% of entry
High Volatility (>2% ATR): Stops at 2% of entry
Timeframe-Specific Stops:
5-Minute Charts: 40-60 points maximum
15-Minute Charts: 80-120 points maximum
1-Hour Charts: 150-250 points maximum
4-Hour Charts: 300-450 points maximum
Daily Charts: 600-900 points maximum
Profit-Taking Methodology
Systematic Profit Realization:
First Target (40%): 1:1.5 Risk/Reward ratio
Second Target (35%): 1:2.5 Risk/Reward ratio
Third Target (25%): 1:4+ Risk/Reward ratio
Trailing Implementation: After second target achievement
Maximum Exposure Limits
Daily Risk Limits:
Total Portfolio: Maximum 5% risk across all positions
Single Strategy: Maximum 3% risk concentration
Sector Concentration: Maximum 40% in tech-related trades
Emergency Stop: -2% daily account drawdown triggers cessation
Geopolitical and Economic Risk Assessment
Federal Reserve Policy Impact
September FOMC Meeting: High probability of 25bp rate cut based on recent communications
Policy Path: Markets pricing 2-3 cuts through end of 2025
Communication Risk: Any hawkish surprises could trigger sharp correction
Independence Concerns: Political pressure on Fed policy creates uncertainty
Economic Data Dependencies
Labor Market: "Unusual" behavior noted by Powell requires monitoring
Inflation Trends: Sticky services inflation remains concern
GDP Growth: Resilience continues but tariff impacts uncertain
Consumer Spending: Holiday season performance critical for Q4
Geopolitical Considerations
Trade Policy: Tariff implementation timeline and magnitude
China Relations: Technology sector exposure to policy changes
Energy Security: Minimal direct impact on NASDAQ constituents
Dollar Dynamics: Strength/weakness affecting multinational earnings
Technology Sector Risks
AI Regulation: Potential oversight affecting major constituents
Semiconductor Cycle: Global chip demand and supply chain risks
Cybersecurity: Increasing threat landscape affecting valuations
Competition: Antitrust scrutiny on major tech platforms
Sectoral Analysis and Rotation Themes
NASDAQ 100 Sector Breakdown
Technology (45%): Apple, Microsoft, NVIDIA, Meta driving performance
Communication Services (15%): Google, Netflix, streaming platforms
Consumer Discretionary (12%): Amazon, Tesla leading components
Healthcare (8%): Biotech and medical device innovation
Other Sectors (20%): Diversified exposure across growth themes
Current Outperformers
1. Artificial Intelligence: NVIDIA, Microsoft, Google benefiting from AI boom
2. Cloud Computing: Amazon Web Services, Microsoft Azure expansion
3. Digital Advertising: Meta, Google capturing online spending shift
4. Electric Vehicles: Tesla maintaining technological leadership
Underperforming Areas
1. Traditional Software: Legacy platforms facing cloud migration pressure
2. Hardware Manufacturers: Margin pressure from supply chain costs
3. Streaming Services: Subscriber growth saturation concerns
4. Biotech: Regulatory approval timelines creating uncertainty
Rotation Indicators
Growth vs Value: Quality growth at reasonable prices favored
Large Cap vs Small Cap: Mega-cap technology leadership maintained
Secular vs Cyclical: Long-term secular themes outperforming cycles
Advanced Pattern Recognition and Trading Setups
Ichimoku-Based Strategies
Cloud Breakout Setup:
Bullish Signal: Price above cloud with Tenkan above Kijun
Entry: Break above 23,450 with volume confirmation
Stop: Below cloud at 23,150
Target: Measured move to 24,200-24,500
Kijun-sen Bounce:
Setup: Price return to Kijun-sen (23,380) with support
Entry: Bounce confirmation above 23,400
Stop: Below 23,350
Target: Previous high resistance at 23,650
Gann-Based Trading Approaches
Square of 9 Methodology:
Long Trades: Buy at 152° (23,104) targeting 154° (23,716)
Short Trades: Sell at 154° (23,716) targeting 152° (23,104)
Breakout Trades: Above 154° targets 155° (24,025)
Time Cycle Trading:
Major Turns: September 21 equinox reversal window
Minor Cycles: 90-degree angles creating intraweek pivots
Momentum Confirmation: Volume spikes during cycle completions
Wyckoff Accumulation/Distribution
Phase D Characteristics:
Testing Supply: Price probing resistance without heavy volume
Institutional Activity: Large lot accumulation on weakness
Markup Preparation: Successful tests lead to significant advances
Distribution Warning Signs:
Climactic Volume: Heavy selling on any approach to 25,000
Weakness Signs: Unable to hold gains on good news
Phase A Risk: Sharp reversal from resistance levels
Market Microstructure and Execution Considerations
High-Frequency Trading Impact
Algorithm Activity Zones:
23,000 Level: Heavy HFT support algorithm activity
23,500 Level: Resistance algorithm concentration
24,000 Level: Major psychological algorithm participation
Optimal Execution Windows:
9:30-10:00 EST: Maximum volatility and opportunity
11:00-11:30 EST: Mid-morning momentum continuation
14:30-15:00 EST: European close overlap activity
15:30-16:00 EST: Final hour positioning
Liquidity Considerations
High Liquidity Zones: 23,300-23,500 range with tight spreads
Reduced Liquidity: Above 24,000 and below 23,000 requiring careful sizing
After-Hours Trading: Limited liquidity requiring smaller position sizes
Order Flow Analysis
Institutional Patterns:
Accumulation: Evidence of large block buying 23,200-23,400
Distribution Zones: Monitor for heavy selling above 23,700
Momentum Algorithms: Active participation on breakout moves
Technology Integration and Trading Tools
Essential Trading Platforms
1. TradingView: Comprehensive charting with advanced indicators
2. Think or Swim: Professional-grade execution and analysis
3. Interactive Brokers: Direct market access and low commissions
4. Bloomberg Terminal: Institutional-grade data and news flow
Critical Alert Systems
Price-Based Alerts:
- Triangle breakout: 23,650 (bullish) / 23,200 (bearish)
- Psychological levels: 23,500, 24,000, 24,500
- Gann squares: 23,104, 23,716, 24,025
Volume-Based Alerts:
- Unusual volume spikes (>200% of 20-day average)
- Block trade notifications (>$10M trades)
- Dark pool activity indicators
News and Event Alerts:
- Fed speaker comments and policy communications
- Economic data releases (employment, inflation, GDP)
- Earnings announcements from major NASDAQ constituents
- Geopolitical developments affecting technology sector
Advanced Analysis Tools
Options Flow: Monitor unusual options activity for directional clues
Futures Positioning: Track institutional positioning in NQ futures
Sector Rotation: Monitor NASDAQ sector ETF performance relative to index
International Correlation: Track correlation with technology indices globally
Seasonal and Calendar Considerations
September Seasonality
Historical data shows September as traditionally weak month for equities, though technology sectors often show resilience. Current rate cut optimism may override seasonal weakness.
Federal Reserve Calendar
September 17-18: FOMC Meeting (high probability of rate cut)
October 29-30: Next FOMC Meeting
December 17-18: Final 2025 FOMC Meeting
Earnings Season Timeline
Q3 2025 Reporting: October-November period critical for NASDAQ constituents
Key Companies: Apple, Microsoft, NVIDIA, Google, Amazon reporting impact
Guidance Focus: AI spending, cloud growth, consumer demand trends
Holiday Impact Calendar
Labor Day (Sep 2): US markets closed
Columbus Day (Oct 14): Bond markets closed, equities open
Thanksgiving (Nov 27-28): Shortened trading sessions
Christmas/New Year: Year-end positioning effects
Conclusion and Strategic Outlook
The NASDAQ-100 stands at a critical inflection point, benefiting from Fed Chair Powell's dovish pivot while facing elevated valuation concerns and seasonal headwinds. The technical picture presents a compelling consolidation pattern with multiple breakout scenarios, requiring careful risk management and tactical positioning.
Key Investment Themes for September:
1. Fed Policy Pivot: Rate cut cycle beginning supports risk assets and growth stocks
2. AI Revolution Continuation: Technology leadership themes remain intact
3. Triangle Resolution: Current consolidation pattern approaching decision point
4. Seasonal Navigation: September weakness vs. Fed optimism dynamic
Tactical Trading Priorities:
Range Trading: Capitalize on 23,300-23,650 range until breakout
Breakout Preparation: Position for triangle resolution with volume confirmation
Risk Management: Elevated levels require disciplined position sizing
Sector Selection: Focus on AI beneficiaries and Fed-sensitive growth names
Medium-Term Outlook (1-3 Months):
The combination of Fed policy accommodation, robust AI/technology themes, and strong corporate fundamentals provides a constructive backdrop for NASDAQ advancement. Technical analysis suggests potential for significant upside toward 24,500-25,000 on successful breakout, though any hawkish Fed surprise or geopolitical shock could trigger sharp corrections.
Risk Scenario Analysis:
Bull Case: Fed cuts + AI momentum = targets 25,000-26,000
Base Case: Consolidation 23,000-24,000 through October
Bear Case: Fed disappointment + valuation concerns = correction to 21,500-22,000
Strategic Positioning Recommendations:
1. Maintain tactical long bias with disciplined risk management
2. Focus on high-quality technology leaders with AI exposure
3. Prepare for increased volatility around Fed meetings and earnings
4. Monitor triangle pattern resolution for significant directional moves
The multi-timeframe technical analysis framework presented provides robust tools for navigating the current market environment. Success will depend on maintaining discipline around the identified support/resistance levels while adapting to the evolving Fed policy landscape and technology sector dynamics.
Traders should remain flexible and prepared for both continuation and reversal scenarios, with particular attention to volume confirmation on any major breakout attempts. The convergence of technical patterns, fundamental catalysts, and seasonal factors creates a complex but opportunity-rich environment for skilled practitioners.
---
*This comprehensive analysis integrates multiple technical methodologies with current market fundamentals. All trading recommendations should be implemented within individual risk tolerance parameters and adapted to evolving market conditions. The technology-focused nature of the NASDAQ requires particular attention to sector-specific developments and regulatory considerations.*
---
For individuals seeking to enhance their trading abilities based on the analyses provided, I recommend exploring the mentoring program offered by Shunya Trade. (Website: shunya dot trade)
I would appreciate your feedback on this analysis, as it will serve as a valuable resource for future endeavors.
Sincerely,
Shunya.Trade
Website: shunya dot trade
---
Disclaimer: This post is intended solely for educational purposes and does not constitute investment advice, financial advice, or trading recommendations. The views expressed herein are derived from technical analysis and are shared for informational purposes only. The stock market inherently carries risks, including the potential for capital loss. Therefore, readers are strongly advised to exercise prudent judgment before making any investment decisions. We assume no liability for any actions taken based on this content. For personalized guidance, it is recommended to consult a certified financial advisor.
BTC – Fakeout Before the Big Breakout!Bitcoin has been repeating a familiar pattern:
- Fakeouts below key support zones, trapping early sellers.
- Breakouts back above structure, followed by strong impulsive moves.
We’ve already seen this sequence twice in the past months, and BTC might be setting up for it once again. Price faked out below support, reclaimed it, and is now eyeing a breakout from the falling channel.
🔁If history rhymes, the next leg could trigger a powerful impulse toward new highs. Traders should keep an eye on the $112,000–$114,000 zone — a breakout from here could be the spark for the next rally.
Is BTC about to repeat its playbook? 👀
📚 Always follow your trading plan regarding entry, risk management, and trade management.
Good luck!
All Strategies Are Good; If Managed Properly!
~Richard Nasr

Is Gold Losing Its Luster or Preparing to Shine Again?XAUUSD has been respecting a broad ascending channel for months, with clear touches on both resistance and support levels. Recently, however, price slipped into a smaller bearish channel inside the larger structure.
📉 The short-term bias remains bearish as long as price trades within the red channel.
📊 Key support lies near the $3,280 zone — a critical level where bulls might attempt to step in.
💡 A breakout from the bearish channel could open the way for another retest of the upper resistance zone, while failure to hold support may trigger deeper corrections.
📚 Always follow your trading plan regarding entry, risk management, and trade management.
Good luck!
All Strategies Are Good; If Managed Properly!
~Rich
Disclosure: I am part of Trade Nation's Influencer program and receive a monthly fee for using their TradingView charts in my analysis.

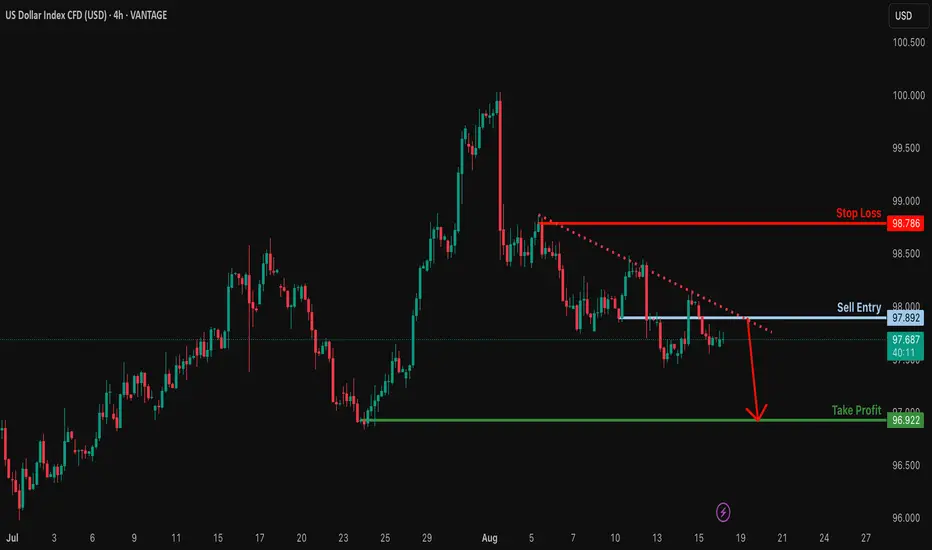
USDOLLAR H4 | Bearish reversal off 50% Fibonacci resistanceBased on the H4 chart analysis, we could see the price rise to the sell entry, which is an overlap resistance that aligns with the 50% Fibonacci retracement and could reverse from this level to the take profit.
Sell entry is at 12,738.37, which is an overlap resistance that lines up with the 50% Fibonacci retracement.
Stop loss is at 12,786.05, which is a pullback resistance that is slightly below the 78.6% Fibonacci retracement.
Take profit is at 12,682.74, which is a pullback support.
High Risk Investment Warning
Trading Forex/CFDs on margin carries a high level of risk and may not be suitable for all investors. Leverage can work against you.
Stratos Markets Limited (tradu.com ):
CFDs are complex instruments and come with a high risk of losing money rapidly due to leverage. 65% of retail investor accounts lose money when trading CFDs with this provider. You should consider whether you understand how CFDs work and whether you can afford to take the high risk of losing your money.
Stratos Europe Ltd (tradu.com ):
CFDs are complex instruments and come with a high risk of losing money rapidly due to leverage. 66% of retail investor accounts lose money when trading CFDs with this provider. You should consider whether you understand how CFDs work and whether you can afford to take the high risk of losing your money.
Stratos Global LLC (tradu.com ):
Losses can exceed deposits.
Please be advised that the information presented on TradingView is provided to Tradu (‘Company’, ‘we’) by a third-party provider (‘TFA Global Pte Ltd’). Please be reminded that you are solely responsible for the trading decisions on your account. There is a very high degree of risk involved in trading. Any information and/or content is intended entirely for research, educational and informational purposes only and does not constitute investment or consultation advice or investment strategy. The information is not tailored to the investment needs of any specific person and therefore does not involve a consideration of any of the investment objectives, financial situation or needs of any viewer that may receive it. Kindly also note that past performance is not a reliable indicator of future results. Actual results may differ materially from those anticipated in forward-looking or past performance statements. We assume no liability as to the accuracy or completeness of any of the information and/or content provided herein and the Company cannot be held responsible for any omission, mistake nor for any loss or damage including without limitation to any loss of profit which may arise from reliance on any information supplied by TFA Global Pte Ltd.
The speaker(s) is neither an employee, agent nor representative of Tradu and is therefore acting independently. The opinions given are their own, constitute general market commentary, and do not constitute the opinion or advice of Tradu or any form of personal or investment advice. Tradu neither endorses nor guarantees offerings of third-party speakers, nor is Tradu responsible for the content, veracity or opinions of third-party speakers, presenters or participants.
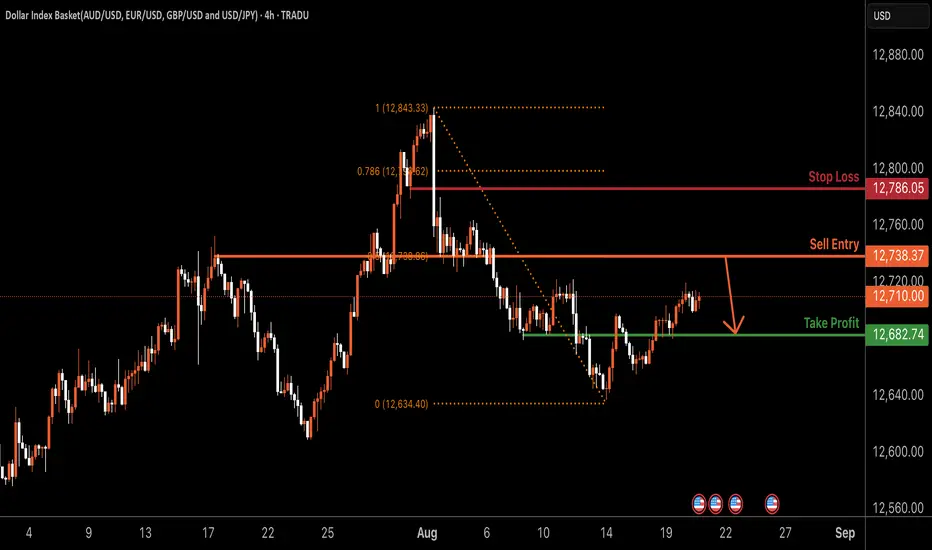
Bearish drop?US Dollar Index (DXY) is reacting off the pivot, which acts as an overlap resistance and could drop to the 1st support.
Pivot: 98.27
1st Support: 94.66
1st Support: 94.66Risk Warning:
Trading Forex and CFDs carries a high level of risk to your capital and you should only trade with money you can afford to lose. Trading Forex and CFDs may not be suitable for all investors, so please ensure that you fully understand the risks involved and seek independent advice if necessary.
Disclaimer:
The above opinions given constitute general market commentary, and do not constitute the opinion or advice of IC Markets or any form of personal or investment advice.
Any opinions, news, research, analyses, prices, other information, or links to third-party sites contained on this website are provided on an "as-is" basis, are intended only to be informative, is not an advice nor a recommendation, nor research, or a record of our trading prices, or an offer of, or solicitation for a transaction in any financial instrument and thus should not be treated as such. The information provided does not involve any specific investment objectives, financial situation and needs of any specific person who may receive it. Please be aware, that past performance is not a reliable indicator of future performance and/or results. Past Performance or Forward-looking scenarios based upon the reasonable beliefs of the third-party provider are not a guarantee of future performance. Actual results may differ materially from those anticipated in forward-looking or past performance statements. IC Markets makes no representation or warranty and assumes no liability as to the accuracy or completeness of the information provided, nor any loss arising from any investment based on a recommendation, forecast or any information supplied by any third-party.

Potential bearish drop?USDX is rising towards the resistance, which is a pullback resistance, and could drop from this level to our take-profit.
Entry: 97.89
Why we like it:
There is a pullback resistance.
Stop loss: 98.78
Why we like it:
There is a pullback resistance.
Take profit: 97.92
Why we like it:
There is a swing low support.
Enjoying your TradingView experience? Review us!
Please be advised that the information presented on TradingView is provided to Vantage (‘Vantage Global Limited’, ‘we’) by a third-party provider (‘Everest Fortune Group’). Please be reminded that you are solely responsible for the trading decisions on your account. There is a very high degree of risk involved in trading. Any information and/or content is intended entirely for research, educational and informational purposes only and does not constitute investment or consultation advice or investment strategy. The information is not tailored to the investment needs of any specific person and therefore does not involve a consideration of any of the investment objectives, financial situation or needs of any viewer that may receive it. Kindly also note that past performance is not a reliable indicator of future results. Actual results may differ materially from those anticipated in forward-looking or past performance statements. We assume no liability as to the accuracy or completeness of any of the information and/or content provided herein and the Company cannot be held responsible for any omission, mistake nor for any loss or damage including without limitation to any loss of profit which may arise from reliance on any information supplied by Everest Fortune Group.