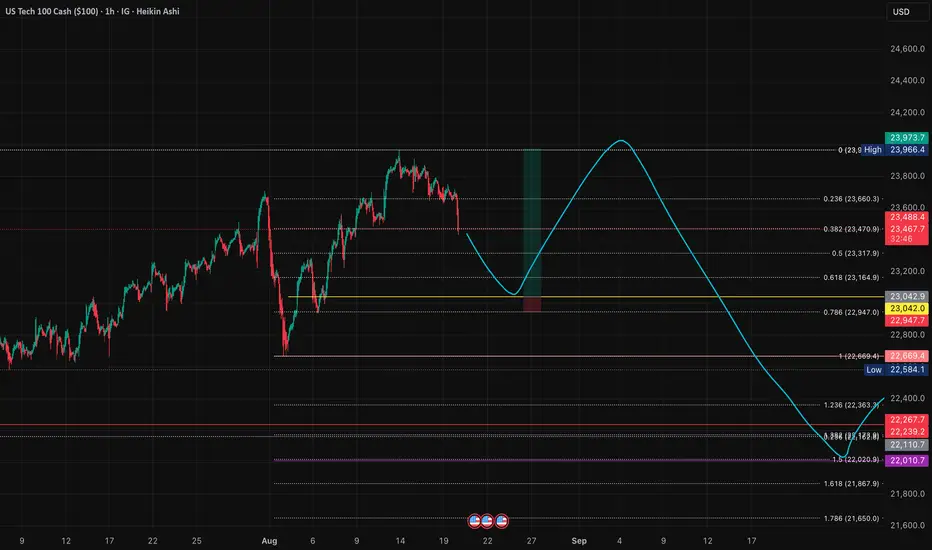
NAS100 Overextended: Support or Further Downside Ahead?The NAS100 is currently overextended following Friday’s strong rally. From a technical perspective, I’m anticipating a potential retracement toward equilibrium, aligning with the 50% Fibonacci level of the prior price swing. This zone will be key in determining whether price establishes support and resumes its bullish continuation, or if a breakdown occurs that could signal further downside risk. (Not financial advice.)
Us100

NASDAQ Can this 1D MA50 rebound be sustainable?Nasdaq (NDX) has been trading within a Channel Up since May 12 and last week made a double rebound very close to its 1D MA50 (blue trend-line). That is technically the latest Higher Low of the pattern and as long as it holds, we should see the new Bullish Leg.
The last two major ones rose by roughly +10% each. Given that the 1D RSI also made a Double Bottom on its Support, we remain bullish on Nasdaq, targeting 24800.
-------------------------------------------------------------------------------
** Please LIKE 👍, FOLLOW ✅, SHARE 🙌 and COMMENT ✍ if you enjoy this idea! Also share your ideas and charts in the comments section below! This is best way to keep it relevant, support us, keep the content here free and allow the idea to reach as many people as possible. **
-------------------------------------------------------------------------------
Disclosure: I am part of Trade Nation's Influencer program and receive a monthly fee for using their TradingView charts in my analysis.
💸💸💸💸💸💸
👇 👇 👇 👇 👇 👇

NAS100 - Where will the stock market ?!The index is above the EMA200 and EMA50 on the four-hour timeframe and has re-entered its ascending channel. If this channel is maintained, its upward path to the specified price target will be possible, but before that, the downward trend line must be broken in a valid way. If the channel is lost, the index's downward path will continue to around 23,000 points.
Federal Reserve Chair Jerome Powell’s latest remarks, delivered in a dovish tone, boosted bullish sentiment in financial markets and sparked a new wave of optimism among Wall Street investors and market participants. Following Powell’s speech, U.S. stock benchmarks surged sharply, with capital flows notably directed into the Russell 2000 index of small-cap companies, which jumped 3.86%—its strongest gain since April 9.
During his keynote at the Federal Reserve’s annual symposium, Powell implicitly suggested that an interest rate cut could come as soon as next month. At the same time, he warned of rising inflation risks and signs of slower economic growth, stressing that although risks are relatively balanced, the current environment may require an adjustment in monetary policy. He stated: “Given that monetary policy remains in a restrictive stance, the baseline outlook and the shifting balance of risks may warrant a reassessment of our policy stance.”
Naeem Aslam, chief investment strategist at Zaye Capital Markets, described Powell’s comments as a turning point for markets, saying: “Powell’s dovish tone came as a real surprise to many market participants who did not expect such an approach from the Fed Chair. His remarks were clearly interpreted as a dovish signal.”
Following Powell’s comments, traders raised their expectations for a September rate cut. Barclays revised its forecast and now expects the Federal Reserve to deliver two 25-basis-point cuts this year—in September and December.
Meanwhile, Fitch Ratings affirmed the U.S. sovereign credit rating at AA+ with a stable outlook, a decision made despite significant political uncertainty. According to Fitch, rising trade tariffs, government spending cuts, stricter border controls, and increased deportations have heightened policy uncertainty, weighing on household consumption and business investment.
Fitch projects that the U.S. economy will remain in recession in 2026, growing only 1.5%, as elevated inflation and policy uncertainty continue to dampen consumer spending. However, the agency expects that faster rate cuts that year could boost domestic demand, helping growth rebound to 2.1% in 2027.
This week, two key reports are in focus: the second estimate of Q2 GDP and July’s Personal Consumption Expenditures (PCE) Price Index. The initial GDP estimate showed a 3% expansion, and consensus forecasts anticipate confirmation of this figure. In contrast, the Atlanta Fed’s GDPNow model projects a 2.3% growth rate, which, while lower, still points to economic resilience and suggests no urgent need for accelerated rate cuts—even as political pressure from the White House on Powell continues. Notably, GDPNow will be revised on Tuesday ahead of the official release.
Inflation data, however, carry greater weight. The core PCE index, the Fed’s preferred inflation gauge, has closely tracked core CPI for the past decade. With July’s core CPI climbing from 2.9% to 3.1%, there is a risk that PCE will follow the same path. Such a scenario would signal persistent inflationary pressures and significantly reduce the likelihood of a second rate cut this year.
If these data confirm stronger inflation, the U.S. dollar will likely strengthen further, while equities could come under additional pressure. A slower pace of monetary easing diminishes the present value of future cash flows for growth-oriented companies, explaining why Wall Street’s corrective phase may persist.
On the corporate front, Nvidia’s CEO said that the ability to ship its H20 chip to China is highly valuable and poses no national security concerns. He added that the decision to supply a next-generation AI data center chip to China, which will succeed the H20, is not within Nvidia’s direct control. The company is set to report earnings on Wednesday and remains in discussions with the U.S. government, though no resolution has yet been reached. The CEO also mentioned that his brief visit to Taiwan would mainly involve a dinner with TSMC executives. He revealed TSMC’s new “Rubin” architecture, comprising six new chips, and announced that Nvidia will hold its GTC conference in Washington, D.C. for the first time.
Separately, Meta has halted AI hiring after onboarding more than 50 specialists with lucrative compensation packages. The freeze affects both new hires and internal transfers, unless personally approved by Alexander Wang, head of AI. In recent months, Meta has reorganized its AI division into four separate teams to advance its “superintelligence” projects. Analysts have warned about rising costs and equity grants, framing the hiring pause as part of broader budget control and organizational restructuring efforts.

NASDAQ Technicals
NASDAQ (NAS100) Technical Analysis
Based on the 4 hour chart, NASDAQ (NAS100) is currently showing range bound price action, indicating a period of consolidation after a recent downtrend. This price behavior suggests a tug of war between bulls and bears, with neither side able to decisively break through key support or resistance levels.
Key Levels and Price Zones
The market is trading within a defined range. The key support zone is identified around 23,055 to 22,958. This is a critical area, as a clean break below it would signal a continuation of the previous bearish trend. The primary resistance zone is located between 23,309 and 23,418. This zone must be broken and held for a potential bullish reversal to be considered.
Bullish and Bearish Scenarios
* Bullish Scenario: For a bullish trend to resume, the price needs to break above the 23,418 resistance level. A confirmed breakout with a subsequent retest of this level as support could open the door for a move towards the higher resistance at 23,736. Traders should watch for a strong bullish candle closing above this zone and an increase in buying volume to confirm the breakout.
* Bearish Scenario: The bearish outlook remains intact as long as the price stays below the resistance zone. A break below the support zone around 22,958 would be a significant bearish signal. This could lead to a further drop toward the lower range's support at 22,690. A strong bearish candle closing below the support zone would provide confirmation.
Risk Management and Final Thoughts
Given the current consolidation, traders should be cautious about initiating new positions without clear confirmation. The most prudent approach is to wait for a definitive breakout above resistance or a breakdown below support. Trading within the range can be highly volatile and is generally considered higher risk. Placing stop loss orders outside of the key support and resistance zones is crucial to manage potential risks effectively. The current technical screenshot of NAS100 is one of indecision, and a significant move is likely on the horizon once one of the boundaries is breached.

US100 Bearish Breakout!
HI,Traders !
#US100 made a bearish
Breakout of the key horizontal
Level around 23711.6 and the
Breakout is confirmed so we
Will be expecting a further
Bearish move down !
Comment and subscribe to help us grow !

UK100 - potential head and shoulders on 1 hour chartWatching the UK100 for a potential short entry.
A head and shoulders pattern appears to be forming on the 1-hour chart. All my entry variables are currently met, but I’m holding off for now.
The UK100 will close in the next hour or two, and I prefer not to open a large position overnight due to potential slippage from market gaps. I’ll wait until tomorrow to see if my conditions are still valid before entering.
Trade Details:
📊 Risk/Reward: 3.5
🎯 Entry: 9 174.7
🛑 Stop Loss: 9 204.9
💰 Take Profit 1 (50%): 9 090.8
💰 Take Profit 2 (50%): 9 042.2
#GTradingMethod Tip: Always consider market timing and overnight risk when entering trades.
Thanks for checking out my post! Make sure to follow me to catch the next update. If you found this helpful, give it a like 👍 and share your thoughts 💬 — I’d love to hear what you think!
Please note: This is not financial advice. This content is to track my trading journey and for educational purposes only.

NASDAQ: 10:1 R/R Setup - One More High Before Major CorrectionSharing my current outlook on NASDAQ with a high-probability setup offering exceptional risk-reward. 📊
**🎯 The Setup:**
I'm expecting one more push to new all-time highs from the yellow line around 23,000. This would offer a **10:1 risk-to-reward ratio** with the stop loss just below the recent low. 🚀
**📍 Yellow Line Logic:**
This level represents my experience-based zone just shy of the 0.786 Fibonacci retracement. I've observed that when price reaches the 0.786 level, it tends to result in a complete reversal more often than not. This yellow line sits in that "sweet spot" where buyers typically step in. 🎯
**📈 Chart Structure Support:**
The overall chart pattern suggests a higher probability of making new highs rather than a complete reversal from current levels. The structure is bullish despite the recent pullback. ✅
**🔄 Bigger Picture Scenario:**
After the anticipated new high, I expect a significant retracement back toward the previous high (red line area). However, this would likely be just a healthy correction before the bull run resumes for the remainder of the year. 📉➡️📈
**🧠 Key Insight:**
Sometimes the best trades come when the market gives you that "one more push" setup. The risk is small relative to the potential reward, making this a compelling opportunity if the setup materializes. 💡
📈 **This trade setup offers a risk-to-reward ratio of 10:1.** Without including fees, the breakeven win rate for this trade would be approximately 9.09%. Knowing these figures in advance helps me avoid emotional trading. 🧠
💡 **Pro Tip**: If you often find yourself trading based on emotions, I recommend doing this type of pre-planning and quantifying your setups before execution — it can be a simple yet highly effective improvement. ✅
---
**Trading is simple.** You don't need multiple indicators or dozens of lines on your chart. A clean and simple chart often works best — it keeps your decisions consistent and reduces uncertainty. Sure, it might not look flashy, and my analysis may seem a bit "plain" compared to others… but that's how I like it. If you find this analysis useful, feel free to follow me for more updates.
---
*Disclaimer: This post is for general informational and educational purposes only. It does not constitute financial advice, investment recommendation, or a service targeting specific investors, and should not be considered illegal or restricted information in any jurisdiction.*
Bearish drop?US100 is rising towards the resistance level, which is a pullback resistance, and could drop from this level to our take profit.
Entry: 23,546.52
Why we like it:
There is a pullback resistance.
Stop loss: 23,936.40
Why we like it:
There is a swing high resistance.
Take profit: 22,986.60
Why we like it:
There is a pullback support that lines up with the 78.6% Fibonacci retracement.
Enjoying your TradingView experience? Review us!
Please be advised that the information presented on TradingView is provided to Vantage (‘Vantage Global Limited’, ‘we’) by a third-party provider (‘Everest Fortune Group’). Please be reminded that you are solely responsible for the trading decisions on your account. There is a very high degree of risk involved in trading. Any information and/or content is intended entirely for research, educational and informational purposes only and does not constitute investment or consultation advice or investment strategy. The information is not tailored to the investment needs of any specific person and therefore does not involve a consideration of any of the investment objectives, financial situation or needs of any viewer that may receive it. Kindly also note that past performance is not a reliable indicator of future results. Actual results may differ materially from those anticipated in forward-looking or past performance statements. We assume no liability as to the accuracy or completeness of any of the information and/or content provided herein and the Company cannot be held responsible for any omission, mistake nor for any loss or damage including without limitation to any loss of profit which may arise from reliance on any information supplied by Everest Fortune Group.

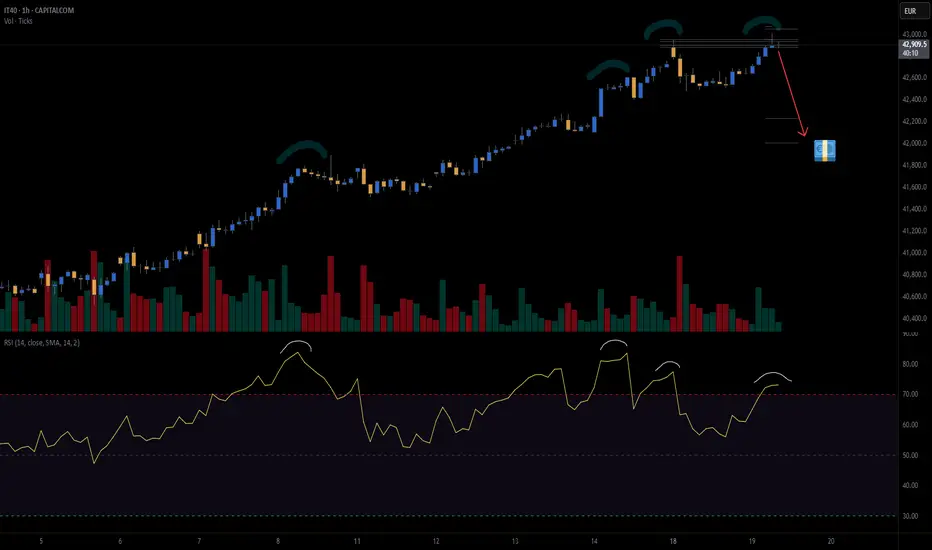
IT40index (IT40CASH) - potential double top on 1 hour chartAll my variables lined up for entry.
Before I enter any trade, I predefine and fully accept my risk. That way, if the trade is a loser, there’s no emotional pain—just probability playing out. Over the long run, my edge means more wins than losses.
Key Details
📊 Risk/Reward: 4.6
🎯 Entry: 42 910
🛑 Stop Loss: 43 072.4
💰 Take Profit 1 (50%): 42 230
💰 Take Profit 2 (50%): 42 012
Stop loss is set. Now it’s time to sit on my hands and let the market do its thing.
💡 #GTradingMethod Tip: The hardest part of trading is often doing nothing. Trust your process, not your emotions.
Thanks for checking out my post! Make sure to follow me to catch the next update. If you found this helpful, give it a like 👍 and share your thoughts 💬 — I’d love to hear what you think!
Please note: This is not financial advice. This content is to track my trading journey and for educational purposes only.
Nasdaq100, DJIA & S&P500 - Quick technical analysisThe top three US indices are near their all-time highs. Will we see new all-time highs?
Let's take a look.
MARKETSCOM:US100
MARKETSCOM:US30
MARKETSCOM:US500
Let us know what you think in the comments below.
Thank you.
75.2% of retail investor accounts lose money when trading CFDs with this provider. You should consider whether you understand how CFDs work and whether you can afford to take the high risk of losing your money. Past performance is not necessarily indicative of future results. The value of investments may fall as well as rise and the investor may not get back the amount initially invested. This content is not intended for nor applicable to residents of the UK. Cryptocurrency CFDs and spread bets are restricted in the UK for all retail clients.

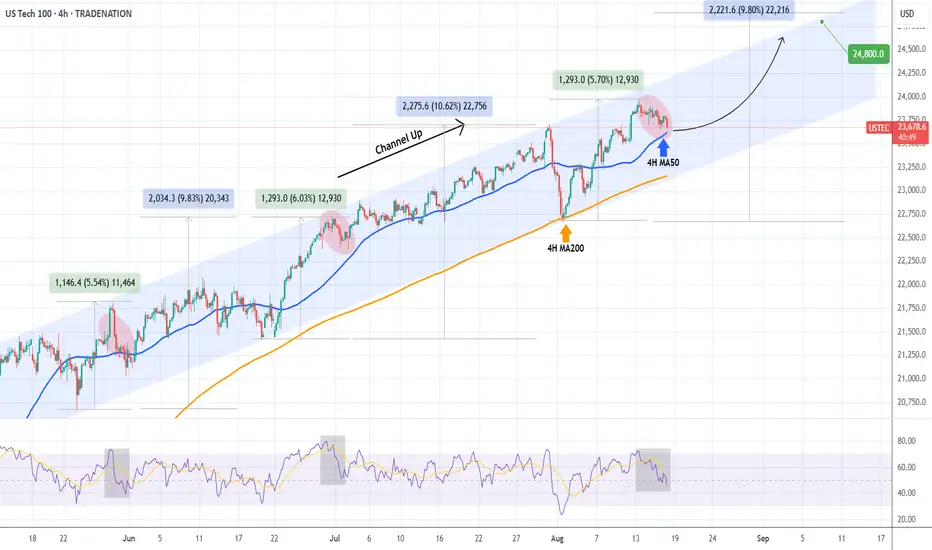
NASDAQ testing its 4H MA50. Will it offer Support?Nasdaq (NDX) has been trading within a Channel Up since May 11 and is approaching its 4H MA50 (blue trend-line) today following a Wednesday initiated pull-back.
Technically this is so far a normal correction for this pattern, which offers a short-term buy signal as the 3 times during those 4 months that it broke convincingly, it rebounded on or close to the 4H MA200 (orange trend-line).
As a result, if the 4H MA50 offers a rebound, we could see a +9.80% rebound from the 4H MA200, the minimum that this Channel Up has delivered upon a Bullish Leg. That gives a Target of 24800.
-------------------------------------------------------------------------------
** Please LIKE 👍, FOLLOW ✅, SHARE 🙌 and COMMENT ✍ if you enjoy this idea! Also share your ideas and charts in the comments section below! This is best way to keep it relevant, support us, keep the content here free and allow the idea to reach as many people as possible. **
-------------------------------------------------------------------------------
Disclosure: I am part of Trade Nation's Influencer program and receive a monthly fee for using their TradingView charts in my analysis.
💸💸💸💸💸💸
👇 👇 👇 👇 👇 👇
NAS100 3 Drive Pattern Correction Wait For BoS📊 The NAS100 has pulled back after a strong bullish run and is currently facing some pressure 📉. I’m watching a three-drive pattern that appears to have extended into a fourth drive, followed by a corrective phase 🔄. From a smart money perspective, liquidity is often targeted after a strong expansion in trend — patterns like the three-drive can frequently lead to a deeper retracement before the continuation resumes. With that in mind, I’m anticipating the possibility of a further pullback before positioning for a potential long setup on a bullish break of structure 🚀 (not financial advice).

NAS100 - Stock Market Waiting for Jackson Hole Leak!The index is above the EMA200 and EMA50 on the 4-hour timeframe and is trading in its ascending channel. If the index corrects downwards towards the specified demand zones, you can buy Nasdaq with appropriate reward and risk.
According to a recent report from JPMorgan, the new U.S. tariffs could have significant repercussions for the American economy. The bank projects that these tariffs may reduce U.S. GDP by as much as 1% while simultaneously pushing inflation higher by up to 1.5%.
This year’s tariff hikes represent the largest increase since World War II, with the effective tariff rate rising to nearly 18%. With the expiration of tariff exemptions on imports under $800, consumer goods prices are expected to climb further.
JPMorgan has warned that both consumers and businesses may struggle to absorb these additional costs, raising the risk of stagflation. Meanwhile, monthly inflation has remained within the 0.3% to 0.5% range, suggesting that the Fed’s preferred inflation gauge could rise toward 3% to 3.5%.
As U.S. tariffs have surged to their highest levels in decades, revenues from these duties hit a record $28 billion in July. According to estimates by the Tax Foundation, tariff revenues could total about $2.2 trillion by the end of this decade. However, this is also expected to trim GDP by around 0.9%.
Research conducted by Yale University indicates that tariff policies could reduce annual household income by approximately $2,400, since part of these tariff costs are passed on to consumers by companies.
At the same time, Berkshire Hathaway, led by Warren Buffett, has made notable adjustments to its investment portfolio:
• It purchased 6.6 million shares of steelmaker Nucor.
• It added 5 million shares of healthcare insurer UnitedHealth.
• It fully divested its holdings in T-Mobile US.
• It trimmed its stake in Apple by 6.7%, reducing its position to 280 million shares.
Meanwhile, Goldman Sachs reiterated its outlook that the Federal Reserve will cut interest rates three times before the end of 2025. The projected reductions include three 25-basis-point cuts in September, October, and December. Additionally, two further cuts are expected in 2026, bringing the terminal rate down to the 3%–3.25% range. Markets have already increased their bets on a September rate cut. Recent weakness in inflation and employment data has paved the way for such accommodative policy measures.
Federal Reserve Chair Jerome Powell is scheduled to deliver a speech at the Jackson Hole Symposium on August 22, 2025—an event that has become an unofficial policy-setting platform. Analysts at Morgan Stanley expect Powell will attempt to temper market expectations for a 50-basis-point cut in September. Given the political pressures and mixed economic signals, Powell may only endorse a 25-basis-point cut, or potentially push back against easing altogether.
Any of these outcomes could disappoint markets, especially if Powell fails to deliver clear guidance. His speech may therefore play a decisive role in shaping U.S. monetary policy for the remainder of the year and could drive heightened volatility across markets.
Although this week’s economic calendar features several important housing and manufacturing reports, the spotlight will remain firmly on the Fed. On Tuesday, July housing starts and building permits data will be released. Wednesday brings the FOMC’s July meeting minutes, speeches from key Fed officials Waller and Bostic, and the official kickoff of the annual Jackson Hole Symposium.
On Thursday, markets will digest a packed set of data, including the Philadelphia Fed manufacturing index, weekly jobless claims, the preliminary August S&P Global PMI, and July existing home sales.
The highlight of the week will be Friday, when all eyes turn to Jerome Powell. His annual Jackson Hole speech is expected to provide fresh clues about the Fed’s policy trajectory—guidance that could strongly influence market direction in the weeks ahead.

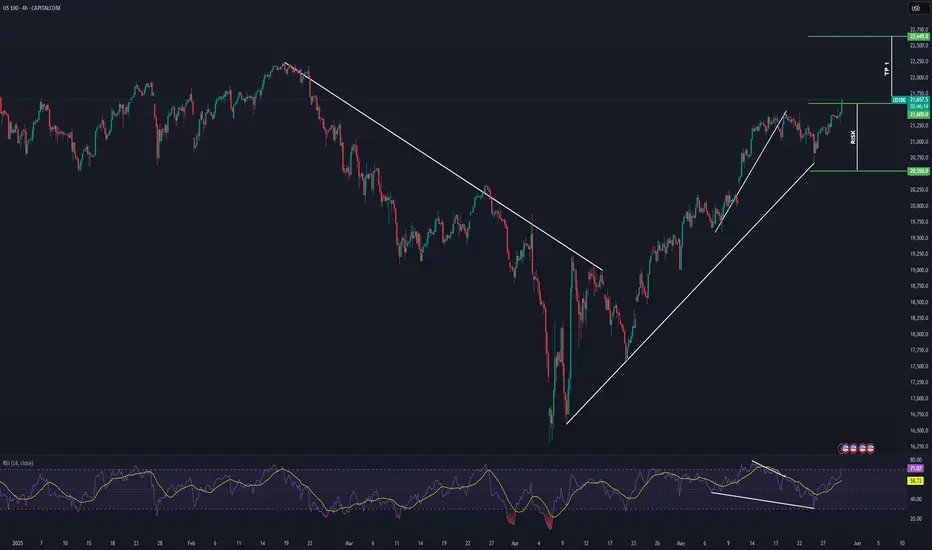
NASDAQ After the Fireworks: Bearish Setup LoadedAfter the classic 4th of July rally, I stepped in on the short side of Nasdaq, targeting 22,000 and 21,400 zones. The market structure shows exhaustion, and with the cloud retest failing to hold new highs, I positioned accordingly.
Technical:
• Price stalled at prior expansion highs with tight compression near 23,000.
• Daily FibCloud offered resistance confirmation.
• Bearish risk-reward skew forms after extended rally and thin retraces.
• Volume divergence spotted.
Fundamentals:
Multiple overlapping uncertainties:
• Trump confirmed tariffs will take effect on August 1, threatening a 10% surcharge on BRICS-aligned nations.
• Treasury Secretary Bessent anticipates several trade deal announcements within 48h—but stresses quality over quantity.
• Bank of America maintains its base case of 0 rate cuts in 2025, citing strong economic data and sticky inflation risks.
The combination of tariff escalation, hawkish monetary expectations, and global trade friction creates a perfect backdrop for volatility and correction—especially in overextended tech indices like the Nasdaq.
Note: Please remember to adjust this trade idea according to your individual trading conditions, including position size, broker-specific price variations, and any relevant external factors. Every trader’s situation is unique, so it’s crucial to tailor your approach to your own risk tolerance and market environment.

US100: Bullish Continuation & Long Trade
US100
- Classic bullish setup
- Our team expects bullish continuation
SUGGESTED TRADE:
Swing Trade
Long US100
Entry Point - 23703
Stop Loss - 23669
Take Profit - 23777
Our Risk - 1%
Start protection of your profits from lower levels
Disclosure: I am part of Trade Nation's Influencer program and receive a monthly fee for using their TradingView charts in my analysis.
❤️ Please, support our work with like & comment! ❤️

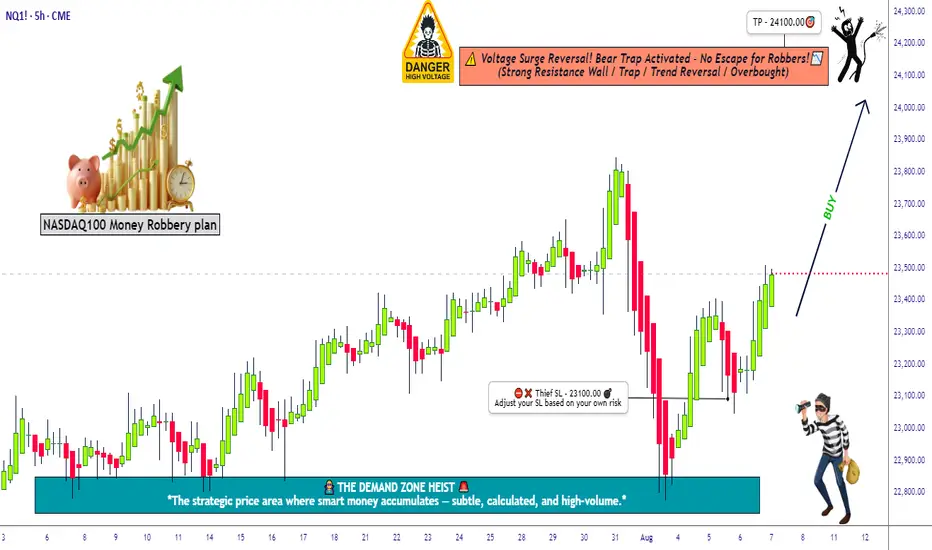
Robbing the Nasdaq Futures | NQ1! Plan with Precise Targets💥🚨NQ1! “E-Mini Nasdaq 100” Heist Alert 🚨💥
🎯Thief Trader Bullish Takeover Plan🕵️♂️📈
🌍 Dear Global Looters & Market Bandits, 💰💸💎
It's time to crack the vaults of the Nasdaq 100 Futures (NQ1!) — Thief-style! No mercy. No fear. Just profits. 🔥
🔓 The digital vault is open — we’re layering multiple limit orders like pros to snatch the tech treasure chest. This isn’t just a trade…
👉 This is an organized robbery of Wall Street’s most elite index. 🏦🕶️
💎 Entry Point = Anywhere on the Grid!
Set your buy limit orders at juicy dips — 15m / 30m / 1H zones, support bounces, or wherever the chart whispers "steal me." 🎧📉
⏰ Stay alert — we don’t chase, we trap. 🐍
🛑 Stop Loss = 23100.00
Set it & forget it below key swing low.
You’re not in this heist to bleed. Risk small. Layer tight. Protect the stash. 🛡️💼
🎯Target = 24100.00
That’s the exit zone before the feds (aka market makers) catch on.
Be smart — take profit early if the heat gets real. 🚓🚨
🧠Strategy Mode: Layering Limit Orders
Thief never enters with one shot. We layer in like ghosts — scaling into value zones, controlling the risk, and building power before liftoff. 🚀📊
This ain’t gambling — it’s structured robbery with exit plans. 🎯💼
🧲 Scalpers & Swingers Welcome!
⚔️ Got big capital? Smash the levels and ride the breakout.
💼 Small cap thief? Ride with the swing crew — safer, smoother, more stealthy.
📍Always use Trailing SL — never let the market take back what you stole. 💰
📰 Market Sentiment: Bullish Bias 😈
AI hype. Earnings season. Rate cuts. You name it — it’s all fueling the Nasdaq rocket.
We’re riding momentum, not hope. This ain’t luck — it’s Thief precision execution.
🔔 Pro Thief Tips:
⚠️ Avoid entries during high-impact news.
🚀 Use alerts. Monitor VIX + QQQ.
💻 Watch for liquidity zones & trap setups.
🚀💣 Smash that 🔥Boost Button🔥 if you love robbing the market like a pro!
Help grow the Thief Trading Crew — one like = one stolen candle from the whales. 💵🦈
We rob institutions, not each other. 💯🤝
Stay locked in — next heist plan coming soon. 📡📈
#NQ1 #Nasdaq100 #EminiFutures #ThiefTrader #RobTheMarket #LayeringStrategy #SmartMoneyMoves #BullishPlan #WallStreetHeist #TradingViewSetup
NASDAQ Potential Bullish ContinuationNASDAQ price action seems to exhibit signs of potential Bullish momentum as the price action may form a credible Higher High (after tarriff delays on the EU) with multiple confluences through key Fibonacci and Support levels which presents us with a potential long opportunity.
Trade Plan:
Entry : 21600
Stop Loss : 20550
TP 1: 22649
US30 - potential head and shoulders on 30min chartWatching the US30Cash for a potential short setup.
A head and shoulders pattern may be forming on the 30-minute timeframe. I’m still waiting for confirmation on some key variables before entering the trade.
Trade Details:
📊 Risk/Reward: 2.7
🎯 Entry: 45 224
🛑 Stop Loss: 45 261
💰 Take Profit 1 (50%): 45 141
💰 Take Profit 2 (50%): 45 084
Thanks for checking out my post! Make sure to follow me to catch the next update. If you found this helpful, give it a like 👍 and share your thoughts 💬 — I’d love to hear what you think!
Please note: This is not financial advice. This content is to track my trading journey and for educational purposes only.

NAS100 – Potential Short Setup After Sharp RallyOn the 5-minute chart, NAS100 has made a strong upward move following a sharp drop earlier in the session.
Price is now approaching a potential exhaustion point near 23,940–23,960. I expect a reversal from this zone, followed by a move back toward 23,725 and possibly lower.
Trade Plan:
Sell Entry: 23,940–23,960 zone after confirmation
Stop-Loss: Above 23,960
Take-Profit: 23,725 initial target; further downside possible if momentum continues
Notes:
Watch for reversal candlestick patterns or break of short-term structure before entering.
This setup is based on intraday momentum and may require fast execution.

S&P500 INDEX (US500): Bullish Rally Continues
S&P500 is going to continue rising at least to 6500 level.
A confirmed break of structure BoS on a daily indicates
a clear dominance of the buyers.
With the absence of high impact US news today, the market will
remain strongly bullish.
❤️Please, support my work with like, thank you!❤️

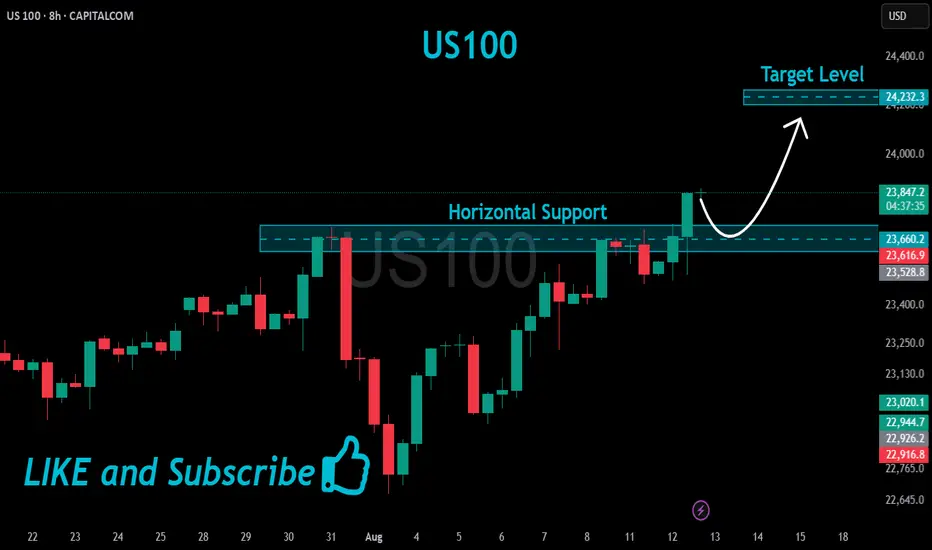
US100 Bullish Breakout!
HI,Traders !
#US100 is trading in a strong
Uptrend and the price made a
Bullish breakout of the key
Horizontal level of 23660.2
So we are bullish biased
And we will be expecting a
Further bullish move up !
Comment and subscribe to help us grow !
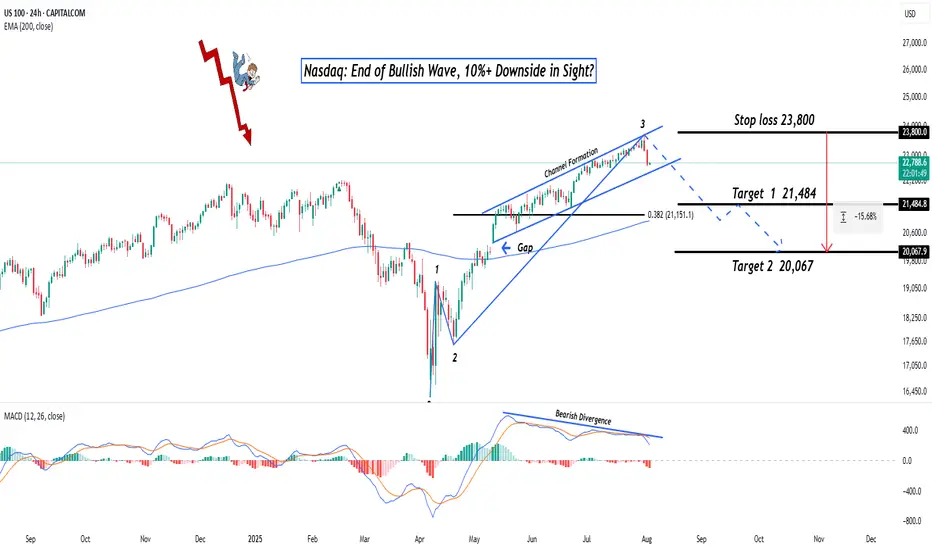
Nasdaq: End of Bullish Wave, 10%+ Downside in Sight?Hey Realistic Traders!
Has CAPITALCOM:US100 (Nasdaq) Finally Peaked? A Reversal Signal Just Flashed. Is This the Turning Point Toward a Deeper Pullback?
Let’s dive into the technicals to see what the chart is really telling us.
Technical Analysis
On the daily chart, the Nasdaq is starting to show signs of weakness. A bearish divergence has formed between the MACD and price movement , which is a classic signal that bullish momentum may be fading. This often indicates the potential for a trend reversal or a deeper correction.
A recent drop, confirmed by a strong bearish full-body candlestick, suggests that selling pressure is increasing. If this continues, we expect a breakdown from the current bullish channel.
In this scenario, the extended Wave 3 may have reached its peak. A correction could follow, with the first target at 21484, which lines up with the 0.382 Fibonacci retracement level. If the decline continues, the next downside target would be around 20067, where a previous gap may be filled.
This bearish outlook remains valid as long as the price stays below 23800 . A move above that level would invalidate the setup and return the outlook to neutral.
Support the channel by engaging with the content, using the rocket button, and sharing your opinions in the comments below.
Disclaimer: "Please note that this analysis is solely for educational purposes and should not be considered a recommendation to take a long or short position on Nasdaq.
US100 Bullish Breakout! Buy!
Hello,Traders!
US100 is trading in a
Strong uptrend and the
Index made a strong bullish
Breakout of the key horizontal
Level of 23,720 which is now
A support and the breakout
Is confirmed so we are
Bullish biased and we will
Be expecting a further
Bullish continuation
Buy!
Comment and subscribe to help us grow!
Check out other forecasts below too!
Disclosure: I am part of Trade Nation's Influencer program and receive a monthly fee for using their TradingView charts in my analysis.
