Weekly SPY (US500-ES-SPX) Outlook - Prediction (16 NOV)Weekly SPY (US500-ES-SPX) Outlook - Prediction (16 NOV)
📊 Market Sentiment
Market sentiment appears bearish right now, in my opinion. The FED may pause rate cuts in December, which has contributed to recent selling pressure and potential hedging flows. However, with the U.S. government reopening last week, we will begin receiving updated economic data again. If employment data weakens and CPI comes in low or stable, it could support renewed bullish momentum.
NVDA will report earnings this Wednesday after market close. I will be watching closely in my view, if NVDA were to miss expectations, both QQQ and SPY could see a strong retracement. However, I think this is unlikely. I expect solid earnings growth and believe the ongoing AI cycle will continue to support upside.
Additionally, U.S. Treasury Secretary Scott Bessent stated that the Trump administration aims to finalize its trade agreement with China by Thanksgiving (November 27). This could help bring additional bullish sentiment into the market.
📈 Technical Analysis
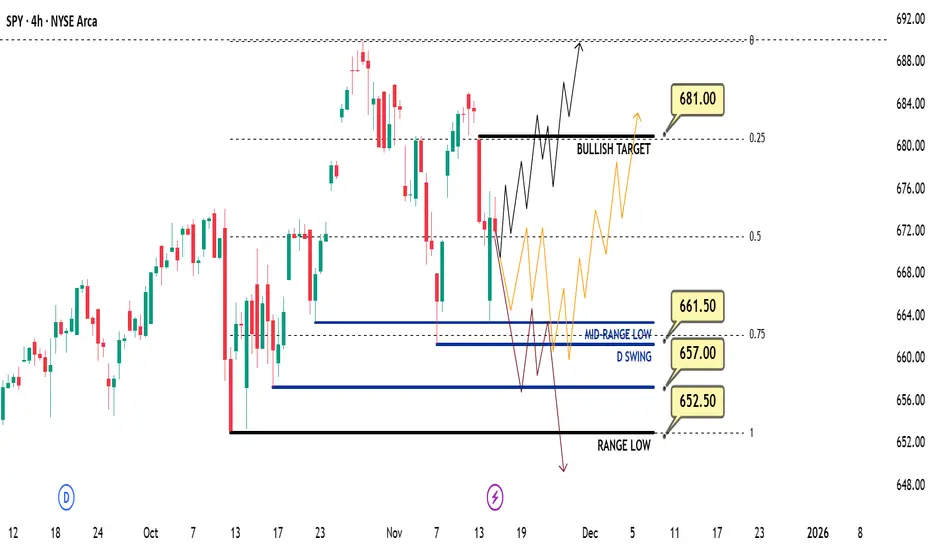
Price retraced into the 0.75 max discount zone, ran the mid-term range low, and closed back above it creating another higher expansion bounce. On Friday, we saw a second retest of the range low followed by another strong reaction. In my opinion, price remains strong here.
📌 Game Plan – Prediction
I currently see three scenarios:
Bullish Scenario (Black Line):
I believe this is the most likely scenario. I want to see price close above 675.5 and continue expanding higher. The first bullish target is 681. After clearing 681, a small retracement may occur, followed by a potential expansion toward all-time highs around 690.
Orange Scenario:
If the market opens less bullish on Sunday night, price may run 661 to gather more liquidity and energy for a move higher. If 661 is swept and a 4H candle closes back above it, I will assume this scenario is playing out.
Bearish Scenario (Red Line):
If price breaks aggressively below 661 and closes underneath it, that would indicate the market may want to move lower. In that case, I will exit my calls and buy puts, targeting a move toward at least 562.5.
💬 For detailed insights and broader market context, please check my Substack link in profile.
⚠️ For educational purposes only. This is not financial advice.
Us100
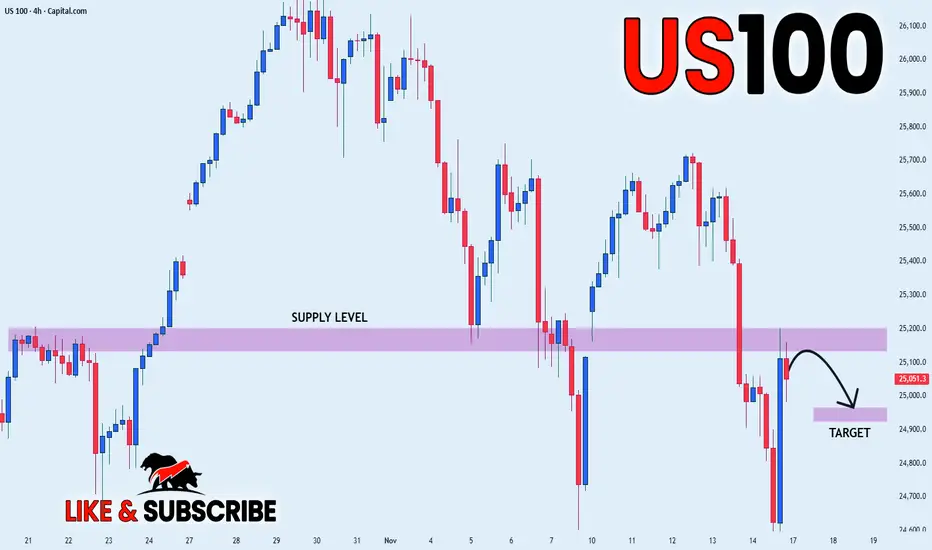
US100 LOCAL SHORT|
✅US100 price rejects the supply block and forms a clean displacement lower, hinting at a draw on liquidity toward the inefficiency below. A corrective retrace before targeting the marked zone is likely. Time Frame 4H.
SHORT🔥
✅Like and subscribe to never miss a new idea!✅
Weekly QQQ (US100-NQ) Outlook - Prediction (16 NOV)Weekly QQQ (US100-NQ) Outlook - Prediction (16 NOV)
📊 Market Sentiment
Market sentiment appears bearish right now, in my opinion. The FED may pause rate cuts in December, which has contributed to recent selling pressure and possible hedging flows. However, with the U.S. government reopening last week, we will start receiving updated economic data again. If employment data weakens and CPI comes in low or stable, it could trigger a renewed bullish momentum.
NVDA will report earnings this Wednesday after market close. I will be watching closely in my view, if NVDA were to miss expectations, QQQ and SPY could see a strong retracement. However, I think this is unlikely. I expect solid earnings growth and believe the AI cycle continues to support upside.
Additionally, U.S. Treasury Secretary Scott Bessent stated that the Trump administration aims to finalize its trade agreement with China by Thanksgiving (November 27). This could add further bullish sentiment to the market.
📈 Technical Analysis
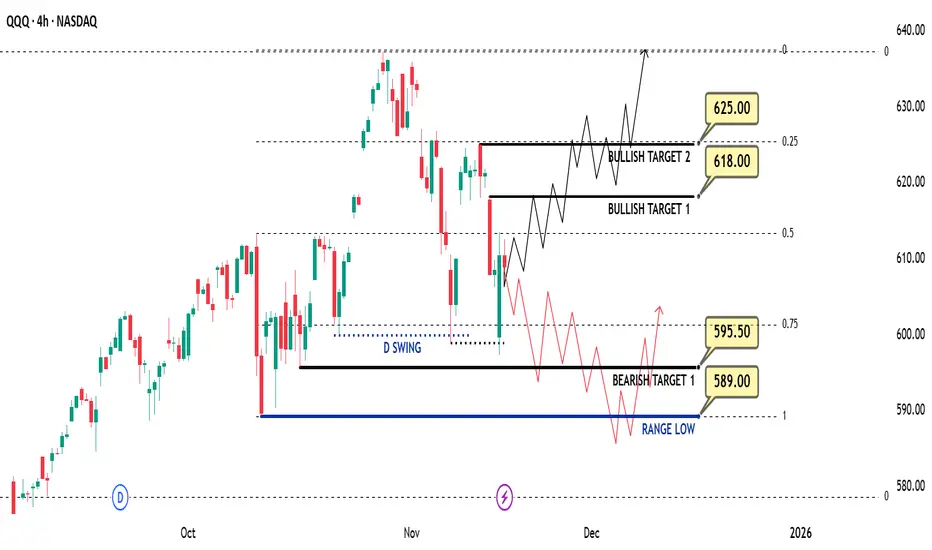
The market showed a strong bounce on Friday after tapping the 599 level. RSI has also reset, meaning price is no longer overbought. We remain inside the weekly range, and price has reached the 0.75 max discount zone for the second time.
📌 Game Plan – Prediction
Bullish Scenario (Black Line):
I think this scenario is more likely. I want to see price close a 4H candle above 613. If that happens, I will be targeting 618 next. Price may run 618, pull back slightly, then eventually push toward 625 and potentially all-time highs around 637.
Bearish Scenario (Red Line):
If we see strong selling on Monday, I will assume price may follow the bearish path. In that case, I expect a move toward 595.5 and then the range low at 589. From there, we could see a bounce and a reclaim of 595.5.
💬For detailed insights and broader market context, please check my Substack link in profile.
⚠️ For educational purposes only. This is not financial advice.
US100 | Bullish Reversal From Demand Zone — Targeting 25,200 LiqUS100 has reacted strongly from the 24,400–24,900 major demand zone, showing a sharp rejection and reclaiming structure. Price is now building momentum toward the 25,200 buy-side liquidity level.
A clean consolidation + breakout pattern is forming just below liquidity, indicating potential continuation to the upside.
Market Breakdown:
HTF Bias: Bullish
Demand Zone: 24,400 – 24,900
Intraday Target: 25,201 liquidity zone
Extended Target: 25,722 (major buy-side liquidity)
Confirmation: Break & retest above 25,100
Invalidation: Clean break below 24,950

US100 Free Signal! Sell!
Hello,Traders!
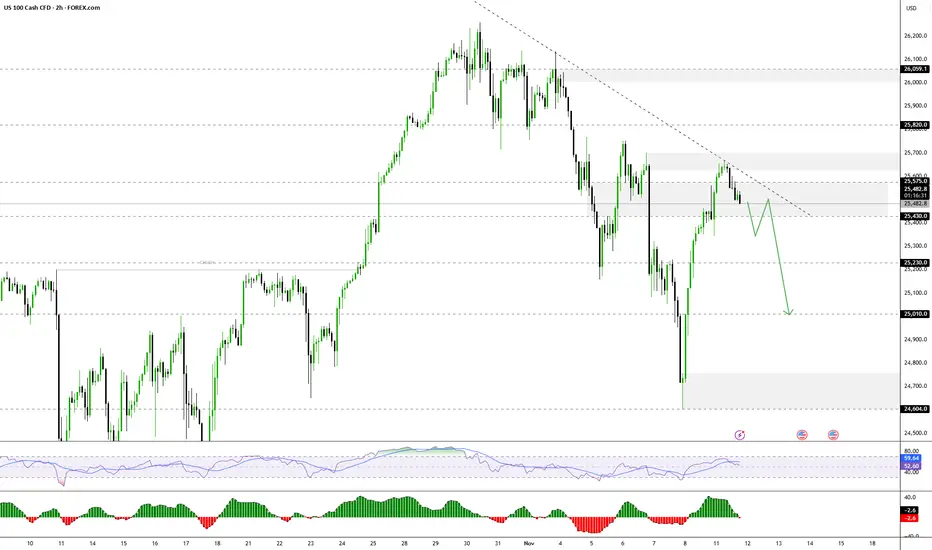
US100 is reacting inside the horizontal supply, where bearish orderflow continues to cap every rally attempt. With liquidity sitting below the prior swing lows, price is positioned for a corrective push lower.
--------------------
Stop Loss: 25,210
Take Profit: 24,901
Entry Level: 25,048
Time Frame: 2H
--------------------
Sell!
Comment and subscribe to help us grow!
Check out other forecasts below too!
Disclosure: I am part of Trade Nation's Influencer program and receive a monthly fee for using their TradingView charts in my analysis.

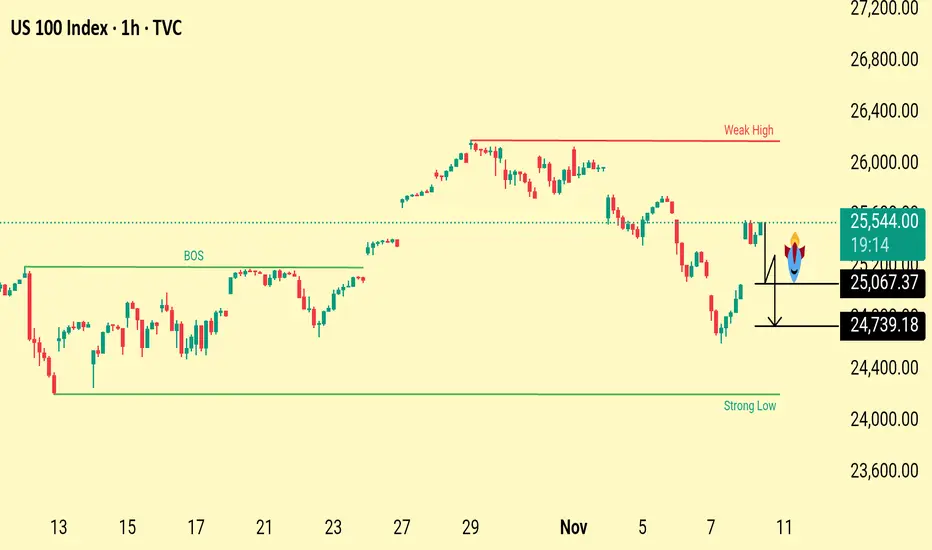
US100 Price Action Outlook Weak High Target&Liquidity SweepZonesThe chart highlights a weak high above current price action, suggesting potential upside liquidity targets. Below, key downside levels at 25,067 and 24,739 mark liquidity pools and possible retracement zones if price rejects current resistance. The structure shows a recent break of structure with both bullish and bearish scenarios in play.
Price is reacting near a resistance area after a recent bounce. The weak high above suggests liquidity may be targeted before any reversal. If price rejects this zone, the next downside levels to watch are 25,067 and 24,739, where liquidity sits and buyers may step in. Structure remains mixed, with both upward liquidity grabs and potential pullbacks likely
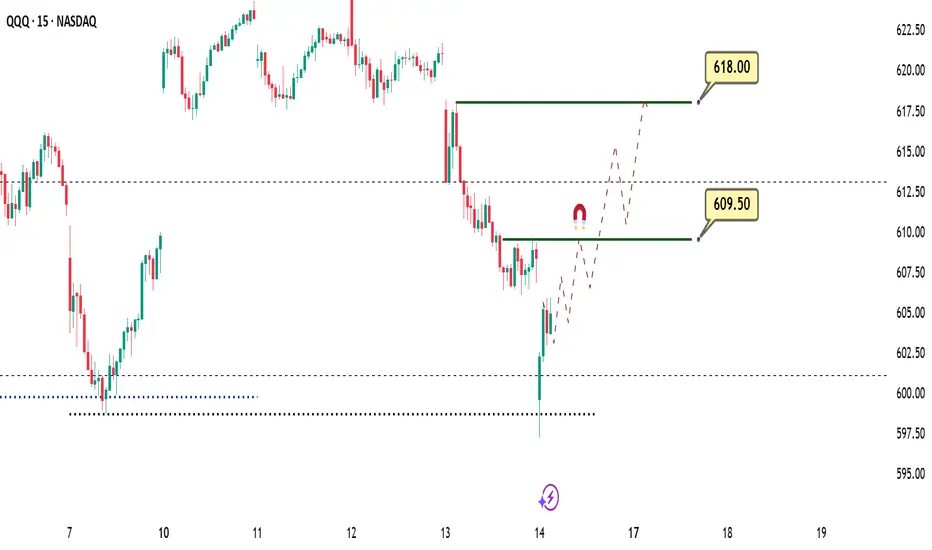
Daily QQQ (US100-NQ) Outlook - Prediction (14 NOV)Daily QQQ (US100-NQ) Outlook - Prediction (14 NOV)
📊 Market Sentiment
Market sentiment appears neutral, in my opinion. The U.S. government is expected to reopen soon; however, officials have decided not to release previous economic data. This creates uncertainty for traders without key data, it becomes difficult to anticipate the FED’s next policy decisions.
📈 Technical Analysis
QQQ tapped the weekly swing low at 687 and was rejected from that level. SPY retested the 637 zone, which is the range low for me, and reacted with a strong bounce. At the moment, price is showing clear upward momentum, suggesting that a stronger move may develop into the afternoon session. NVDA and AAPL are currently leading the market higher.
📌 Game Plan
I bought calls around 601, and I expect to see 609.5 first, and if we get a strong continuation, possibly the 618 level.
At 609.5, I will close half of my position, trail my stop-loss to breakeven, and target 618 for the remainder.
💬For detailed insights and broader market context, please check my Substack link in profile.
⚠️ For educational purposes only. This is not financial advice.
NASDAQ100 WATCH FOR HIGH PROBABILITY BUY SETUP SOON!!!🚨 NAS100 HIGH PROBABILITY BUY SETUP 🚨
* Here We Can See Clearly The Next Potential Moves For US100 Coming Hours/Days.
* Keep Your Eyes Close On Your Trading Positions.
* Happy PIP Hunting Traders.
FXKILLA.

NASDAQ NAS100 Under Pressure – Watching for a Break of StructureThe NASDAQ is currently showing signs of weakness on the 4-hour chart. Sellers are gradually stepping in, and we can see US100 bearish momentum starting to take control. The market is under pressure, and price action is hinting at potential continuation to the downside.
I’ll be watching closely for a NAS100 break below the current range low — if price retests that level and fails to reclaim it, that would confirm a bearish market structure shift 🔻. Such a setup could provide a high-probability short opportunity as momentum accelerates to the downside.
⚠️ This is not financial advice — purely for educational and analytical purposes.

US100 REBOUND AHEAD|LONG|
✅US100 is approaching a defined demand level where discount pricing aligns with bullish order flow. A potential rebound may deliver price toward the imbalance above. Time Frame 5H.
LONG🚀
✅Like and subscribe to never miss a new idea!✅

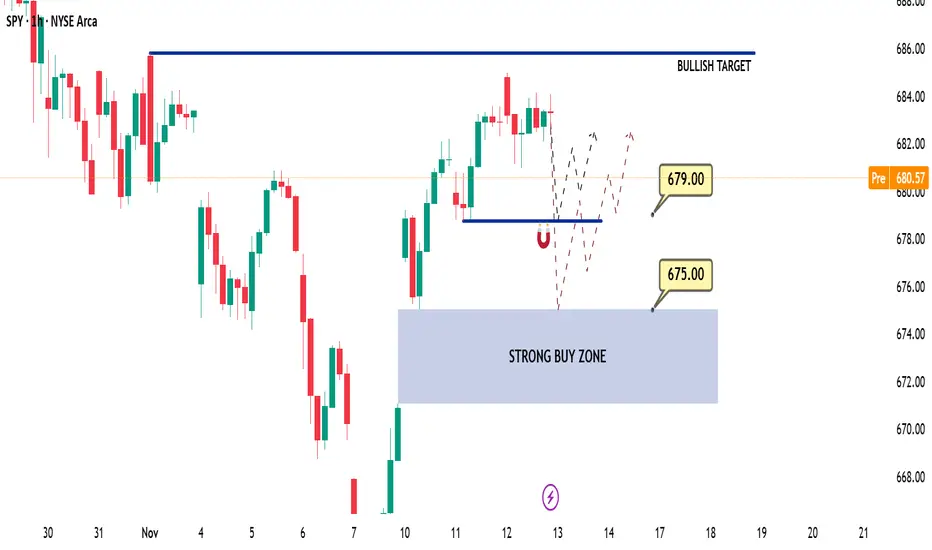
Daily SPY (US500-SPX) Outlook - Prediction (13 NOV)Daily SPY (US500-SPX) Outlook - Prediction (13 NOV)
📊 Market Sentiment
Market sentiment appears neutral, in my opinion. The U.S. government is expected to reopen soon; however, officials have decided not to release previous economic data. This adds uncertainty for traders without data, it becomes difficult to gauge the FED’s next policy decision.
📈 Technical Analysis
SPY experienced a range-bound session yesterday, consolidating between 680 and 685. On higher timeframes, price action still suggests a desire to expand higher, but momentum has temporarily slowed.
📌 Game Plan
In my opinion, the market may show slight bearish pressure early in the session, followed by a moderate bullish bounce.
Scenario 1: SPY may drop to 679 and bounce from there, returning to the 682–685 range.
Scenario 2: If SPY breaks 679 aggressively, I expect a retracement toward 675. At that level, I plan to load calls for a potential bullish move.
💬 For detailed insights and broader market context, please check my Substack link in profile.
⚠️ For educational purposes only. This is not financial advice.
Daily QQQ (US100-NQ) Outlook - Prediction (13 NOV)Daily QQQ (US100-NQ) Outlook - Prediction (13 NOV)
📊 Market Sentiment
Market sentiment appears neutral, in my opinion. The U.S. government is expected to reopen soon; however, officials have decided not to release previous economic data. This creates uncertainty for traders without key data, it becomes difficult to anticipate the FED’s next policy decision.
📈 Technical Analysis
QQQ experienced a range-bound session yesterday, while the Dow Jones carried most of the market’s momentum. Compared to SPY, QQQ showed more weakness throughout the session. However, the higher-timeframe structure remains bullish, and I will continue following that bias.
📌 Game Plan
Scenario 1: Price may dip to the 616–617 zone and bounce from there, returning to the 621–623 range.
Scenario 2: If price breaks 617 aggressively, it may retrace toward 613 before bouncing back into the 620–625 zone.
In my opinion, calls may work better on SPY today, while puts could perform better on QQQ.
💬 For detailed insights and broader market context, please check my Substack link in profile.
⚠️ For educational purposes only. This is not financial advice.

US100 – Consolidation Between FVGs, Watching for Bullish BreakouHello traders,
On the daily timeframe, NASDAQ (US100) is currently consolidating between a bullish and a bearish Fair Value Gap (FVG). Both sides present clear liquidity areas, and the market is preparing for its next directional move.
From my perspective, I’d like to see the price tap into the bullish FVG first, react from that zone, and then invalidate the bearish FVG on its way higher.
If this scenario plays out, the next targets would be the equal highs (EQH) and eventually a new all-time high (ATH).
However, if a daily candle closes below the bullish FVG, this idea becomes invalid and we could expect further downside movement.
For now, I remain bullish while the bullish FVG holds. 📈
💌It is my honor to share your comments with me💌
🔎 DYOR
💡Wait for the update!

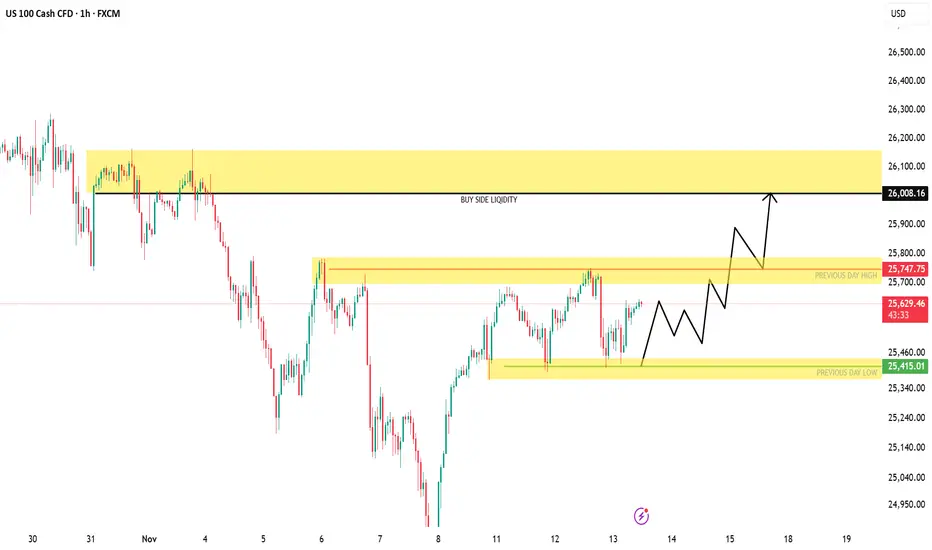
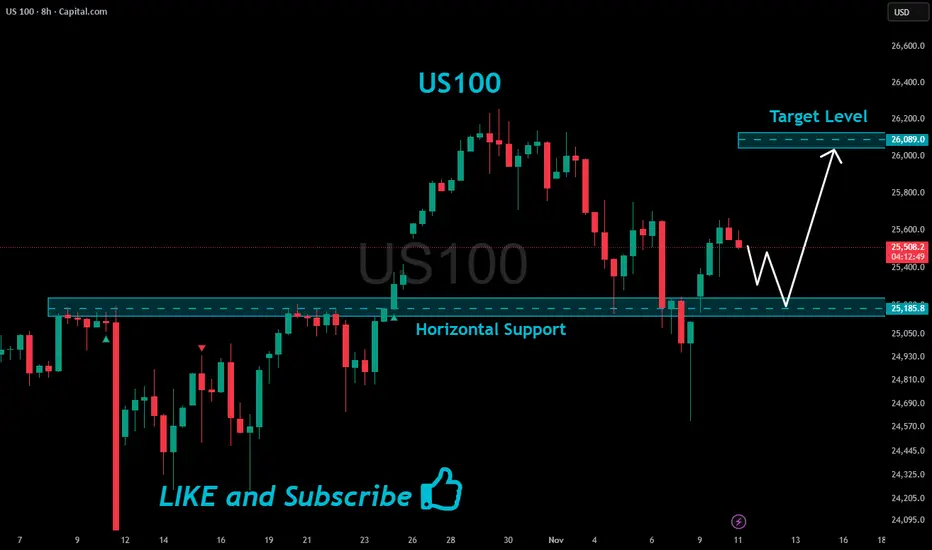
US100 | Building Liquidity for a Potential Push Toward 26,000NASDAQ (US100) is consolidating between 25,400–25,750, forming a potential accumulation zone below short-term liquidity. A clean break and retest above 25,750 could trigger a bullish expansion toward the 26,000–26,200 range, where major buy-side liquidity sits.
Market Structure:
Bias: Bullish (HTF structure shifting higher)
Key Demand Zone: 25,400 – 25,450
Breakout Zone: 25,750
Target Zone: 26,000 – 26,200
Invalidation: Below 25,400
Concepts: Liquidity Grab | Market Structure Shift | Demand Zone | Breaker Block | Smart Money Flow
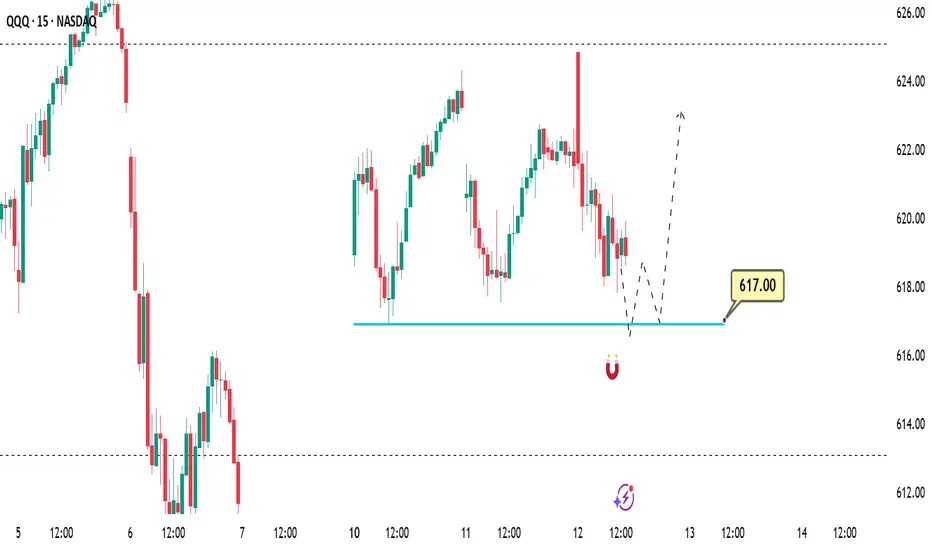
QQQ (NQ/US100) Quick Trade Idea - (12 NOV)📌 Prediction / Game Plan
In my opinion, the price is currently attempting to reprice the gap around the 617 level.
If the price reaches this zone, we may see a rejection-bounce toward 620 first, followed by 625.
I’ll be closely watching the 617 zone for a potential call entry setup.
Daily SPY (US500) Outlook - Prediction (12 NOV)Daily SPY (US500) Outlook - Prediction (12 NOV)
📊 Market Sentiment
The market continues to lean bullish following the potential resolution of the U.S. government shutdown, along with the proposed $2,000 incentives for U.S. citizens. These developments could drive stronger inflows into equities and sustain short-term positive sentiment.
📈 Technical Analysis
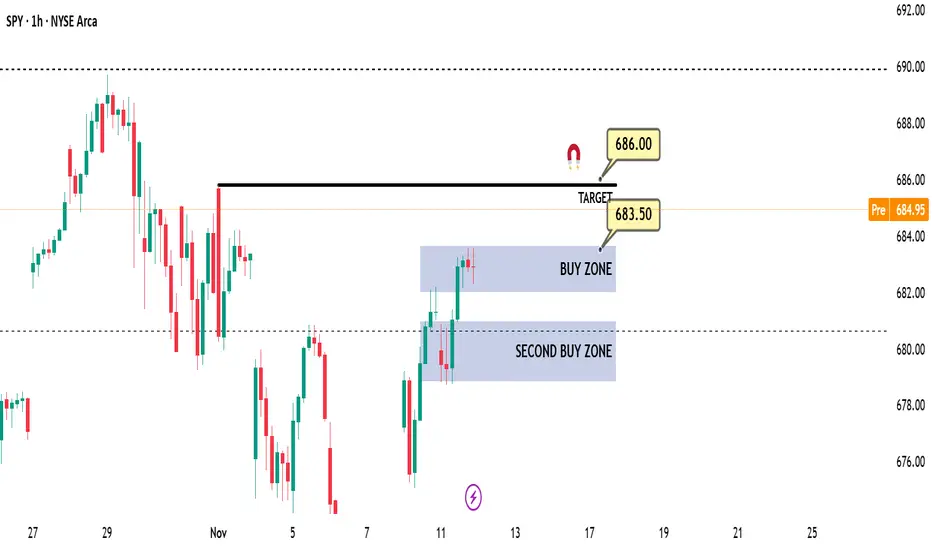
Price moved higher overnight, likely targeting the 686 level, supported by strong momentum carried over from the Dow Jones (US30).
📌 Game Plan
In my opinion, I will look to buy if the price retraces to the 683.5–682 zone for a potential continuation move toward 686.
However, if we see a strong breakout below 682 and a 4H candle close beneath that level, I plan to exit my position. Another possible bounce could occur around 681, but confirmation would be required before entering such a trade.
💬For detailed insights and broader market context, please check my Substack link in profile.
⚠️ For educational purposes only. This is not financial advice.
Daily SPY (US500) Outlook - Prediction (11 NOV)Daily SPY (US500) Outlook - Prediction (11 NOV)
📊 Market Sentiment
The market is turning bullish following the potential resolution of the U.S. government shutdown, along with the proposed $2,000 incentives for U.S. citizens. These factors could create strong inflows into equities and improve short-term sentiment.
📈 Technical Analysis
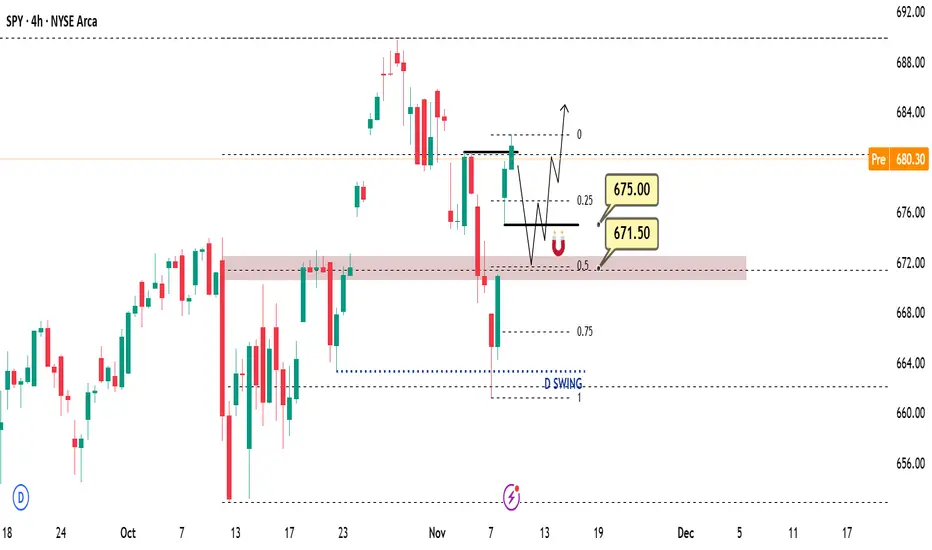
Price moved sharply higher on Monday, reaching the 681 level as expected (see my previous SPY outlook). The 681 level remains a strong resistance zone, and we have already seen a rejection from that area.
📌 Game Plan
In my opinion, the market may turn short-term bearish today. After rejecting 681, the price could target the 675 level and possibly though not necessarily reach 671.5.
My plan is to short the market toward 675 and observe if a bounce occurs. If it does, I will look to buy calls, expecting a move toward new highs around 685.
💬For detailed insights and broader market context, please check my Substack link in profile.
⚠️ For educational purposes only. This is not financial advice.
Good zones o work with, nasdaq 11-11-25Low volume nodes and gaps, usually are good zones to work with.

US100 – Bullish Reversal Setup-H4: Turning bullish with a new high at 25,667.
Pullback: Formed a lower high, now H1 shifting bullish again.
Plan: Looking for buys above 25,542, SL below last H1 LH.
Adjustment: If another H1 LH forms and breaks upward, trail SL for tighter risk.
-Fundamental: Shutdown-end hopes , supporting the bullish scenario.

US100 Reversal Map – Hull MA + Heikin Ashi Confirmation🧠 US100 / NASDAQ100 Profit Pathway Setup — The Thief’s Bullish Escape Plan! 💰🚀
📊 Market Bias: Bullish (Day Trade Setup)
The Thief Trader has spotted a golden pathway in the NASDAQ100 (US100)!
Here’s the breakdown of the plan — straight from the thief’s vault 🕵️♂️📈
🎯 Plan Overview
Bias: Bullish continuation confirmed
Technical Confirmation:
✅ Double Pullback on Hull Moving Average
✅ Retest Zone successfully defended
✅ Heikin Ashi Bullish Doji signaled a trend reversal confirmation
💡 Momentum is shifting upward — the trend has officially changed!
💎 Entry Strategy (Layered Thief Style)
The Thief Strategy applies a layered entry method — multiple buy limits to average into strength.
📥 Buy Limit Layers:
25,300
25,400
25,500
25,600
(Traders can adjust or add more layers based on risk appetite and confirmation zones.)
🛡️ Stop-Loss Setup
This is the Thief SL @ 25,100
⚠️ Note to Thief OG’s:
I’m not recommending my SL as your SL — always customize risk and secure your own bag. Manage your position with discipline and independence! 💼
🎯 Take-Profit Zone
Target: 26,200
🚨 The Police Barricade Zone acts as a strong resistance — overbought levels spotted and potential bull trap alert!
Kindly exit with profit before the officers arrive. 😎
⚠️ Note: Profit-taking is at your discretion. Book and Run!
📈 Related Pairs to Watch (Correlation Insight)
NASDAQ:NDX / CAPITALCOM:US100 / NASDAQ:QQQ : All mirror NASDAQ movement.
SP:SPX / AMEX:SPY : Often correlate with NASDAQ’s momentum (watch divergence for clues).
TVC:VIX : If volatility spikes, expect pullbacks on tech-heavy indices.
TVC:DXY : A weak dollar often fuels US100 bullish legs — keep an eye on it.
NASDAQ:AAPL / NASDAQ:MSFT / NASDAQ:NVDA : Leading drivers of NASDAQ — if they pump, the index follows. 💪
🧩 Key Insights
Hull MA alignment confirms momentum shift.
Retest + bullish Heikin Ashi Doji = market reversal confirmation.
Layered entries give flexibility in volatile intraday conditions.
Dynamic risk management is key — never marry a position.
✨ “If you find value in my analysis, a 👍 and 🚀 boost is much appreciated — it helps me share more setups with the community!”
#US100 #NASDAQ100 #ThiefTrader #DayTrading #IndexTrading #HullMA #HeikinAshi #LayeredEntries #TechnicalAnalysis #TradingSetup #PriceAction #MarketReversal #TradingCommunity #BullishPlan #SmartMoneyFlow #TradeIdeas #ThiefStrategy

Nasdaq Potential for Further CorrectionThe NASDAQ index currently appears to be in a short-term correction, with the price likely to retest 25430 from 25570 before further movement.
- Above 25430–25575: Bullish continuation towards 25700 → 25820 → 25960.
- Below 25430: Bearish momentum is likely towards 25230 → 25010.
US100 Support Ahead!
HI,Traders !
#US100 is making a local
Bearish correction but
We are bullish biased mid-term
So after the pair hits the horizontal
Support of 25185.8 we will be
Expecting a local bullish rebound !
Comment and subscribe to help us grow !
NVDA (NVIDIA) – Buy PlanNVDA (NVIDIA) – Buy Plan
📊 Market Sentiment
On October 29, the FED lowered rates by 25bps as expected. However, Powell’s remarks introduced uncertainty around further cuts in December, emphasizing that future policy will depend on incoming data.
One FED member dissented, preferring no cut this cycle — a notable shift from September’s unanimous decision.
Additionally, ADP Non-Farm Employment Change came at 42K versus 32K expected. It’s slightly higher, but since other macro data are missing due to the U.S. government shutdown, the overall sentiment remains mixed.
For now, macro sentiment leans bearish, as rate cuts may be delayed into 2026.
However, with NVDA earnings approaching, we could see a short-term bullish sentiment building around the stock.
📈 Technical Analysis
NVDA is currently trading around the 0.5 equilibrium zone, which aligns with the HTF bullish trendline.
This area could provide temporary support and a potential bounce setup.
However, it’s crucial to watch the SPY structure as it may influence NVDA’s short-term movement.
📌 Game Plan / Expectations
I’ll be watching the $185–$180 range as a key HTF support zone.
This area also aligns with a possible trendline deviation, where price could manipulate below the trendline to trap sellers before reclaiming it.
I plan to buy call options within this range, targeting a continuation of the bullish leg post-earnings.
💬 If this breakdown aligns with your outlook, like and comment below.
For deeper sentiment and strategy insights, subscribe to my Substack — free access available.
⚠️ Disclaimer
This analysis is for educational purposes only and does not constitute financial advice. Always conduct your own research before trading or investing.
