NASDAQ Excellent rebound on the 1D MA50. Bullish.Nasdaq (NDX) has been trading within a 6-month Channel Up and last Friday made another 1D MA50 (blue trend-line) test exactly at the bottom (Higher Lows trend-line) of the pattern, and rebounded.
This has market the last two bottoms of the Channel Up and kickstarted the Bullish Legs, which have both been at +9.59%. As you realize, this it technically the pattern's strongest Support and most optimal buy entry for the medium-term.
We expect at least another +9.59% rally on the emerging Bullish Leg, targeting 26950.
-------------------------------------------------------------------------------
** Please LIKE 👍, FOLLOW ✅, SHARE 🙌 and COMMENT ✍ if you enjoy this idea! Also share your ideas and charts in the comments section below! This is best way to keep it relevant, support us, keep the content here free and allow the idea to reach as many people as possible. **
-------------------------------------------------------------------------------
💸💸💸💸💸💸
👇 👇 👇 👇 👇 👇
Us100

US100 Free Signal! Buy!
Hello,Traders!
US100 Price has retraced back into a premium supply area after internal liquidity sweep. Smart money is likely to reprice lower, targeting inefficiency and equal lows beneath the recent range.
---------------------
Stop Loss: 25,256$
Take Profit: 24,951$
Entry Level: 25,133$
Time Frame: 3H
---------------------
Sell!
Comment and subscribe to help us grow!
Check out other forecasts below too!
Disclosure: I am part of Trade Nation's Influencer program and receive a monthly fee for using their TradingView charts in my analysis.

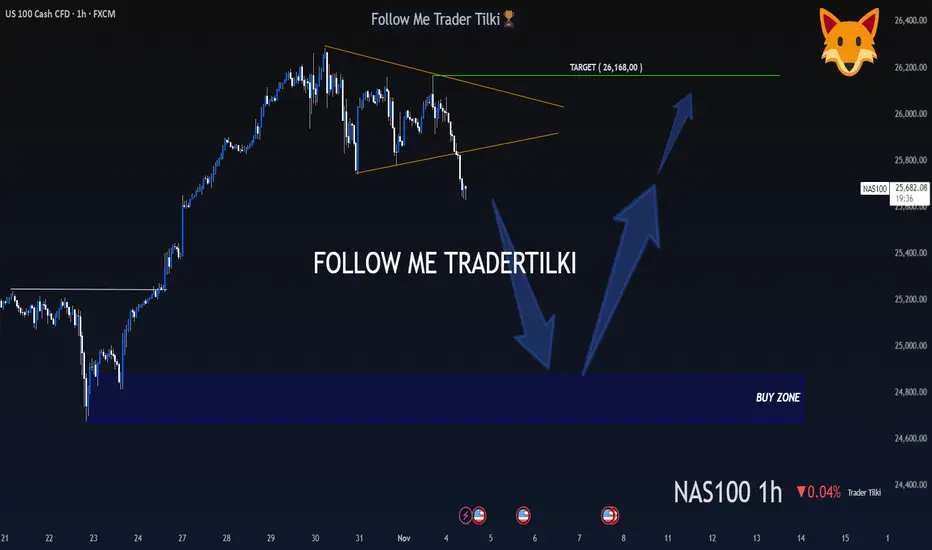
A Hunter Waits Patiently, Then Strikes Like a Lion - US100 - 1HMy dear friends, greetings,
My friends, I have set the buy levels for US100 at 24,872 and 24,677.
I will never enter a trade or put myself at unnecessary risk before these levels are reached.
My friends, in order to consistently win in this market and to become a successful trader, patience is essential.
If you act with patience and strategy, you will always be a winning trader, just like me.
I would also like you to know that my target is set at the 26,168 level.
My friends, every single like from you is my greatest motivation to share these analyses.
I sincerely thank everyone who supports me with their appreciation.
With my respect and love.
US100 Resistance Ahead!
HI,Traders !
US100 is making a
Nice bullish correction
After a sharp local flash-crash
But a local horizontal resistance
Level is ahead at 25185.8
So after the retest we will
Be expecting a local
Bearish correction !
Comment and subscribe to help us grow !

US100 FREE SIGNAL|SHORT|
✅US100 is pushing towards the premium supply zone and after a liquidity sweep above short-term highs we will expect continuation toward the next downside inefficiency as sell-side liquidity gets targeted on Monday!
—————————
Entry: 25,115.5$
Stop Loss: 25,200$
Take Profit: 24,900$
Time Frame: 3H
—————————
** SHORT🔥
✅Like and subscribe to never miss a new idea!✅

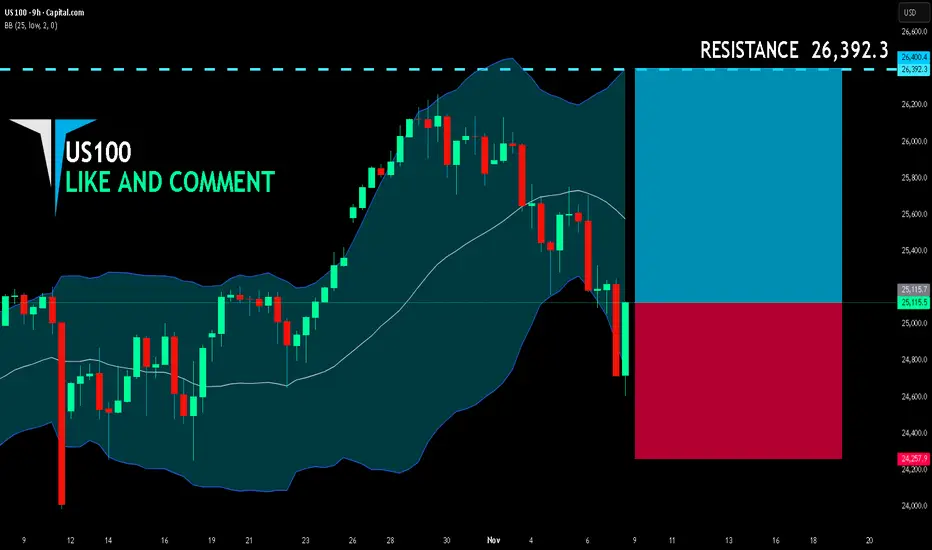
US100 LONG FROM SUPPORT
US100 SIGNAL
Trade Direction: long
Entry Level: 25,115.7
Target Level: 26,392.3
Stop Loss: 24,257.9
RISK PROFILE
Risk level: medium
Suggested risk: 1%
Timeframe: 9h
Disclosure: I am part of Trade Nation's Influencer program and receive a monthly fee for using their TradingView charts in my analysis.
✅LIKE AND COMMENT MY IDEAS✅
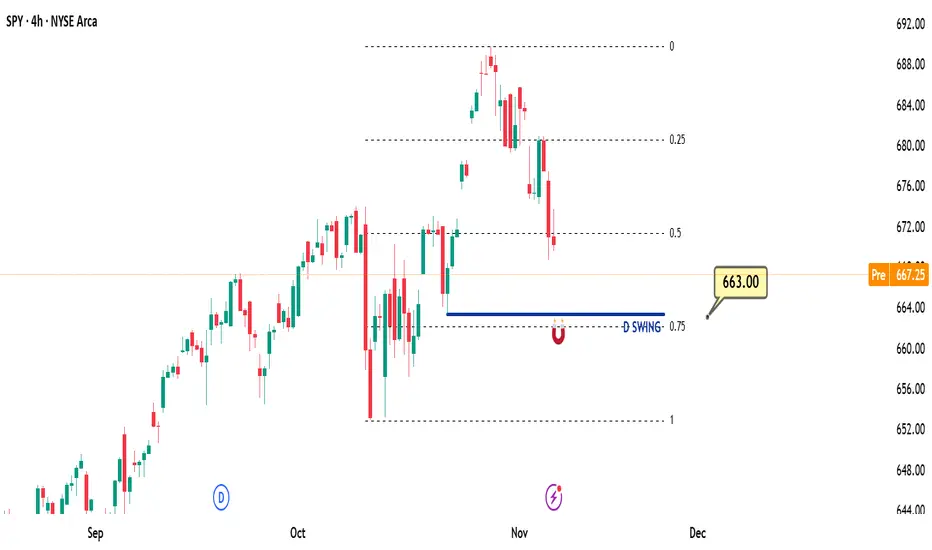
Daily SPY Outlook - Prediction (07 NOV)Daily SPY Outlook - Prediction (07 NOV)
📊 Market Sentiment
Market sentiment is slightly bearish as expectations for a December rate cut may be delayed into 2026. We have seen some sell-offs, likely due to hedging or profit-taking activity.
📈 Technical Analysis
Price is currently pulling back from the all-time high and moving within the equilibrium zone near the 670 level, which acts as short-term support. This is where I think accumulation may occur.
📌 Game Plan
In my opinion, price could reach the 663 level before showing a potential rebound. Therefore, I plan to stay short-biased toward 663, as puts might perform well today — unless I see a strong 4H candle close after the market open.
💬For detailed insights and broader market context, please check my Substack link in profile.
⚠️ Disclaimer: For educational purposes only. This is not financial advice.
NAS100 H1 | Bullish Bounce off Key SupportNAS100 is falling towards our buy entry at 24,841, which is a swing low support level that aligns with the 161.8% Fibonacci extension level.
The stop loss is at 24,664, which is a swing low support level, while the take profit is at 25,102, which is a pullback resistance level.
Stratos Markets Limited (tradu.com/uk ):
CFDs are complex instruments and come with a high risk of losing money rapidly due to leverage. 68% of retail investor accounts lose money when trading CFDs with this provider. You should consider whether you understand how CFDs work and whether you can afford to take the high risk of losing your money.
Stratos Europe Ltd (tradu.com/eu ):
CFDs are complex instruments and come with a high risk of losing money rapidly due to leverage. 70% of retail investor accounts lose money when trading CFDs with this provider. You should consider whether you understand how CFDs work and whether you can afford to take the high risk of losing your money.

Nasdaq Swing bullish setup4 hour
fibonacci Retracement 50% and 60%
1 hour
Wait for trend reversal
RRR 1:3 and hold for 1:5

US100 Will Hit Resistance Soon!
HI,Traders !
#US100 keeps growing
And the price will soon
Hit a horizontal resistance
Of 25817.8 from where
A local bearish correction
Is to be expected !
Comment and subscribe to help us grow !

NAS100 H4 | Bearish Reaction off FVGNAS100 is now rising towards our sell entry at 25,883, which aligns with the H4 Fair Value Gap and 71% Fibonacci retracement. We shall see how price reacts to this area after it breaks through the previous 2 swing high resistance levels.
The stop loss is at 26,167, which is a swing high resistance level, while the take profit is at 25,313, which is a swing low support level.
Once price reacts bearishly, do take note of the above swing low support level at 25,581 as well.
Stratos Markets Limited (tradu.com/uk ):
CFDs are complex instruments and come with a high risk of losing money rapidly due to leverage. 68% of retail investor accounts lose money when trading CFDs with this provider. You should consider whether you understand how CFDs work and whether you can afford to take the high risk of losing your money.
Stratos Europe Ltd (tradu.com/eu ):
CFDs are complex instruments and come with a high risk of losing money rapidly due to leverage. 70% of retail investor accounts lose money when trading CFDs with this provider. You should consider whether you understand how CFDs work and whether you can afford to take the high risk of losing your money.

Nasdaq NAS100 Bulls Regain Control: What I’m Watching Next📈 On the 4-hour NASDAQ chart, we can clearly see a break in structure to the upside, signaling strong bullish momentum entering the market. 🟩 The buyers are showing strength, and I’ll be looking to capitalize on this momentum — but only if we see a confirmed break of the current swing high, followed by a retracement into the retest zone. 🔁
However, patience is key. ⏳ I’ll only look to engage if today’s New York session data release aligns with and supports the bullish bias. Fundamentals and technicals must work together before I take a position.
As mentioned in the video, if the anticipated price action fails to materialize, we’ll simply abandon this setup and move on — staying disciplined is crucial. 🚫
⚠️ Disclaimer: This analysis is for educational purposes only and not financial advice.

Nasdaq 100 – A Quiet Accumulation Before the Next PushThe Nasdaq 100 (US100) is showing early signs of a structural rebalancing after the recent correction. Price is currently hovering near 25,600, retracing modestly after a short-term rebound from the 25,280 demand zone — a level where Smart Money seems to have re-entered quietly.
💭 1️⃣ Market Structure – A Story of Displacement and Repricing
The current chart reveals a clear Break of Structure (BOS) followed by a corrective pullback.
After the previous sell-off, price found support at the 25,280 – 25,300 range — a discount zone aligning with both an order block and a trendline confluence.
This zone likely served as institutional demand, where Smart Money began accumulating long positions before the upward displacement.
The recent retracement, however, remains within a corrective structure, meaning we could still see one more liquidity sweep before the market decides its next major leg.
🩶 2️⃣ Supply & Demand Zones – The Footprints of Institutions
Karina is currently tracking three zones that matter most to the structure:
Demand Zone:
25,280 – 25,300: The base of institutional accumulation and current structural support.
Supply Zones:
25,970 – 26,160: A major bearish order block where Smart Money previously distributed positions — likely the next liquidity target.
The most probable scenario: a retest of the lower demand → a liquidity grab → bullish displacement toward 25,970 – 26,160 → reversal back to equilibrium.
🧭 3️⃣ Liquidity Flow – The Path of Least Resistance
Above the current range lies buy-side liquidity resting at 26,000+, while below, sell-side liquidity has already been swept near 25,280.
This suggests that the next move could be an engineered push upward — designed to collect liquidity above 25,970 – 26,160 before potential continuation back into the demand zone.
Such a move would mirror the classic SMC liquidity cycle:
Accumulate → Displace → Manipulate → Distribute.
🌙 4️⃣ Trading Outlook – Patience Before Precision
Karina’s bias for the day is moderately bullish, anticipating a short-term expansion toward the upper liquidity pool.
However, she remains cautious — waiting for confirmation near the demand zone before entering long.
Buy Idea:
Entry: 25,280 – 25,300
Stop Loss: below 25,200
Target 1: 25,970
Target 2: 26,160
If the liquidity sweep at 26,160 completes, Karina expects a controlled retracement — a potential short setup back into equilibrium around 25,400.
🌷 5️⃣ Reflection – When the Market Whispers, Smart Money Listens
The chart right now feels calm, methodical — like the quiet before a decisive wave.
Smart Money rarely rushes. It absorbs, manipulates, and moves when most traders stop paying attention.
For Karina, this is one of those moments where patience becomes the most powerful strategy.
The next move will not be random — it will be precise, intentional, and elegant, just like the rhythm of liquidity itself 🌙
This analysis reflects Karina’s personal perspective and is not financial advice.
How do you see the US100’s next move? Is Smart Money gearing up for another liquidity sweep above 26k? Let’s discuss below 💬

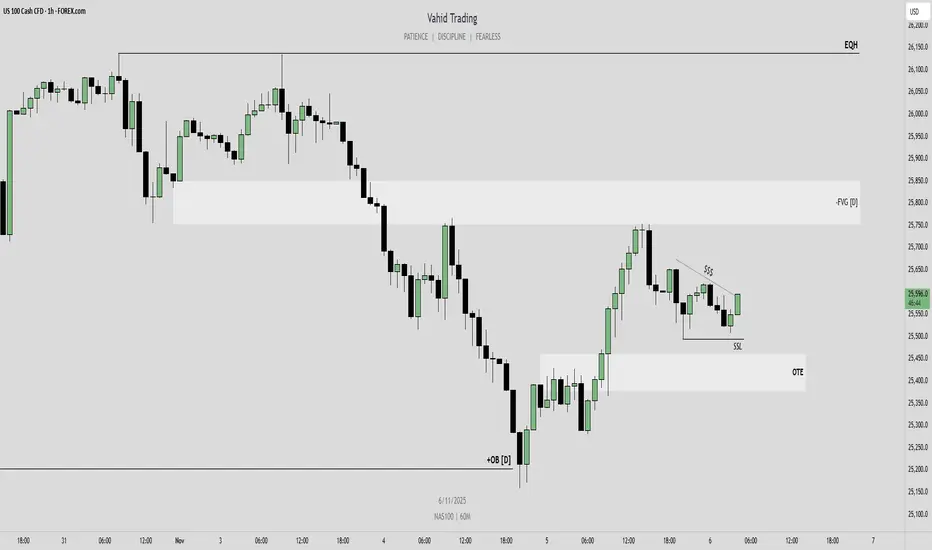
US100 – Bullish Continuation in Play After Daily OB ReactionHello traders,
On the 1-hour chart, NASDAQ (US100) has reacted strongly from the bullish Daily Order Block, showing clear signs of higher-timeframe strength. This reaction suggests that the bullish order flow is still intact.
With this structure in mind, I expect the upward move to continue toward the bearish Daily Fair Value Gap, which serves as my first target.
My final target for this bullish leg is the equal highs around 26,136, where a significant liquidity pool rests.
However, before the next expansion higher, I would prefer to see price move lower to sweep the liquidity below the recent lows and trade into an Optimal Trade Entry (OTE) zone. From there, I’ll look for lower-timeframe confirmation to catch the next leg up.
Staying bullish unless higher-timeframe invalidation occurs.
💌It is my honor to share your comments with me💌
🔎 DYOR
💡Wait for the update!
US100 Free Signal! Sell!
Hello,Traders!
US100 is expected to soon retest the horizontal supply area before continuing its bearish move toward the target zone.
---------------------
Stop Loss: 25,877$
Take Profit: 25,607$
Entry: 25,728$
Time Frame: 2H
---------------------
Sell!
Comment and subscribe to help us grow!
Check out other forecasts below too!
Disclosure: I am part of Trade Nation's Influencer program and receive a monthly fee for using their TradingView charts in my analysis.

why Us100 will Target 25800why Us100 will Target 25800
Order Flow Legs in 15 M Chart
Swing Low
CHOCH
FVG

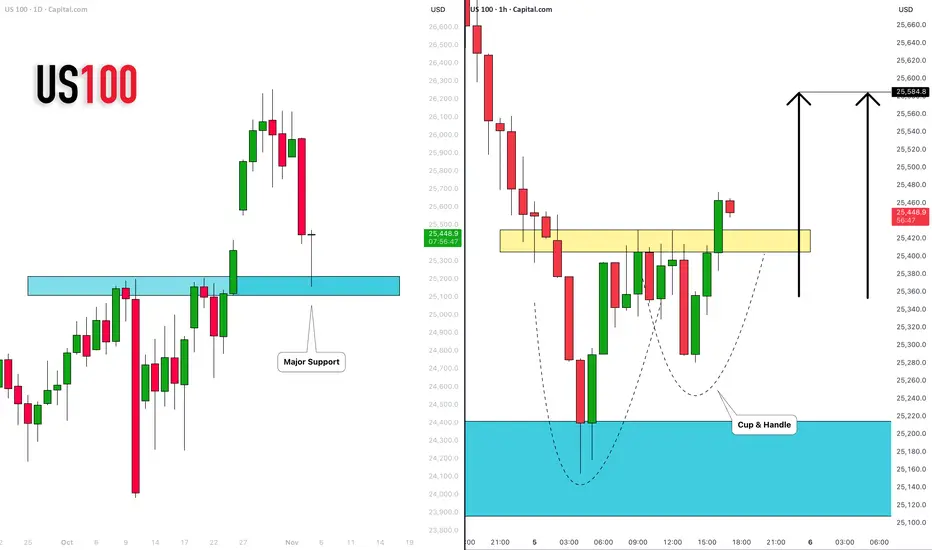
NASDAQ INDEX (US100): Time to Recover
US100 index dropped yesterday, as I predicted.
The market is recovering now, after a test of a major daily support cluster.
A formation of a cup & handle pattern on that and a breakout of its neckline
indicate a strong buying pressure.
With a high probability, the market will rise and reach 25580 level soon.
❤️Please, support my work with like, thank you!❤️
I am part of Trade Nation's Influencer program and receive a monthly fee for using their TradingView charts in my analysis.
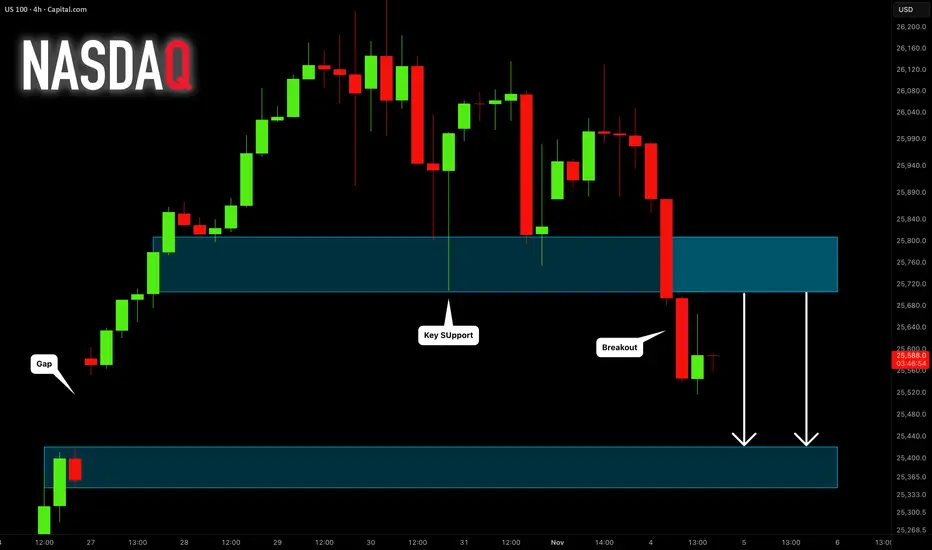
NASDAQ INDEX (US100): Forgotten Gap
A week ago, US100 formed a gap up opening.
It looks like the index is finally ready to fill it.
A breakout of a major horizontal support is a strong bearish signal.
Expect a bearish continuation to 25420.
❤️Please, support my work with like, thank you!❤️
I am part of Trade Nation's Influencer program and receive a monthly fee for using their TradingView charts in my analysis.
How to Trade NASDAQ NAS100 Retracements Into An Imbalance🚀 NASDAQ NAS100 Analysis – Watching for a Bullish Opportunity 📈
I'm currently focused on the Nasdaq NAS100. On the weekly timeframe, it remains in a strong bullish trend 💹. Recently, however, we've seen a sharp and aggressive retracement. Given that the market was overextended, this pullback is healthy and expected, as price seeks to tap liquidity pools and rebalance ⚖️.
Zooming into the 4-hour timeframe, we can clearly identify a bullish imbalance 🔹. This area serves as my key point of interest for a potential move lower. The ideal scenario is for price to hold above the imbalance low and then break structure bullishly 🔼.
Key conditions for a high-probability long trade:
Price must not break below the imbalance low 🚫⬇️
Price must establish higher highs and higher lows to confirm bullish momentum 🔝
If these conditions align, I will be looking for a long entry opportunity. ⚠️ Not financial advice – this is purely market analysis for educational purposes.

NASDAQ Channel Up still stands buy needs a pull-back.Nasdaq (NDX) reached the top of its 5-month Channel Up and got rejected. It completed a +9.59% rise from the last 1D MA50 (red trend-line) bottom (Higher Low for the pattern), similar to the previous Bullish Leg.
The maximum a Bullish Leg has increased by inside this pattern is +10.87%. As a result, either now or just above it, the pattern would require a technical pull-back. The most usual buy signal is on its 4H MA200 (orange trend-line) and the most effective when the 4H RSI breaks below its oversold (30.00) barrier.
Our next Buy Zone is within the 0.382 - 0.5 Fibonacci retracement range.
-------------------------------------------------------------------------------
** Please LIKE 👍, FOLLOW ✅, SHARE 🙌 and COMMENT ✍ if you enjoy this idea! Also share your ideas and charts in the comments section below! This is best way to keep it relevant, support us, keep the content here free and allow the idea to reach as many people as possible. **
-------------------------------------------------------------------------------
💸💸💸💸💸💸
👇 👇 👇 👇 👇 👇

NASDAQ100 HIGH PROBABILITY SETUP SOON!!!🚨 NAS100 HIGH PROBABILITY SELL/BUY SETUP 🚨
* Here We Can See Clearly The Next Potential Moves For US100 Coming Hours/Days.
* Keep Your Eyes Close On Your Trading Positions.
* Happy PIP Hunting Traders.
FXKILLA.

META Buy Opportunity – KZDZ ModelMETA Game Plan – KZDZ Model
📊 Market Sentiment
On 29/10, the FED lowered rates by 25BPS, as expected. However, Powell’s remarks added uncertainty around further cuts in December, stating that future decisions will be data-dependent.
One FED member dissented, preferring no cut this cycle — a notable shift from September’s unanimous decision.
Following this, rate-cut expectations dropped from 95% to 68%, sparking short-term bearish sentiment as traders took profits and hedged exposure.
Despite this volatility, the mid-to-long term outlook remains bullish given the broader liquidity cycle and easing policy stance.
📈 Fundamental
META earnings missed expectations, triggering a sharp sell-off. While short-term sentiment is bearish, the long-term outlook remains supported by ongoing AI development initiatives.
📈 Technical Analysis
1-Hit oversold RSI on the daily timeframe.
2-Retraced to the 0.5 Fibonacci equilibrium zone (≈ $640).
3-Tested a major HTF Key Zone around $625, signaling potential accumulation.
📘 Model in Use – Key Zone with Discount Zone (KZDZ Model)
The KZDZ Model identifies areas where discounted Fibonacci levels align with strong HTF liquidity zones, offering high-probability reversal opportunities.
1️⃣ Identify HTF Key Zone
2️⃣ Align with Discount Zone (0.5–0.75 range)
3️⃣ Look for confirmation structure on LTF
4️⃣ Execute and manage risk accordingly
📌 Game Plan
Scenario 1 (Black Path): Watch for price to hit $625 and close above $640 (daily). Upon confirmation, plan to buy C640 options targeting $680–$700.
Scenario 2 (Red Path): If price fails to reclaim $640, monitor for a deeper move to $560, then look for weekly rejection above that zone. Entry via C560 options, targeting $620–$700.
🎯 Setup Trigger
Scenario 1 → Daily close above $640 after retesting $625.
Scenario 2 → Weekly close above $560 zone.
📋 Trade Management
Scenario 1: Buy C640 Calls → take profits at $680–$700.
Scenario 2: Buy C560 Calls → partial profits $620–$640, rest at $680–$700.
Move stop to breakeven after first target is hit.
💬If this META breakdown supports your outlook, like, comment, and follow.
For deeper sentiment and strategy updates, subscribe to my Substack free access available.
⚠️ This analysis is for educational purposes only and does not constitute financial advice. Always conduct your own research before trading or investing.

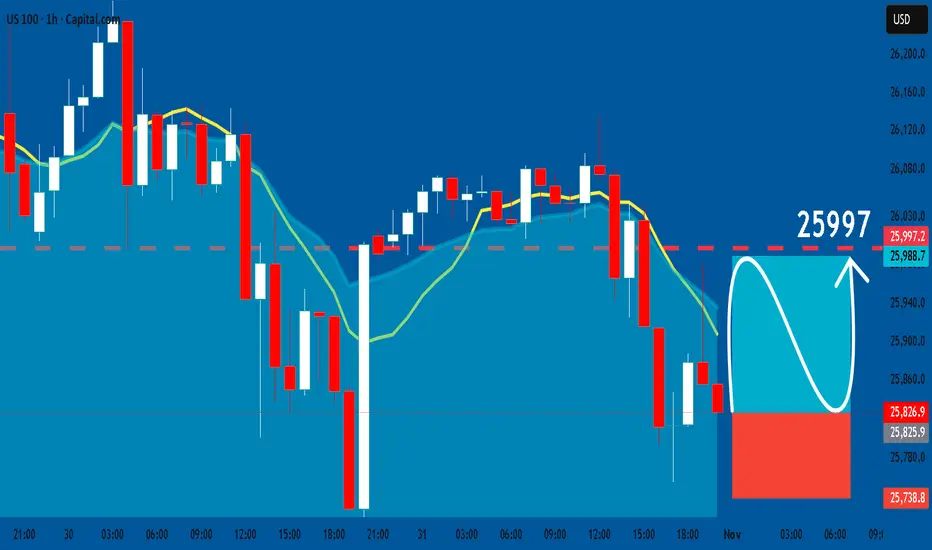
US100: Long Signal Explained
US100
- Classic bullish formation
- Our team expects pullback
SUGGESTED TRADE:
Swing Trade
Long US100
Entry - 25826
Sl - 25738
Tp - 25997
Our Risk - 1%
Start protection of your profits from lower levels
Disclosure: I am part of Trade Nation's Influencer program and receive a monthly fee for using their TradingView charts in my analysis.
❤️ Please, support our work with like & comment! ❤️