NAS100 - Stock Market, Waiting for a Decisive Week?!The index is above the EMA200 and EMA50 on the four-hour time frame and is in its long-term ascending channel. As long as the Nasdaq is in its range, you can be a seller at the top of the range and a buyer at the bottom. If this range is broken, you can look for new trends in the Nasdaq.
The U.S. Bureau of Labor Statistics (BLS) announced that the Consumer Price Index (CPI) report for September 2025 will be released on Friday, October 24 at 8:30 a.m. New York time (4:00 p.m. Tehran time). This release comes as most other economic data have been delayed due to the ongoing federal government shutdown, which has suspended normal operations.
The CPI report is particularly important for the U.S. Social Security Administration, as it serves as the basis for calculating annual adjustments to retirement benefits and other statutory payments.
In a statement released on Friday, the agency confirmed that it would temporarily recall a limited number of furloughed employees to ensure the timely publication of the CPI report. Originally scheduled for October 15, the release has now been rescheduled for October 24.
This CPI release will be among the few remaining economic datasets published by federal agencies during the shutdown. Since October 1, most data-producing institutions have ceased operations amid political deadlock between Democrats and Republicans that has halted large portions of federal services.
With the federal shutdown continuing, U.S. markets are increasingly relying on private-sector data to gauge the state of the economy. In the upcoming week, indicators such as housing sales and private manufacturing surveys will be released, serving as alternative references for traders and analysts.
Without access to official government data, investors, businesses, and consumers face a heightened level of uncertainty, making it difficult to plan for spending, hiring, and saving decisions.
The CPI report could play a crucial role in shaping the Federal Reserve’s monetary policy decisions, as the FOMC will have access to the data ahead of its October 28–29 policy meeting. Fed officials are currently debating whether to cut interest rates further, and if so, how quickly.
In September, the Federal Reserve lowered its benchmark interest rate to support a weakening labor market by reducing borrowing costs across short-term loans. Another rate cut is widely expected in October, though elevated inflation could slow or prevent further easing.
The Chief Financial Officer of Bank of America (BOFA) stated that the bank expects two additional rate cuts by the Fed before the end of this year.
Meanwhile, Fed Chair Jerome Powell recently warned about downside risks to the labor market, sparking speculation that he might have had early access to the yet-unreleased September employment report. However, a closer examination of his remarks shows no confirmation or denial of such access.
The key takeaway from Powell’s speech was his firm reaffirmation of market expectations for a rate cut later this month, delivered without any sign of hesitation or opposition — a clear and confident signal to investors.
In another commentary, Bank of America highlighted that the current boom in AI data centers is fundamentally different from the dot-com bubble of the early 2000s. The bank attributed today’s expansion to strong semiconductor utilization, healthy cash flows, lower valuations, and a more favorable interest rate environment.
Nonetheless, it acknowledged ongoing concerns about excessive spending and stretched valuations in certain AI sectors.
Finally, the October Bank of America investor survey revealed that recession fears have fallen to their lowest level since February 2022, while optimism about economic growth has seen its strongest jump since 2020:
• 33% expect a “no-landing” scenario (up from 18%)
• 54% foresee a “soft landing” (down from 67%)
• 8% anticipate a “hard landing” (down from 10%).
Us100
US100 A Fall Expected! SELL!
My dear friends,
Please, find my technical outlook for US100 below:
The instrument tests an important psychological level 24.863
Bias - Bearish
Technical Indicators: Supper Trend gives a precise Bearish signal, while Pivot Point HL predicts price changes and potential reversals in the market.
Target - 24.615
About Used Indicators:
Super-trend indicator is more useful in trending markets where there are clear uptrends and downtrends in price.
Disclosure: I am part of Trade Nation's Influencer program and receive a monthly fee for using their TradingView charts in my analysis.
———————————
WISH YOU ALL LUCK
US100 Bearish Bias!
HI,Traders !
#US100 keeps growing
But a horizontal resistance
Level of 25039.3 is nearby
So after the retest of the
Level we will be expecting
A local bearish correction
On Monday !
Comment and subscribe to help us grow !

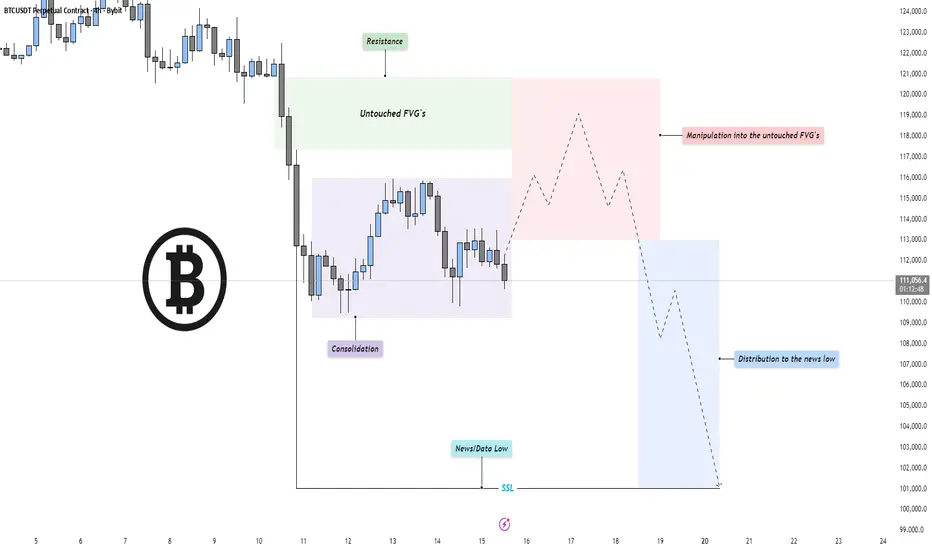
BTC - Perfect Power of 3 setup!Market Context
Bitcoin has entered a phase of compression after an extended bearish leg, with price currently consolidating near recent lows. The previous selloff created a clean structure of inefficiencies and untouched fair value gaps (FVGs) above, now acting as potential magnet zones for short-term retracements. The broader context remains bearish until those imbalances are efficiently mitigated.
Fair Value Gaps & Manipulation Zones
A clear pocket of untouched FVGs sits above the current range, aligning with resistance from prior breakdown points. Price could engineer a manipulation move into this zone, enticing late buyers before resuming the macro bearish direction. Such a move would serve as a liquidity grab and offer premium pricing for distribution before continuation lower.
Liquidity Dynamics
The market structure shows resting sell-side liquidity (SSL) below the recent “news/data low,” marked as a potential target for a deeper sweep. Once manipulation into the upper inefficiencies completes, the market could shift momentum to the downside, distributing into that liquidity and seeking new lows for rebalancing.
Final Thoughts
The current structure points toward a classic bearish continuation setup: consolidation, manipulation into premium inefficiencies, and a drive toward sell-side liquidity. Unless price breaks decisively above the untouched FVG chain, the expectation remains for a redistribution phase leading into the news low or beyond.
If this breakdown helped frame your bias, a like goes a long way — do you think price runs the FVG first, or dives straight into the liquidity below?
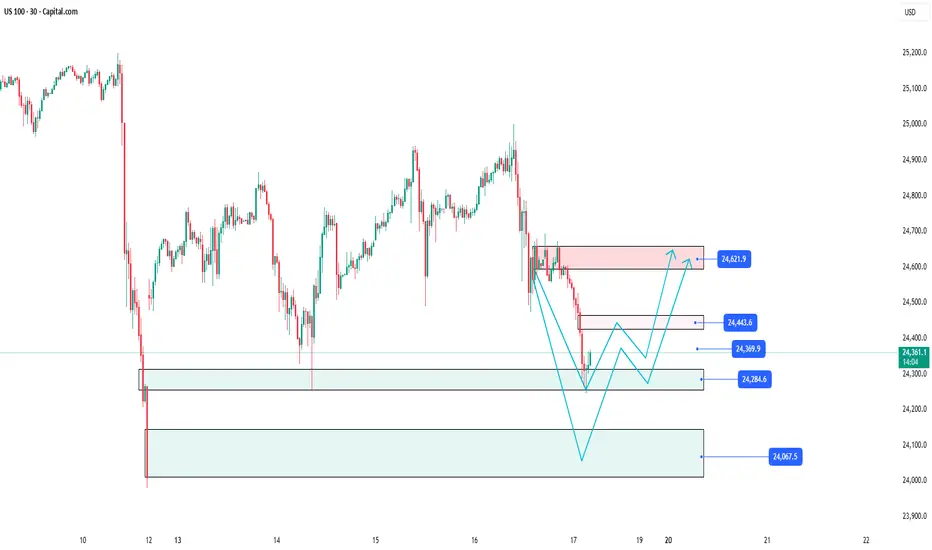
US100: Price action around important imbalance📊 SKILLING:US100 Analysis: Detailed trading scenario at key price level 24,443.6 🚀
The US 100 30-minute chart is currently illustrating a clear picture of price movements with significant support and resistance zones. At the moment, the price is undergoing a strong correction after a deep decline and is approaching crucial price areas, creating multiple potential trading opportunities for investors.
________________________________________
Support Zone 24,284.6 – The starting point for a potential bounce 💥
Currently, the price is nearing the technical support level around 24,284.6 – a key support area that is expected to hold considerable buying interest, potentially triggering a short-term bounce. Buyers may step in here to prevent further declines and initiate a recovery trend.
Careful observation of price action around this zone is essential as it will determine the market’s next momentum: whether the price will rebound or break lower.
________________________________________
Immediate Resistance Levels and the Imbalance Zone at 24,443.6 🔍
Following a bounce from the 24,284.6 support, the expected scenario is a gradual move upwards to test important resistance levels:
• First at 24,369.9, where initial selling pressure may emerge, challenging the upward momentum.
• Next at 24,443.6, identified as a significant imbalance zone on the chart — a price level where price previously moved rapidly, creating a notable supply-demand gap.
• This zone acts as a technical “wall,” a crucial checkpoint before the price can continue its upward trend or get pushed back down.
________________________________________
Detailed Price Movement Scenario 🔄
1. Price bounces from the support at 24,284.6, setting the stage for a recovery leg.
2. Price moves up to test the first resistance at 24,369.9; the reaction here indicates the buyers’ strength.
3. Price then challenges the imbalance zone at 24,443.6 — where significant selling pressure may occur.
4. At this level, two scenarios may unfold:
• Price breaks above 24,443.6, confirming the uptrend and targeting the next resistance at 24,621.9.
• Price rejects this zone, leading to selling pressure that pushes price back to retest the 24,284.6 support or even lower.
________________________________________
Downside scenario if support at 24,284.6 fails 🛡️
In the worst case, if price breaks below the crucial support at 24,284.6, further declines toward a broader support zone at 24,067.5 are likely. This level may act as the next key area for price stabilization and buyer interest before any potential rebound.
Please like and comment below to support our traders. Your reactions will motivate us to do more analysis in the future 🙏✨
Harry Andrew @ ZuperView
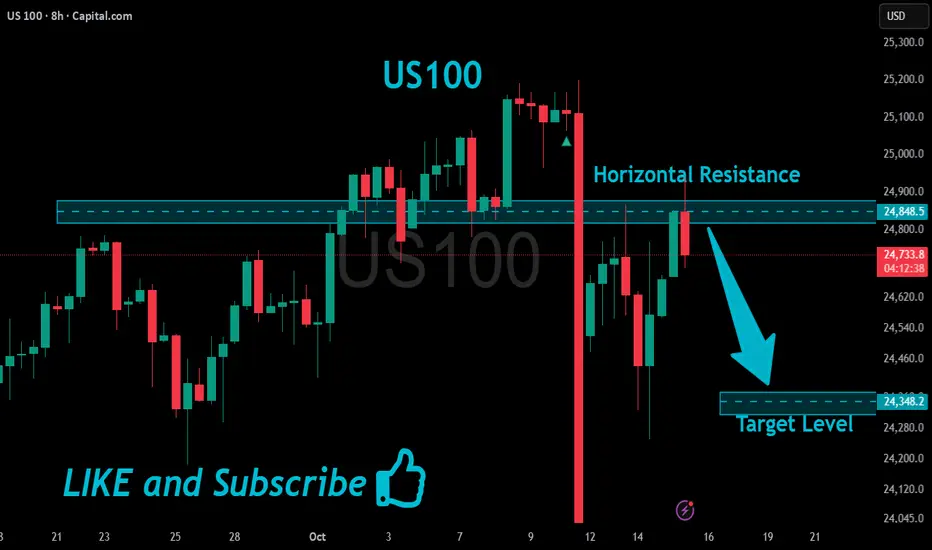
US100 Local Bearish Pullback Expected!
HI,Traders !
#US100 is hit A strong horizontal resistance
Level of 24848.5 after a sharp
Push upwards by the bulls
So a local correction is needed
From the resistance with the
Expected target being the
Local level below at 24348.2 !
Comment and subscribe to help us grow !
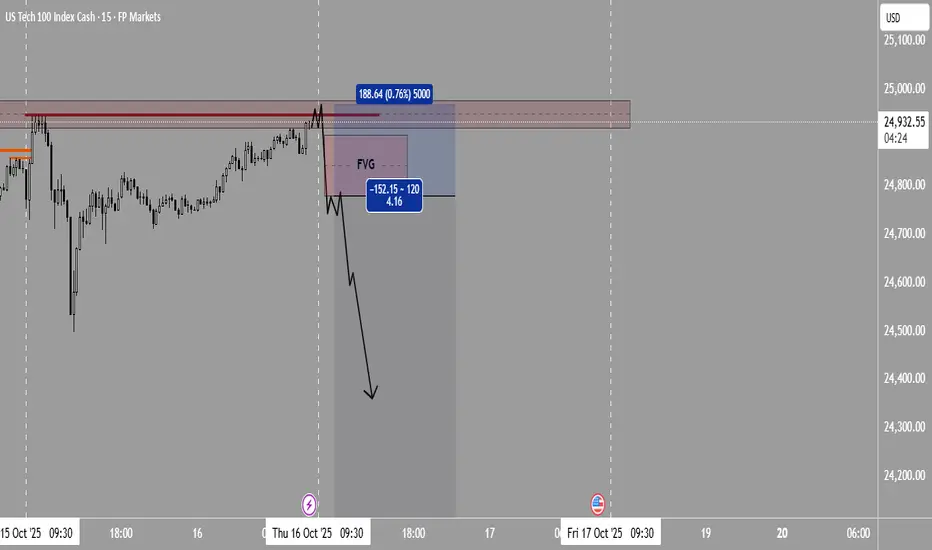
I’m getting ready for potential short position |October 16 2025If today the price goes up and hunts the high from 10 AM yesterday (New York time) — meaning it grabs the liquidity and takes out the stops above that level — and then forms a bearish Fair Value Gap (FVG) followed by signs of weakness or a rejection structure (like a lower-timeframe break, divergence, or bearish confirmation candle), that scenario would be one of the best short setups of the day.
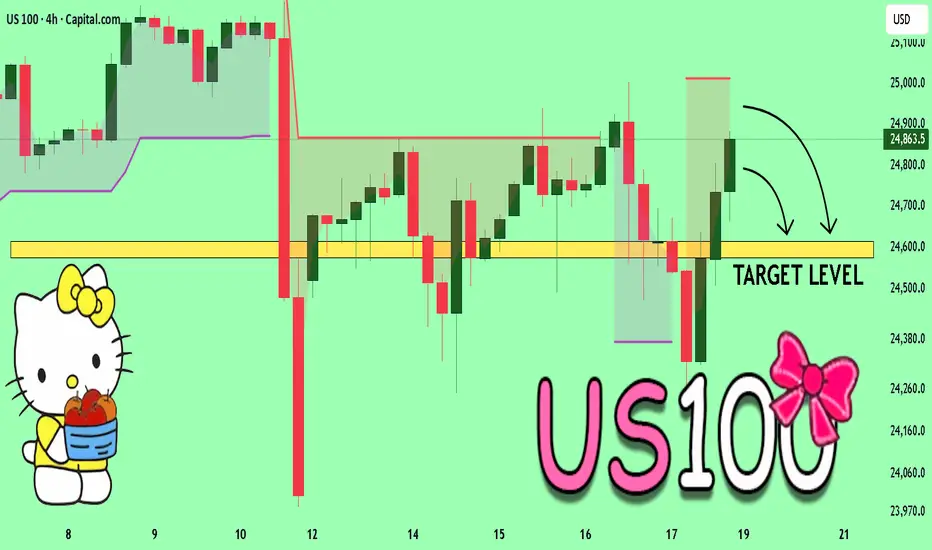
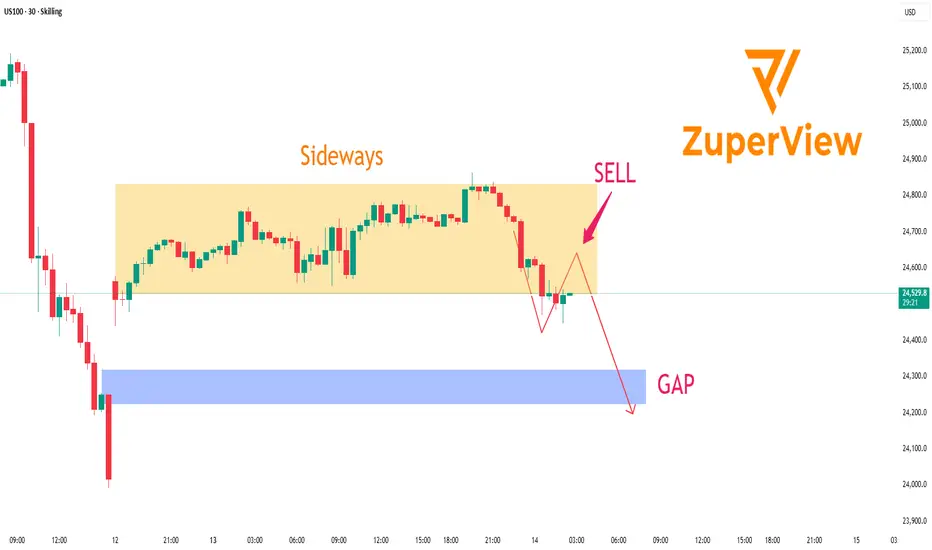
US100: Pullback to fill the GAP below
🧩 SKILLING:US100 – Pullback scenario targeting the GAP support zone
📊 30-Minute Chart Analysis
On the 30-minute timeframe, US100 is showing signs of a short-term corrective move after failing to hold its previous support zone.
Price is currently trading below the Trend indicator’s resistance area, suggesting that sellers have regained temporary control.
After a strong drop, the market is forming a technical pullback to retest the resistance zone. This is often where traders look for opportunities to continue following the prevailing bearish momentum.
________________________________________
🧭 Trading Scenario (For Analysis Purposes Only)
• Potential SELL Zone: 24,650 – 24,740 (resistance and Trend zone)
• Target Area: 24,250 – 24,350 (GAP support area below)
• Invalidation Level: Above 24,750 — if price closes above this level, the short-term bearish structure could be invalidated.
________________________________________
🔎 Technical Outlook
• Short-term trend: Bearish
• Market structure: Forming a pullback–continuation pattern
• Trend indicator: Has flipped bearish, confirming renewed selling pressure
• GAP support: Likely to act as a key area for potential stabilization or reaction from buyers
________________________________________
⚠️ Important Note
This analysis is for educational and informational purposes only and should not be considered financial advice.
Traders should combine this view with their own risk assessment, price action, and macroeconomic context before making any trading decisions.
________________________________________
💡 Summary:
US100 is in a short-term correction phase. If price continues to reject the 24,700 resistance area, the downside scenario toward the 24,250–24,350 GAP support zone remains valid.
________________________________________
Please like and comment below to support our traders. Your reactions motivate us to do more analysis in the future 🙏✨
Harry Andrew @ ZuperView
US100: Breakout signals a strong second bullish leg🧩 Market Context
On the 30-minute chart, SKILLING:US100 index shows renewed bullish momentum after a phase of sideways consolidation. Following a deep correction, price action has started forming higher highs and higher lows, suggesting that buyers are gradually regaining control.
🔍 Price Structure and Breakout
Price has recently broken out above a short-term consolidation zone and a rising trendline.
This breakout reinforces the short-term bullish bias and could mark the start of a second upward leg in the current recovery.
Statistically, when a breakout happens after tight accumulation, the next bullish leg often becomes equal to or larger than the previous one, as momentum builds and buyers gain confidence.
📈 Key Price Levels
• Resistance 1: 24,914 – prior rejection zone in the last upward move.
• Resistance 2: 25,074 – distribution area before the previous drop.
• Support: 24,700 – 24,750 (former resistance now acting as potential support).
⚙️ Trading Scenarios (for observation only)
• After the breakout, price may retest the previous resistance zone (around 24,700–24,750) before continuing higher.
• If buyers defend this level, the second bullish leg could extend toward 24,914 and possibly 25,074.
• Conversely, a close back below 24,700 may trigger a deeper pullback before any continuation attempt.
🧠 Summary
The technical structure on US100 favors a short-term bullish outlook. A successful retest of the breakout zone could pave the way for a second upward leg, potentially matching or exceeding the size of the previous rally.
______________________________________
📌 This analysis is for educational and technical purposes only. It does not constitute financial advice or a recommendation to buy or sell any asset.
Please like and comment below to support our traders. Your reactions will motivate us to do more analysis in the future 🙏✨
Harry Andrew @ ZuperView

NSDQ100 Oversold bounce back supported at 243761. Volatile Sentiment
Markets have whipsawed since Friday due to shifting US-China trade tensions.
In the last 24 hours, the S&P 500 swung from -1.5% to +0.4% intraday, closing just slightly down (-0.16%), highlighting fragile sentiment.
2. Fed Chair Powell’s Dovish Tone
Powell signaled a likely 25bps rate cut this month, citing soft hiring trends.
His dovish comments helped tech stocks and boosted risk appetite, especially in the second half of the US session.
3. Trump’s Trade Escalation Comments
Trump accused China of not buying soybeans and hinted at ending trade involving cooking oil and other goods.
These late comments undermined risk sentiment, reversing some of Powell's support.
4. Sector Performance
S&P Financials (+1.12%) outperformed on Q3 bank earnings.
Consumer Staples (+3.04%) also led, reflecting a defensive shift amid headline risk.
Tech was more volatile but held up on Powell’s policy support.
5. ECB Commentary
Villeroy hinted at rate cuts, while Makhlouf expressed inflation concerns, showing a split in ECB tone.
This may add uncertainty for European tech sentiment impacting US tech peers.
Takeaway for Nasdaq-100 Today
Supportive Fed signals are a tailwind for tech, but geopolitical risks (US-China) are keeping markets jumpy.
Expect headline-driven volatility to remain high.
Focus on big tech earnings, bond yields, and any new trade developments for direction.
Key Support and Resistance Levels
Resistance Level 1: 24908
Resistance Level 2: 25050
Resistance Level 3: 25200
Support Level 1: 24376
Support Level 2: 24205
Support Level 3: 23920
This communication is for informational purposes only and should not be viewed as any form of recommendation as to a particular course of action or as investment advice. It is not intended as an offer or solicitation for the purchase or sale of any financial instrument or as an official confirmation of any transaction. Opinions, estimates and assumptions expressed herein are made as of the date of this communication and are subject to change without notice. This communication has been prepared based upon information, including market prices, data and other information, believed to be reliable; however, Trade Nation does not warrant its completeness or accuracy. All market prices and market data contained in or attached to this communication are indicative and subject to change without notice.

US100 Bearish Breakout!
HI,Traders !
#US100 made a bearish
Breakout of the key
Horizontal level of 24795.7
Which is now a resistance
And the breakout is confirmed
So after the potential pullback
And retest we will be expecting
A further bearish move down !
Comment and subscribe to help us grow !

NASDAQ INDEX (US100): Bearish Outlook Explained
US100 stopped growing after a test of the underlined intraday horizontal supply zone.
A formation of a bearish engulfing candle after its test suggests a strong
bearish pressure from that.
I think that the market will drop at least to 24030 level.
❤️Please, support my work with like, thank you!❤️

us100 looking weak us100 looking weak, expecting bearish rally towards descending trend line, and if it could not hold trend line, then we may see deeper correction in us100

NASDAQ NAS100 Trade Plan: VWAP & Volume Profile StrategyI’m currently watching the NASDAQ #100 (#NDX) 📊. After a strong correction due to geopolitical turmoil 🌍, the market rebounded just as aggressively. Right now, price is trading above VWAP 📈. If it stays above VWAP, I’ll be looking for a long opportunity.
In the video, we zoom into a 30-minute timeframe ⏱️, using VWAP and Volume Profile to plan the trade. If price respects these levels, we can take a long. If it falls below the support level ❌, we abandon this idea.
⚠️ Disclaimer: This is for educational purposes only and not financial advice.

Trader vs Gambler: Why Trading Isn’t GamblingThe Trader vs The Gambler: Why Trading Isn’t Gambling
“Trading is gambling.”
You’ve probably heard it before — from friends, family, or strangers who’ve seen a few flashy headlines, red charts, and crypto hype videos and decided: “It’s all luck.”
To most outsiders, the markets look like chaos — numbers flashing, candles flying, influencers shouting “BUY!” and “SELL!” as emotions run high.
It’s understandable that they think it’s all random chance.
But here’s the truth:
Trading can look like gambling when it’s done like gambling.
When done properly — with education, discipline, and structured risk — trading is a profession built on probability, process, and data.
What Trading Actually Is
Trading is the art and science of buying and selling assets — currencies, commodities, crypto, or stocks — to profit from price movements.
But unlike gambling, trading involves skill, timing, and measurable probabilities.
Professional traders don’t rely on hope — they rely on edges.
An edge is a repeatable setup or condition that statistically produces profits over time.
A real trader studies and uses:
- Price Action & Market Structure: Recognizing higher highs, liquidity zones, supply and demand, and where big players enter or exit.
- Technical Analysis : Tools like moving averages, Fibonacci retracements, volume profiles, VWAP, trendlines, and fair value gaps.
- Fundamental Analysis: Macro data, interest rates, inflation, earnings, tokenomics, project development, and regulatory events.
- Sentiment & Flow: Gauging crowd emotion, open interest, whale activity, and on-chain data.
- Risk Management: Strict position sizing, stop-loss placement, and capital preservation.
- Statistics & Journaling: Tracking setups, win rates, risk-to-reward, and performance over hundreds of trades.
- Discipline & Emotional Control: The ability to not trade when conditions aren’t right.
A trader doesn’t ask, “Will it go up?”
They ask, “If it goes up, what’s my risk? What’s my probability? What’s my plan if I’m wrong?”
That’s not gambling — that’s probability management.
What Gambling Actually Is
Gambling is risking money on an uncertain outcome without any control, edge, or process.
You rely purely on luck — a spin of a wheel, a flip of a card, a random move in a market you don’t understand.
The outcome is fixed against you. In a casino, the house always wins.
A gambler thinks emotionally:
“I have a feeling it’ll go up.”
“My mate said this coin’s going to explode.”
“I’ll double my bet to win it back.”
No analysis. No backtesting. No data. No control.
Just hope — the same force that keeps casinos rich and players broke.
When someone dumps $10,000 into a random altcoin because they saw a tweet or meme, that’s not trading — that’s emotional speculation.
They’re not following a plan; they’re following a crowd.
The Trader’s Mindset vs The Gambler’s Mindset
TRADER:
- Decision Basis: > Data probabilities, confluences
- Goal: > Consistent Long-term growth
- Risk Control: > Defined, Limited, Pre-set
- Emotional State: > Patient, Detached, Focused
- Reaction to loss: > Reviews plan, learns, adjusts
- Education: Studies psychology, risk, analysis
- Funding approach: > Scales up, uses funded accounts
GAMBLER:
- Decision basis:> Emotion, impulse, hype
- Goal: > Quick jackpot
- Risk control: > Undefined, often all-in
- Emotional state: > Fearful, greedy, erratic
- Reaction to loss : > Doubles down or quits
- Education: > Follows noise & influencers
- Funding approach: > Risks personal savings recklessly
A gambler sees “one trade” as the make-or-break moment.
A trader sees “one trade” as part of a thousand trades that define their edge.
Example: The Math of a Trader vs a Gambler
Trader:
Win rate: 55%
Risk-to-reward: 1:2
Risking 1% per trade
After 100 trades, they’re up roughly +55R - 45R = +10R (10% growth).
Their plan, consistency, and edge made it possible.
Gambler:
Win rate: Random, maybe 45%.
Risk-to-reward: 1:1 or worse.
Risking 10–20% per “bet.”
After a handful of losses, they’re wiped out.
There’s no math, no longevity — just emotional chaos.
This is why traders survive, gamblers vanish.
Why Trading Is Not Gambling
1. Trading Has Positive Expected Value (EV)
Gamblers play games with negative EV — odds mathematically stacked against them.
Traders create systems with positive EV by identifying patterns that statistically outperform random chance.
Example:
If your setup wins 55% of the time and earns twice what it risks, your long-term outcome will always be positive.
That’s not luck — that’s math.
2. Trading Has Risk Management
In gambling, you can lose everything on one hand.
In trading, you risk a small percentage per trade.
Professionals risk 0.5–2% of their account per setup.
That’s why they can lose 10 trades in a row and still be in the game.
Gamblers can’t — they blow up because they never manage risk.
3. Trading Uses Control and Data
You can’t “analyze” a roulette spin. You can’t manage risk at a blackjack table.
But in trading, you can backtest, strategize, and control your exposure.
Markets may be uncertain, but traders control their actions within that uncertainty.
Gambling has no such control — it’s fixed odds, rigged in favor of the house.
4. Trading Rewards Skill and Experience
The more you study, journal, and refine your process, the better you get.
No amount of practice makes you better at roulette — the wheel doesn’t care.
But trading rewards time, reflection, and discipline.
Skill matters. Patience matters. Data matters.
5. Trading Has Funding Opportunities
No casino will give you $50,000 to “gamble responsibly.”
But trading firms will give you a $50K, $100K, or $200K funded account — if you prove consistency and discipline.
Funded trading isn’t luck; it’s a business.
You’re rewarded not for profits alone, but for following rules:
- Max daily drawdown
- Overall drawdown limits
- Minimum trading days
- Profit targets
That’s structure — something gambling never has.
Why Use a Funded Account Instead of Your Own $50K?
Because professional trading is not about flexing capital — it’s about proving control.
Funded accounts are training grounds for serious traders:
- You trade with someone else’s capital.
- You’re held accountable to strict limits.
- You’re paid for consistency, not luck.
That’s professionalism.
Gambling is the opposite — no structure, no accountability, and no risk control.
A gambler risks $50K of their own money and hopes for a jackpot.
A trader risks 0.5% of a $50K funded account with a defined plan.
One burns out in a week.
The other builds a track record and earns a living.
The Reality Check: When Trading Does Become Gambling
Trading becomes gambling when:
- You trade without a plan.
- You follow hype or influencers blindly.
- You over-leverage.
- You revenge-trade.
- You skip journaling and analysis.
- You ignore stop losses.
The activity isn’t gambling — the mindset is.
A professional can take the same tool a gambler uses — the same chart, same exchange, same coin — and produce consistent returns, because their intent, process, and control are different.
Real-World Example
Two people open Bitcoin trades at $60,000.
- Trader A: Risks 1%, sets stop at $59,000, target $62,000. Reviews structure, confluences, and volume.
- Trader B: Risks 100% of his savings because “it’ll go up for sure.”
Same entry, same price.
One plays a game of probability, the other a game of hope.
One grows, one disappears.
The chart doesn’t decide who wins — their mindset does.
The Trader’s Mindset
A real trader thinks like a scientist:
- Hypothesis: If price rejects support and volume confirms, it may move up .
- Experiment: Enters small, stops defined.
- Result: Win or loss logged.
- Iteration: Reviews data, improves setup.
Gamblers don’t have hypotheses — they have feelings.
The trader’s mindset is structured:
- Plan before execution.
- Accept losses as data.
- Control risk religiously.
- Focus on consistency over excitement.
Detach emotionally from outcomes.
That’s why traders survive long-term while gamblers chase short-term highs.
“But Crypto Is Just Gambling!”
Crypto can look like gambling — because most people in it treat it like one.
They buy hype, ignore fundamentals, and chase every new shiny coin.
That’s not trading.
Real crypto traders:
- Study tokenomics, development teams, and market sentiment.
- Use technical levels and liquidity maps.
- Manage position sizes and hedge exposure.
- Treat it like a business, not a casino.
The asset class doesn’t make it gambling — your approach does.
Final Thoughts
Yes — both trading and gambling involve risk.
But risk ≠ gambling.
Risk, when managed correctly, equals opportunity .
The difference is control, process, and purpose.
A trader plays the long game with discipline and math.
A gambler plays for emotion and chance.
Anyone can click Buy.
But not everyone can manage risk, follow process, and think in probabilities.
So next time someone says:
“Trading is gambling.”
Show them this:
🎲 Gambling is random.
📊 Trading is calculated.
One depends on luck .
The other depends on discipline .
Thank you all so very much for reading this article, I enjoyed creating it and I hope it becomes of use too you.
If you have any requests on strategies, articles or would like charting done, drop a comment below.
NASDAQ Did the 1D MA50 just save the day??Nasdaq (NDX) suffered a historically strong daily sell-off on Friday following President Trump's tariff threats and touched (and closed on) its 1D MA50 (blue trend-line).
Last time it hit that trend-line was on September 02 and that was a technical Higher Low on the 5-month Channel Up. Friday's Low was also very close to the bottom of this pattern. At the same time the 1D RSI hit and rebounded on its Lower Lows Support trend-line.
With the market rebounding and opening considerably higher today, it is more likely technically that we have started the pattern's new Bullish Leg. With the last two such sequences rising by at least +11.00%, we expect a new similar uptrend, which as long as the 1D MA50 holds, could hit at least 26000 within a 40 day horizon.
-------------------------------------------------------------------------------
** Please LIKE 👍, FOLLOW ✅, SHARE 🙌 and COMMENT ✍ if you enjoy this idea! Also share your ideas and charts in the comments section below! This is best way to keep it relevant, support us, keep the content here free and allow the idea to reach as many people as possible. **
-------------------------------------------------------------------------------
💸💸💸💸💸💸
👇 👇 👇 👇 👇 👇

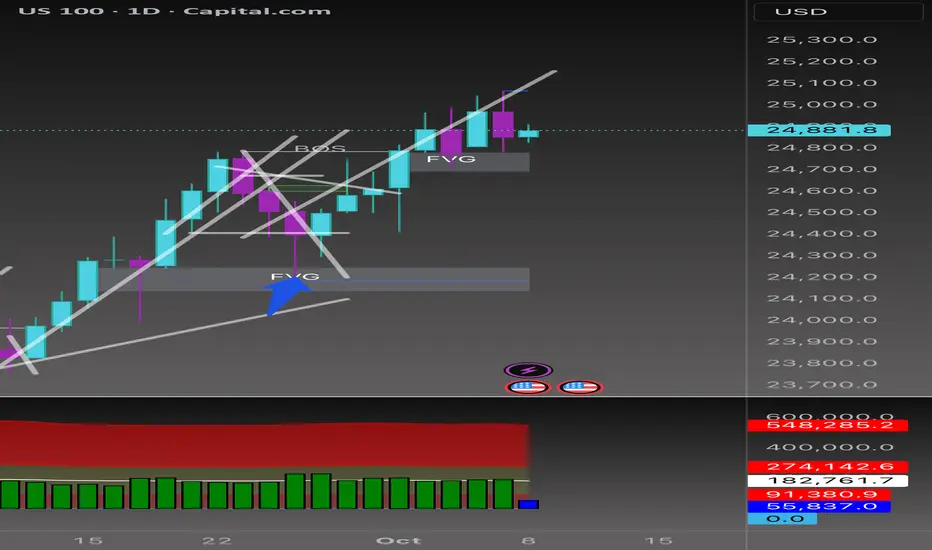
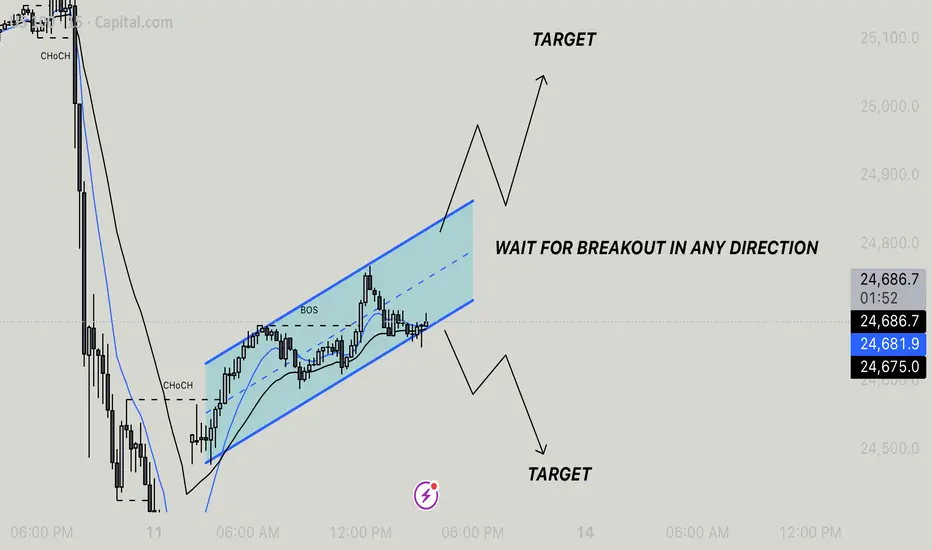
Us100 - Breakout Setup In PlayThe market has formed a rising channel after a significant bullish reversal marked by a Change of Character (CHoCH) and a Break of Structure (BOS). Price is currently consolidating near the midline of the ascending channel.
🔍 Key Insight:
We're in a wait-and-watch zone — a breakout from this channel in either direction could set the tone for the next move.
Trading Plan:
Upside Breakout: Watch for a breakout above the upper boundary of the channel with strong bullish momentum. Target the projected move equal to the height of the channel.
Downside Breakout: If price breaks below the lower channel support, expect a potential bearish move toward the lower target zone marked on the chart.
Important: Wait for a clear breakout and confirmation before entering a trade. Avoid entering inside the channel to minimize risk from false moves.
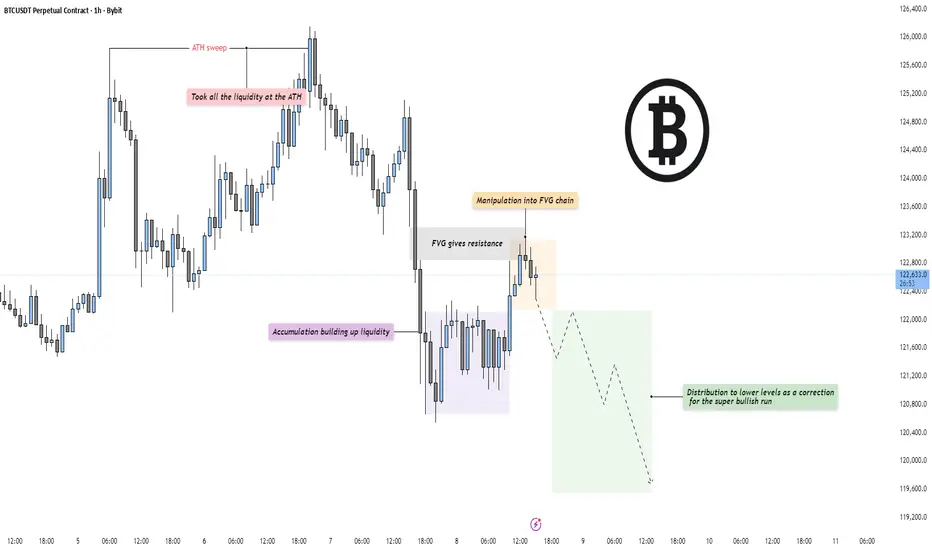
BTC - Distribution after ATH sweepMarket Context
Bitcoin has completed a clear liquidity sweep at the all-time high (ATH) and is now transitioning into a corrective phase. After taking all the liquidity above the prior high, price aggressively rejected and shifted structure to the downside, signaling that smart money may now be engineering a retracement. The move lower has found a temporary pause within a lower accumulation zone where liquidity is rebuilding.
Fair Value Gaps & Manipulation
Following the ATH sweep, price manipulated back into a fair value gap (FVG) chain, where it met resistance. This area acted as a precise reaction point, rejecting further bullish attempts and confirming the FVG as an active supply zone. Each touch into this chain has resulted in lower highs, supporting the idea that distribution is underway. The fair value gaps below are likely to be targeted next as price seeks efficiency.
Liquidity Dynamics
Liquidity above has already been collected — the current draw now lies beneath. The accumulation zone below current price holds resting sell-side liquidity, and the market could aim to fill those inefficiencies before finding new demand. A retracement into these lower levels would act as a healthy correction to the prior bullish impulse, maintaining structural balance.
Final Thoughts
The market has shifted from an aggressive expansion phase to a potential distribution stage. With liquidity taken at the highs and FVGs now providing resistance, the bias leans toward a corrective move lower before any renewed bullish continuation. A break below the local accumulation floor would confirm deeper targets.
If this breakdown helped clarify the current BTC structure, a like is always appreciated — and let me know: are you positioning for the correction, or waiting for the next bullish leg to form?
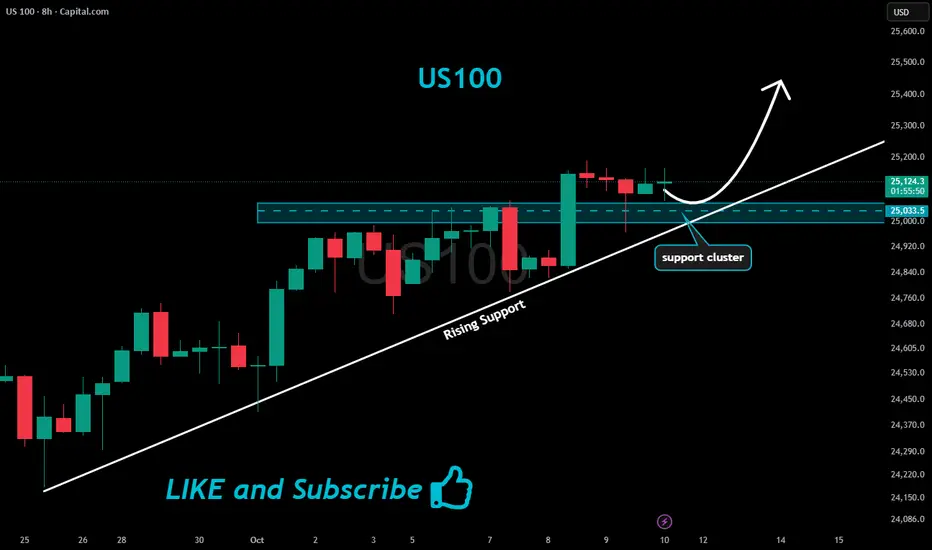
US100 Will Keep Growing!
HI,Traders !
#US100 is trading in an
Uptrend and broke
The key horizontal level
Of 25033.5 and the breakout
Is confirmed so after a potential
Retest of the support cluster
Of the rising and horizontal
Support lines below we will
Be expecting a bullish continuation !
Comment and subscribe to help us grow !
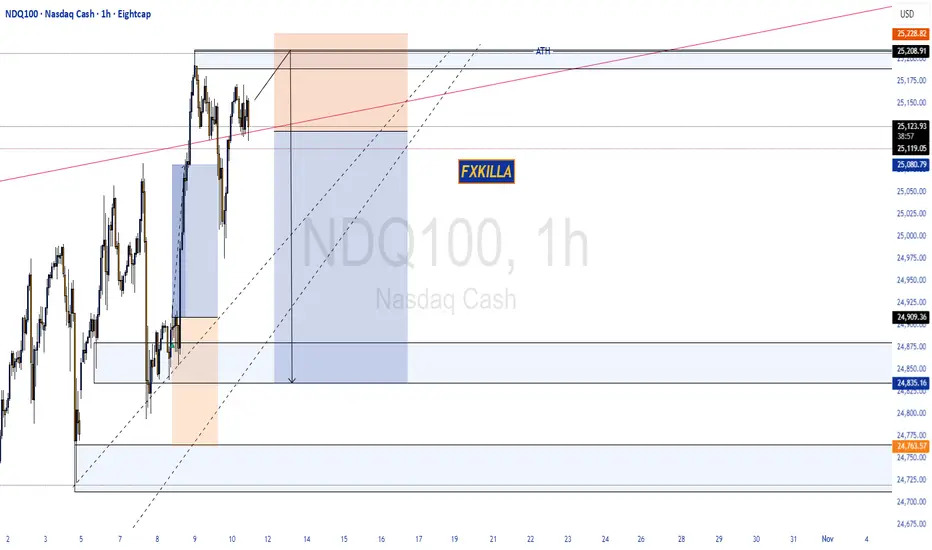
NASDAQ100 HIGH PROBABILITY SETUP SOON!!!🚨 NAS100 HIGH PROBABILITY SELL SETUP 🚨
* Here We Can See Clearly The Next Potential Move For US100 Coming Hours/Days.
* Keep Your Eyes Close On Your Trading Positions.
* Happy PIP Hunting Traders.
FXKILLA.

NASDAQ BearishSince creating ATH earlier today, the index has come crushing down and there is a change in character, switching to bearish.
I do anticipate that the price might have pullback, before we continue going south

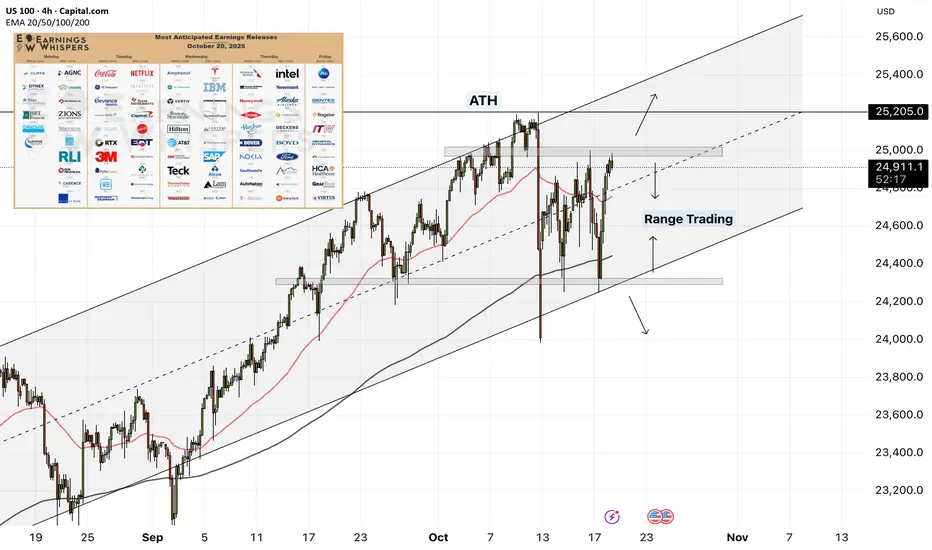
Beyond the Chart - NAS100 Through Technicals & FundamentalsCAPITALCOM:US100 US100 | Trendline + FVG Setup 🎯
Trend’s still bullish short-term, but momentum’s fading rejection hit right inside that upper FVG.
Below 24,920–25,000, I’m eyeing a pullback toward 24,760s for liquidity sweep.
🔥 Rejection + imbalance fill = bearish continuation on deck.
CPI, PPI & shutdown talks = fuel for volatility this week.