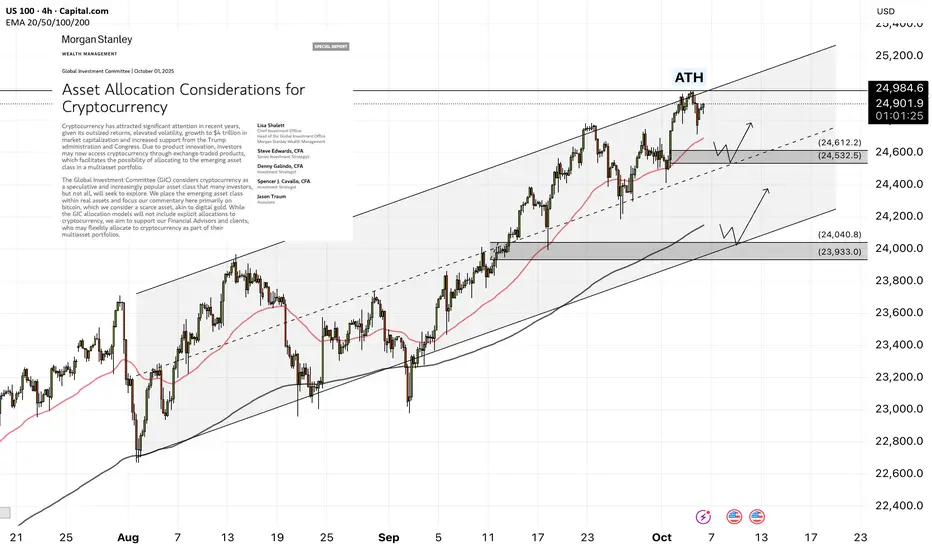
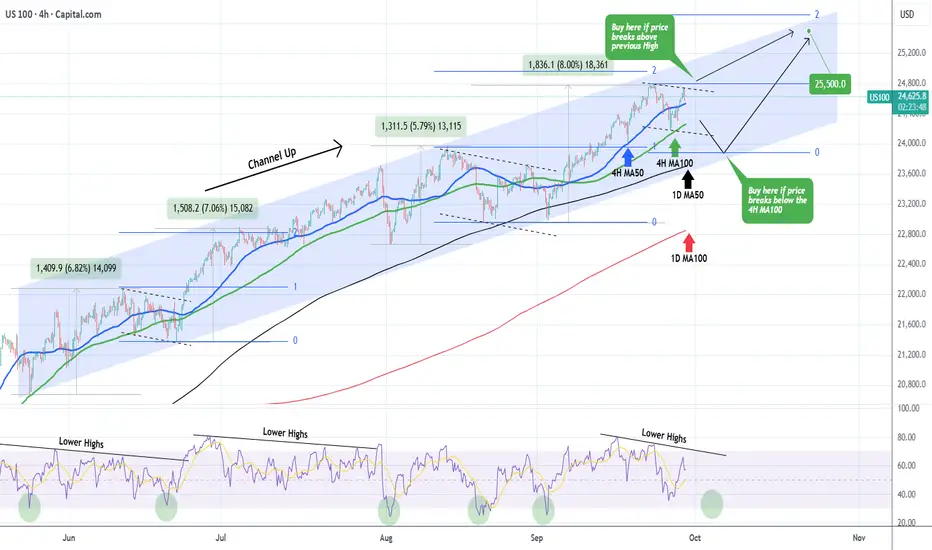
NASDAQ Channel Up found support and aims for 25600.Nasdaq (NDX) has been trading within a Channel Up since the August 28 High and on Friday it tested its 1H MA100 (green trend-line) again and rebounded. That has been a bullish continuation signal within this pattern every time a 1H MA50/ 100 takes place.
On the previous Bullish Leg that confirmed the upside continuation all the way to the 2.382 Fibonacci extension before a 1H MA50/ 100 Bearish Cross and new Low.
As a result, the current short-term Target on Nasdaq is 25600.
-------------------------------------------------------------------------------
** Please LIKE 👍, FOLLOW ✅, SHARE 🙌 and COMMENT ✍ if you enjoy this idea! Also share your ideas and charts in the comments section below! This is best way to keep it relevant, support us, keep the content here free and allow the idea to reach as many people as possible. **
-------------------------------------------------------------------------------
💸💸💸💸💸💸
👇 👇 👇 👇 👇 👇
Us100

US100 Trading Plan ¦ Layering Strategy + Macro Sentiment Drivers🚀 NASDAQ100 / US100 Index – Thief Money Heist Plan 🎭
📌 Plan: Bullish Swing / Scalping Setup
Dear Ladies & Gentlemen (Thief OG’s), here’s the heist-style breakdown for US100 🔑:
🏴☠️ Entry Style (Thief Layering Strategy)
Using layered limit orders for flexibility & precision:
• 23200.0
• 23250.0
• 23300.0
• 23350.0
(You may increase limit layers based on your strategy & risk appetite)
📉 Moving Average Pullback Entry Plan
• Buy entries on pullbacks to the Fibo level 382 Triangular Moving average zone.
• Look for bullish candles confirming the bounce from these MAs.
• This offers better risk-to-reward by catching momentum on retracements instead of chasing highs.
❓ Why This Works?
• Moving averages often act as dynamic support/resistance in trending markets.
• Institutional traders & algos track them heavily, making them high-probability zones.
• Combining with layering entries = higher flexibility + reduced risk of mistimed single entry.
🛡️ Stop Loss (Protect the Vault)
• Thief SL: @23000.0
• Reminder: Adjust your SL based on your own strategy & risk tolerance.
🎯 Target (Escape Zone)
• Overbought + Trap Zone ahead!
• Escape target: @23750.0
• Note: Don’t rely only on my TP — secure profits at your own pace and risk.
📊 US100 Index CFD Real-Time Data Sep 03
📈 Daily Change: +133.47 (+0.57%)
📅 Monthly Performance: +0.76%
📆 Yearly Performance: +23.48%
😰😊 Fear & Greed Index
📊 Current Reading: 53/100 (Neutral)
🧐 Interpretation: Market sentiment is balanced, showing neither extreme fear nor greed. Investors are cautious but not panicked.
🧠 Retail vs. Institutional Sentiment
👥 Retail Traders: Moderately bullish (55% Long, 45% Short)
🏦 Institutional Traders: Slightly cautious (50% Long, 50% Short)
🔑 Key Drivers: Mixed signals from manufacturing data and upcoming labor market reports.
📉📈 Fundamental & Macro Score
📊 Macro Score: 6/10
Manufacturing PMI (48.7) still in contraction but improving.
Labor market data (JOLTS) awaited for clarity.
⚡ Volatility Score: 5/10 (Moderate)
VIX near average levels, indicating stable expectations.
💧 Liquidity Score: 7/10
Strong volume and breadth in large-cap tech stocks.
🐂🐻 Overall Market Outlook
✅ Bullish (Long): 60%
Supported by strong yearly gains and resilience in big tech.
⚠️ Bearish (Short): 40%
Concerns over manufacturing contraction and inflation pressures.
💡 Key Takeaways
📈 US100 is trending mildly positive today (+0.57%).
😐 Sentiment is neutral—no extreme fear or greed.
📊 Macro data hints at cautious optimism but watch for upcoming labor reports.
🐂 Overall bias leans slightly bullish for long-term holders.
📊 Related Pairs to Watch
FOREXCOM:SPX500
TVC:DJI
TVC:VIX
NASDAQ:NDX
FX:USDOLLAR
✨ “If you find value in my analysis, a 👍 and 🚀 boost is much appreciated — it helps me share more setups with the community!”
#NASDAQ100 #US100 #NDX #SPX500 #DJI #TradingView #SwingTrade #ScalpTrading #LayeringStrategy #MarketAnalysis
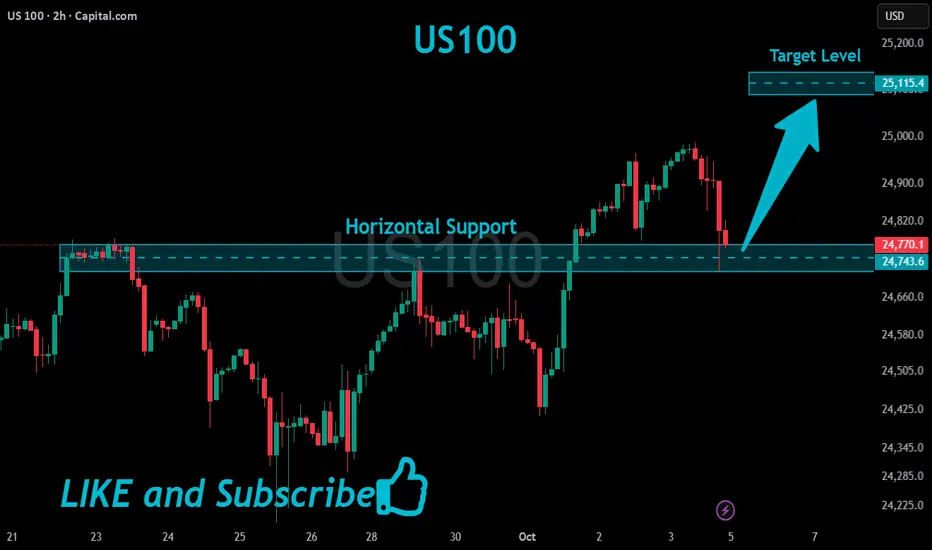
US100 Will Grow!
HI,Traders !
#US100 is trading in an
Uptrend and is
Going down to retest
The horizontal support
Around 24743.6 so after
The retest we will be
Expecting a further
Bullish move up !
Comment and subscribe to help us grow !
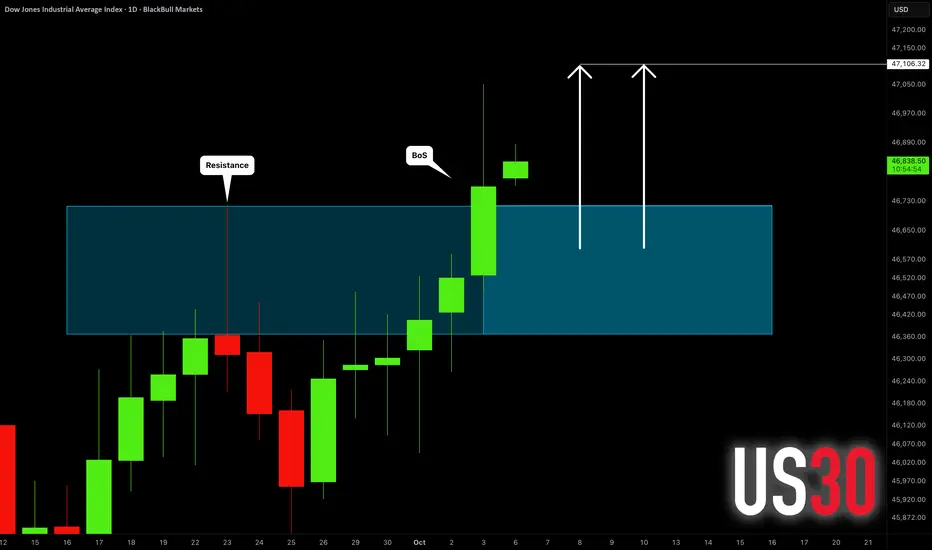
DOW JONES INDEX (US30): Another BoS Confirmed
US30 updated the all-time high on Friday, breaking and closing
above a major daily horizontal resistance cluster.
It opens a potential for more growth now.
Next resistance is 47100.
❤️Please, support my work with like, thank you!❤️
I am part of Trade Nation's Influencer program and receive a monthly fee for using their TradingView charts in my analysis.
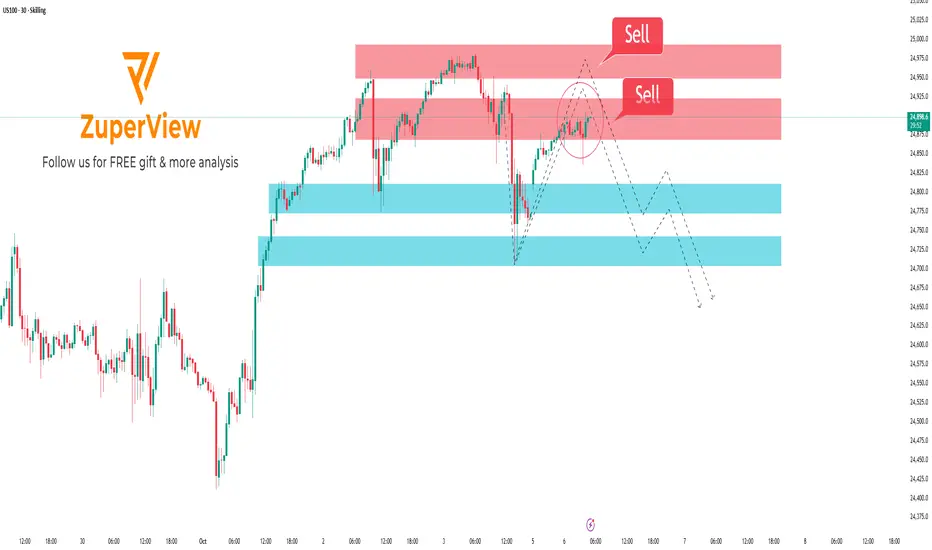
US100: Strong resistance sell setup on the 30-minute chart
📈 SKILLING:US100 — Technical Analysis: Sell Setup Near Strong Resistance
🔍 Technical Analysis:
• Currently, US100 price is approaching a significant resistance zone (highlighted in red). This area has acted as a strong ceiling in recent sessions, where sellers tend to emerge.
• The price has rallied back after a sharp decline but is showing signs of slowing momentum as it nears this resistance. This often leads to a rejection rather than a clean breakout, especially on a 30-minute timeframe.
• Below, the light blue zones represent key support levels, which could serve as realistic targets if sellers regain control. These zones are important areas where buyers previously stepped in, creating potential bounce points.
• The drawn dashed lines illustrate a possible price path: a test of the resistance level, failure to break higher, followed by a pullback and continuation of the downward trend.
• For confirmation of the sell setup, traders should look for reversal candlestick patterns such as rejection wicks (long upper shadows), bearish engulfing candles, or pin bars at the resistance zone. These signals help validate that sellers are gaining dominance.
• Volume and momentum indicators should also be monitored for divergence or weakening bullish pressure near resistance to strengthen the case for a sell.
📊 Trade Considerations:
• Entering a sell position should be done only after clear confirmation of price rejection at resistance.
• Setting a stop loss slightly above the resistance zone helps manage risk in case of a false breakout.
• Targets can be placed near the support zones (light blue areas), with partial profit-taking to lock gains while allowing some position to run if price reacts there.
📌 Summary:
The technical structure of US100 on the 30-minute chart suggests a high probability of price reversal from the strong resistance area. A cautious sell setup is favored, waiting for confirming price action signals to reduce risk. Proper risk management is essential to navigate potential volatility near this key level.
Please like and comment below to support our traders. Your reactions will motivate us to do more analysis in the future 🙏✨
Harry Andrew @ ZuperView
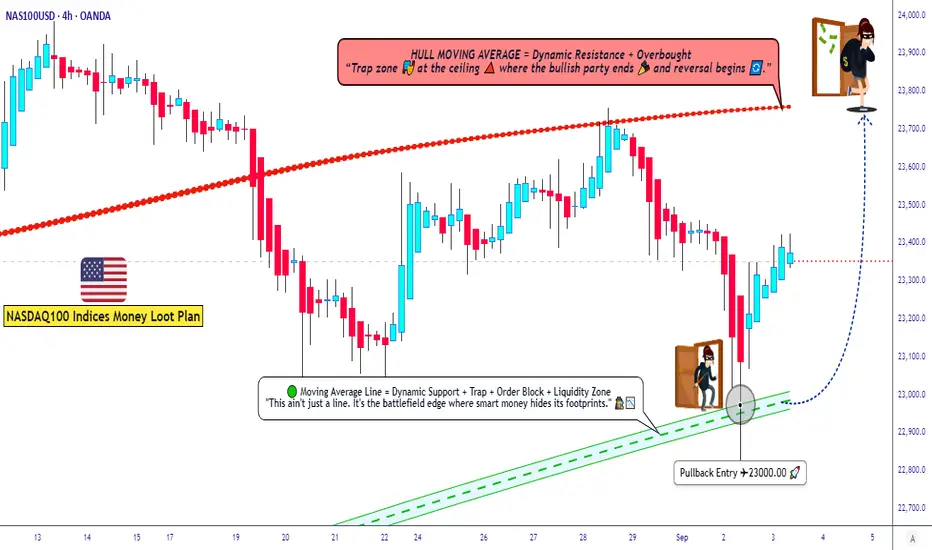
NAS100 - Stock Market on Federal Holiday!The index is above the EMA200 and EMA50 on the four-hour time frame and is in its long-term ascending channel. If the upward momentum decreases, we can expect a correction to the demand zones and buy Nasdaq in that range with an appropriate reward for the risk.
Traders in prediction markets now estimate that the U.S. federal government shutdown could last more than a week and potentially extend into mid-October. These projections suggest that Washington’s political environment has reached a deadlock, making a swift agreement in Congress increasingly unlikely.
The shutdown began early Wednesday morning after Democrats and Republicans—along with President Donald Trump—failed to reach a compromise on a temporary funding bill. As a result, hundreds of thousands of federal employees have been placed on unpaid leave, and numerous government programs and public services have been suspended.
According to data from Bank of America, since 1990, U.S. government shutdowns have lasted an average of 14 days. Although the S&P 500 has typically risen about 1% during such periods, an extended impasse could weigh heavily on an already fragile economy and markets near record highs.
The credit rating agency Fitch stated that the current shutdown will not have a direct impact on the United States’ credit rating, which remains at AA+ with a stable outlook. However, the agency noted that repeated reliance on short-term funding resolutions reflects persistent weaknesses in U.S. fiscal governance. Still, Fitch expects the U.S. dollar’s status as the world’s reserve currency to remain intact in the near future.
Fitch also added that a short-lived shutdown is unlikely to affect most public-finance credits, though a prolonged one could pose negative risks for bond issuers—particularly those dependent on federal funding in areas such as healthcare, housing, and higher education.
Meanwhile, UBS argued that concerns over the U.S. government shutdown have been overstated, predicting that its economic impact will be limited and short-lived. The bank advised investors to look beyond political noise and instead focus on Federal Reserve rate cuts, corporate earnings, and opportunities in artificial intelligence.
Economists at Citi expect the Federal Reserve to implement two 25-basis-point rate cuts in October and December, in line with its Dot Plot projections. However, the shutdown could delay access to key labor and inflation data, forcing investors to rely more heavily on private sources such as ADP reports.
Similarly, Bank of America forecasts a rate cut in October but notes that markets have already priced in this outcome, assigning a 95% probability for October and 85% for December. In essence, this projection merely aligns with the consensus that has already formed among traders.
In actual market developments, expectations have shifted back toward easing policies. Over the past two weeks, the hawkish pressure that had supported the dollar has eased, and markets are once again pricing in a lower-rate trajectory. Currently, about 105 basis points of rate cuts are priced in for next year, compared with a previous low of 94 basis points—a shift that favors equities while weighing on the dollar.
According to Daniel Pavilonis, senior commodities broker at RJO Futures, the government shutdown will not significantly impair the Fed’s ability to assess labor market conditions. “The Fed relies more on its proprietary datasets than on official government statistics,” he explained. “Even amid a shutdown, policymakers maintain a fairly accurate picture of the economy.”
After a week dominated by employment data—some released and others delayed due to the shutdown—the upcoming week is expected to be relatively quiet for official U.S. economic releases unless a resolution is reached.Instead, market attention will pivot toward remarks from Federal Reserve officials.
On Wednesday, the minutes of the September FOMC meeting will be released, offering deeper insight into policymakers’ views on the rate path and inflation risks. Then, on Friday, the University of Michigan’s preliminary Consumer Sentiment Index for October will shed light on household perceptions of the economy and their financial conditions—a key gauge for domestic demand strength.
In addition, investors will closely monitor speeches from several Fed officials, including Bostic, Bowman, Miran, Kashkari, Barr, and Musalem. Their comments could directly influence market expectations for monetary policy and shape trading sentiment in the days ahead.
US100 Expected Growth! BUY!
My dear friends,
Please, find my technical outlook for US100 below:
The price is coiling around a solid key level - 24770
Bias -Bullish
Technical Indicators: Pivot Points High anticipates a potential price reversal.
Super trend shows a clear buy, giving a perfect indicators' convergence.
Goal - 24845
Safe Stop Loss - 24731
About Used Indicators:
The pivot point itself is simply the average of the high, low and closing prices from the previous trading day.
Disclosure: I am part of Trade Nation's Influencer program and receive a monthly fee for using their TradingView charts in my analysis.
———————————
WISH YOU ALL LUCK
US100 BEST PLACE TO SELL FROM|SHORT
US100 SIGNAL
Trade Direction: short
Entry Level: 24,768.0
Target Level: 24,035.6
Stop Loss: 25,254.9
RISK PROFILE
Risk level: medium
Suggested risk: 1%
Timeframe: 1D
Disclosure: I am part of Trade Nation's Influencer program and receive a monthly fee for using their TradingView charts in my analysis.
✅LIKE AND COMMENT MY IDEAS✅
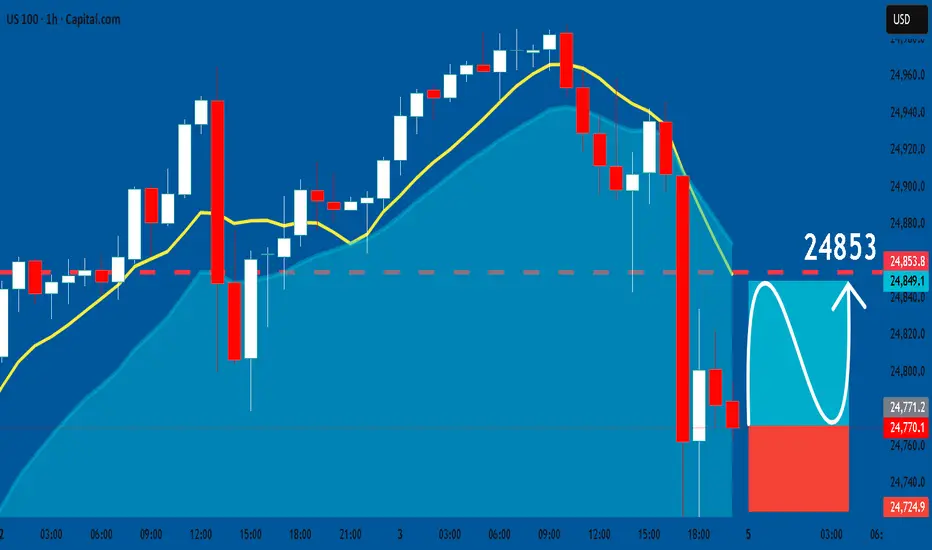
US100: Long Signal with Entry/SL/TP
US100
- Classic bullish pattern
- Our team expects retracement
SUGGESTED TRADE:
Swing Trade
Buy US100
Entry - 24770
Stop - 24724
Take - 24853
Our Risk - 1%
Start protection of your profits from lower levels
Disclosure: I am part of Trade Nation's Influencer program and receive a monthly fee for using their TradingView charts in my analysis.
❤️ Please, support our work with like & comment! ❤️
S&P500 (US500): Another BoS
US500 updates the all-time high yesterday, breaking a resistance
cluster based on a previous high.
It opens a potential for more growth now.
Next goal - 6750
❤️Please, support my work with like, thank you!❤️
I am part of Trade Nation's Influencer program and receive a monthly fee for using their TradingView charts in my analysis.

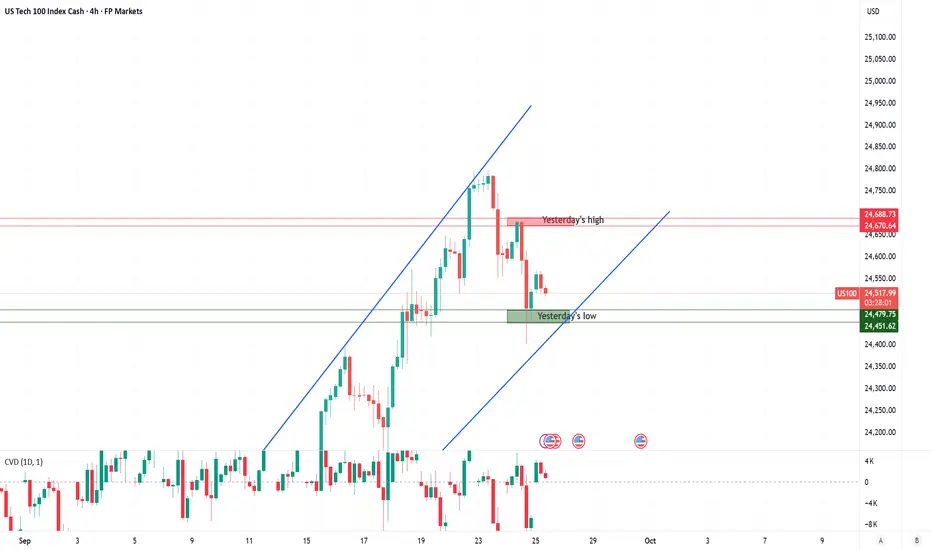
Beyond the Chart - NAS100 Through Technicals & FundamentalsCAPITALCOM:US100 The trendline I drew on the lower timeframe yesterday worked perfectly, and price is still respecting it. We did see a break, but right after that, a Bearish FVG and a Breaker Block formed. This trendline will remain my pilot line for analysis.
NASDAQ Daily Analysis 📊
On the daily chart, the FVG formed on Sep 15th has been revisited, but price couldn't hold in this zone and was quickly rejected. The trendline I've drawn is still active and guiding the move.
⚡️Volatility note: Daily volatility is starting to compress (blue print on my model), meaning the next breakout move could expand strongly. If price breaks above the trendline with momentum, buyers may look beyond 24,650 toward 24,720–24,800 before reevaluating. If rejection holds, compressed volatility could fuel an accelerated drop into the 24,520 → 24,440 FVG zone, and possibly 24,300.
🦖 If a bullish candle closes back above the trendline, I’ll be looking at 24,650 as a buy trigger. A confirmed break here could open the door toward 24,720 → 24,780 liquidity levels.
🐼 If sellers keep control below the trend, downside targets remain at the FVGs around 24,520 → 24,440, and potentially 24,300 (Discount PD Array).
⚡️ Bottom line:
Today’s US data (Chicago PMI, JOLTS, Consumer Confidence) + multiple FOMC speeches will likely decide direction.
📉 Hot data or hawkish tone → sellers push deeper.
📈 Softer numbers or dovish Fed comments → bulls may retest higher levels.
NASDAQ in no action zone. Buy break-out or pull-back.Nasdaq (NDX) has been trading within a 4-month Channel Up and its most recent low has been on its 4H MA100 (green trend-line) 2 days ago.
As long as it holds, it maintains the short-term bullish trend but a confirmed buy signal would be after the price breaks above its previous 24800 High.
Until it does, it might be within a technical Bearish Leg similar to late August's and mid June's that both broke below the 4H MA100 before bottoming on the Higher Lows trend-line of the Channel Up and rebounded. The 4H RSI Lower Highs structure shows that we might be on such a pull-back sequence, which turns into a buy below 33.00 (RSI).
As a result, we will either wait for a 24800 break-out or a 1D MA50 (black trend-line) pull-back before initiating a buy again. In both cases, our Target is 25500 (just below the 2.0 Fibonacci extension).
-------------------------------------------------------------------------------
** Please LIKE 👍, FOLLOW ✅, SHARE 🙌 and COMMENT ✍ if you enjoy this idea! Also share your ideas and charts in the comments section below! This is best way to keep it relevant, support us, keep the content here free and allow the idea to reach as many people as possible. **
-------------------------------------------------------------------------------
💸💸💸💸💸💸
👇 👇 👇 👇 👇 👇
NASDAQ-NAS100 4H Analysis: Buy OpportunityHello Guys,
I’ve prepared a 4-hour NAS100 analysis for you.
I’ll be entering a buy position from 24,500.00 with a target set at 24,748.00.
Set your stop level according to your own margin.
Once the markets open, I’ll definitely take my shot on the buy side of NAS100.
Let’s see how this analysis plays out together.
Every like is my biggest motivation to keep sharing these analyses.
Thanks to everyone supporting me!

NASDAQ | Diagonal resistance | GTradingmethodGood morning Traders,
I hope everyone has had a winning week so far :)
The US100 is sitting at a pivotal point. Price is currently at all-time highs but also testing two key diagonal resistance levels — one medium-term and one short-term. These resistance lines are intersecting right now, which adds extra weight to this resistance zone.
The big question:
👉 Will the US100 break through resistance and push higher into uncharted territory, or are we about to see a short-term correction from here?
📊 Trade Plan:
Not entering a trade just yet — waiting for confirmation of either a breakout with retest or rejection and reversal.
Very keen to hear what everyone thinks, let me know please :)
Peace
G

Beyond the Chart - NAS100 Through Technicals & FundamentalsThe trendline I drew last week played out perfectly. Price has carved out a fresh trend on the lower timeframe and is breaking to the upside. But the real confirmation comes only if the FVG is fully filled and we get a strong bullish close above 24,700.
NASDAQ Daily Analysis 📊
👉Hold above 24,500 – 24,520 → BUY targeting 24,700 (upper FVG). Break & hourly close above 24,700 → room to push toward 24,850 – 24,900.
👉24,700 – 24,750 → strong SELL zone (Premium PD Array + FVG overlap). First downside target: 24,400 – 24,350.
⚡️Bottom line:
• Bullish case→ If inflation comes in lower and the Fed takes a softer tone → buyers could step in and push levels higher.
• Bearish case → If data runs hot and the Fed signals more tightening → selling pressure kicks in, and your short levels become key.
US100 MOVE UP AHEAD|LONG|
✅US100 price is hovering above the demand level after a sell-side sweep, hinting at ICT displacement. If the level holds, Smart Money will likely rotate price upward to rebalance inefficiency and draw liquidity toward 24,640. Time Frame 3H.
LONG🚀
✅Like and subscribe to never miss a new idea!✅

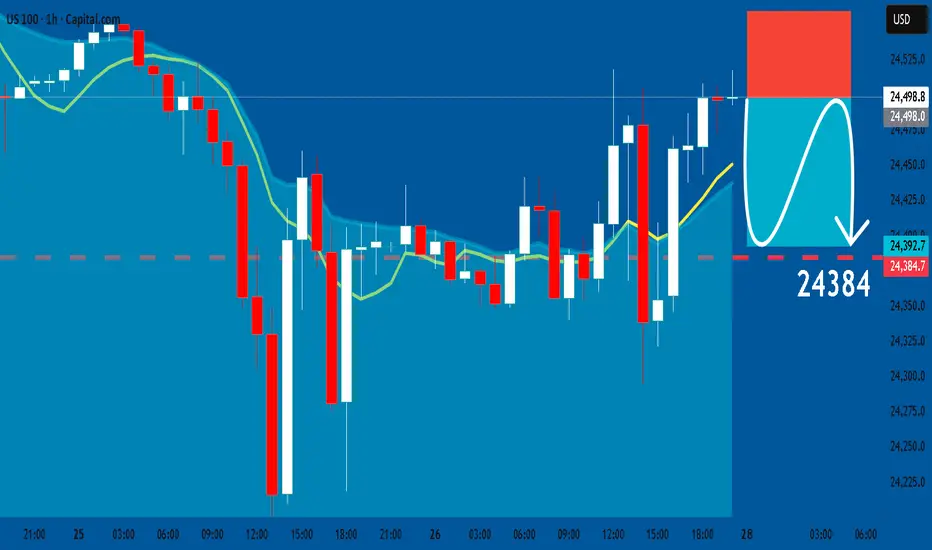
US100: Short Trade Explained
US100
- Classic bearish pattern
- Our team expects retracement
SUGGESTED TRADE:
Swing Trade
Sell US100
Entry - 24498
Stop - 24559
Take - 24384
Our Risk - 1%
Start protection of your profits from lower levels
Disclosure: I am part of Trade Nation's Influencer program and receive a monthly fee for using their TradingView charts in my analysis.
❤️ Please, support our work with like & comment! ❤️
NASDAQ100 HIGH PROBABILITY SETUP SOON!!!🚨 NAS100 HIGH PROBABILITY BUY SETUP 🚨
* Here We Can See Clearly The Next Potential Moves For US100 Coming Hours/Days.
* Keep Your Eyes Close On Your Trading Positions.
* Happy PIP Hunting Traders.
FXKILLA.

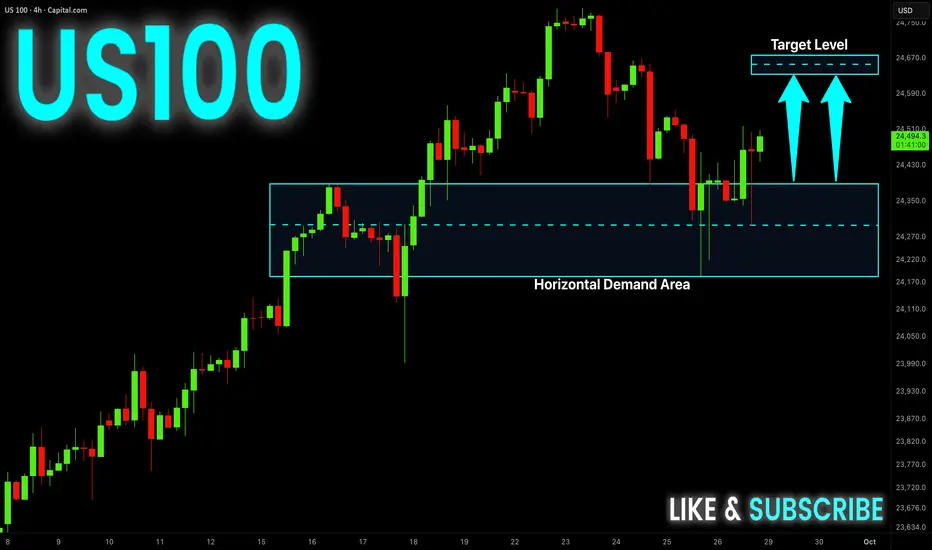
US100 Will Keep Growing! Buy!
Hello,Traders!
US100 Price reacts from the horizontal demand area, shifting order flow bullish. SMC structure favors upside with liquidity targets set at 24,670 zone. Time Frame 4H.
Buy!
Comment and subscribe to help us grow!
Check out other forecasts below too!
Disclosure: I am part of Trade Nation's Influencer program and receive a monthly fee for using their TradingView charts in my analysis.
US100 Swing trade Sell position
Bearish pattern formed at the top.
Take-profit (TP) is defined on the chart.
If you wish to hold further, move stop-loss (SL) to breakeven.

US100 M30 – Sideway at the Top - Short OpportunityThe CAPITALCOM:US100 index has experienced a strong upward move on the 30-minute chart, pushing price to a new high around the 24,800 – 24,850 zone. However, recently, price has been moving sideways within a narrow range, forming a consolidation phase near this key resistance area. This sideways action signals a potential short-term correction or trend reversal.
📉Technical Analysis:
Current Sideways Zone: Price is consolidating between approximately 24,800 and 24,850, repeatedly testing this resistance but failing to break through decisively.
Key Support Level: The 24,650 – 24,700 zone is acting as critical support, holding price during this consolidation.
Support Break Signal: A close below the 24,650 – 24,700 support range would confirm the start of a downtrend and signal a likely bearish move.
📊 Trading Plan
Sell on Support Break: If price closes below the 24,650 – 24,700 support zone, consider entering a short position targeting the next strong support area near 24,400 – 24,350 .
Sell on Retest of Sideways Zone:
After breaking support, if price pulls back to retest the sideways zone (24,800 – 24,850) and shows bearish rejection signals (e.g., pin bar, bearish engulfing), this provides a good opportunity to enter or add to short positions.
⚠️Risk Management:
Stop-loss: Place above the sideways resistance area, around 24,860 – 24,870 , to avoid false breakouts.
Take profit: Consider partial profit-taking near 24,650 – 24,700 and final targets around 24,400 – 24,350.
Wait for Confirmation: Avoid entering trades without clear support breaks or bearish rejection signals to minimize risk.
Please like and comment below to support our traders. Your reactions will motivate us to do more analysis in the future 🙏✨

Nas100: Trading Levels in FocusKey Zones in Play
Zone 1 – Yesterday’s High:
Yesterday’s high represents the level where buyers lost momentum and sellers stepped in. If price revisits this zone, traders should expect potential supply pressure. A clean break and sustained hold above would signal renewed strength and could re-ignite bullish momentum.
Zone 2 – Yesterday’s Low:
This zone is the lower boundary of the previous session and now acts as short-term support. Buyers may defend this level to maintain structure, but its reliability is limited given the fresh all-time high environment and lack of historical confirmation. A decisive break below would weaken the bullish case and could invite deeper retracement.
Conclusion:
With US100 trading close to record highs, these zones provide useful guidelines, but they should not be treated as precise buy or sell triggers. In uncharted territory, reactions are often more volatile, making it essential to treat these levels as reference points rather than absolute decision zones.
Morning Sentiment Brief
Market sentiment remains cautiously optimistic. The recent Fed rate cut and ongoing enthusiasm around AI investments continue to underpin a bullish narrative, keeping the US100 near record highs. However, Powell’s cautious tone this week, stressing data-dependence and warning about stretched equity valuations, has cooled some of the initial euphoria.
Traders are now balancing optimism with prudence. Tech momentum is intact, but profit-taking and sector rotation show that conviction is more selective. Political and regulatory headlines add another layer of uncertainty, leaving the market more sensitive to incoming catalysts. Overall, the bias stays positive, but participants are trading with more caution as the index moves in uncharted territory.
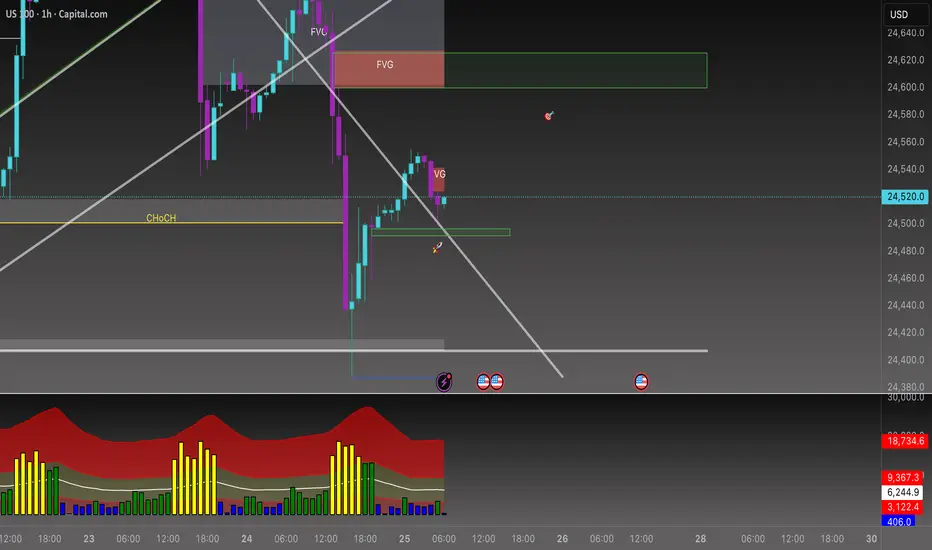
Beyond the Chart - NAS100 Through Technicals & FundamentalsNAS100 has just completed its move into the Discount PD Array zone I highlighted yesterday. On the 1H timeframe, I pointed out the prevailing bearish trend and marked this area as a key target. Once price tapped the zone, sellers lost momentum and buyers stepped in, shifting market control.
Now we’re seeing an inverse Z formation, with a Fair Value Gap (FVG) and a Breaker Block (BB) cutting across the structure. If buyers step in again, as they did in the earlier PD Array, my upside target will be 24,580.