US30 - Testing Key Support Zone Amid Bearish PressureUS30 – MARKET OUTLOOK | Testing Key Support Zone Amid Bearish Pressure 🇺🇸
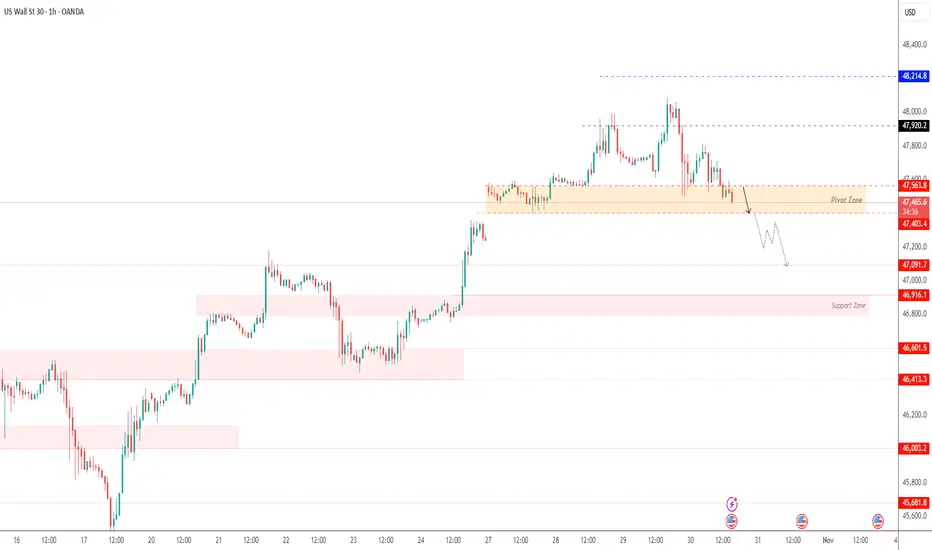
The Dow Jones is testing the 47,400 support zone, with downside pressure still dominant.
A 1H close below 47,400 would confirm continuation toward 47,090 → 46,920.
However, a 1H close above 47,620 may trigger a bullish rebound toward 47,920 → 48,000.
Pivot: 47,565
Support: 47,400 · 47,100 · 46,920
Resistance: 47,670 · 47,920 · 48,000
US30 remains bearish below 47,565, but a breakout above 47,620 could shift momentum to bullish.
US30
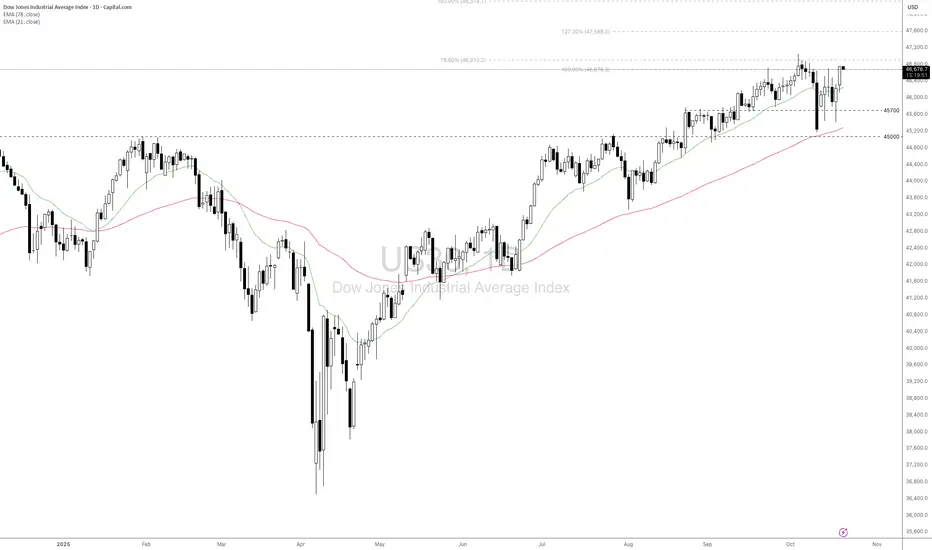
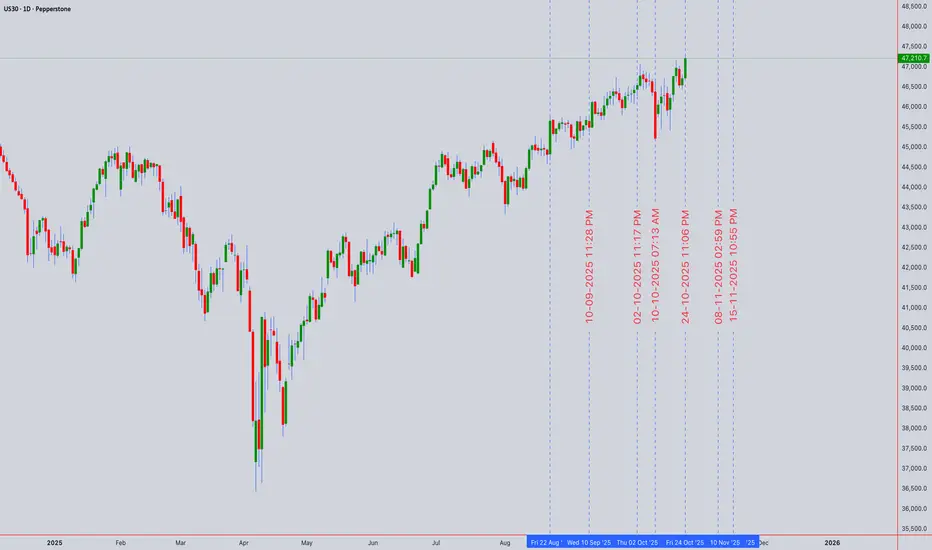
DOW JONES approaching the end of its Bull Cycle?Dow Jones (DJI) has been trading within a 16-year Channel Up ever sine the March 02 2009 market bottom of the U.S. Housing Crisis. As this chart shows, we have divided this pattern into three different phases.
Since the March 2020 COVID crash, it appears that the Cycle got restarted as the index broke below its 1W MA200 (orange trend-line) again after 10 years. Technically that was the only time that multi-year Support trend-line broke in 15 years.
In any case, following that Cycle 'restart', it appears that the index is currently inside the Megaphone pattern that in 2015 concluded Phase 2. The conclusion came with a second test on the 1W MA200 (Double Bottom). The first test was the April 07 2025 Low.
With their 1W RSI sequences also identical, having the first 1W MA200 forcing a 30.00 (oversold) RSI rebound, we expect the index to start a new Bearish Leg that might potentially test the 1W MA200 around 39000. For long-term investors, that is the market's next Buy Entry.
-------------------------------------------------------------------------------
** Please LIKE 👍, FOLLOW ✅, SHARE 🙌 and COMMENT ✍ if you enjoy this idea! Also share your ideas and charts in the comments section below! This is best way to keep it relevant, support us, keep the content here free and allow the idea to reach as many people as possible. **
-------------------------------------------------------------------------------
💸💸💸💸💸💸
👇 👇 👇 👇 👇 👇

US30 Bullish Breakout!
HI,Traders !
#US30 is trading in a strong
Uptrend and the price made a
Bullish breakout of the key
Horizontal level of 46718.2
So we are bullish biased
And we will be expecting a
Further bullish move up !
Comment and subscribe to help us grow !

US30 Trade Set Up Oct 29 2025Overall im still bullish but if PDH gets swept first, i will look for internal 1m/5m IFVG/CISD to target SSL/London lows before looking for buys back up

DOW JONES 30 HIGH PROBABILITY SETUP SOON!!!🚨 DJ30 HIGH PROBABILITY SELL SETUP 🚨
* Here We Can See Clearly The Next Potential Moves For US30 Coming Hours/Days.
* Keep Your Eyes Close On Your Trading Positions.
* Happy PIP Hunting Traders.
FXKILLA.

US30 Intraday Plan – Bullish Bias Above 47,700 - 28/10/2025US30 has been maintaining strong bullish structure with a series of higher highs and higher lows on the lower timeframes. After breaking through the 47,700 zone, price is now retesting that area — which may act as intraday support going into the U.S. session.
📊 Scenarios:
Bullish Scenario (Primary Bias)
Watch for a pullback into the 47,730–47,700 zone — this area may serve as a liquidity grab / confirmation zone before continuation.
If support holds, potential upside targets are:
TP1 → 47,850
TP2 → 47,950
TP3 → 48,000 (psychological level & round number target)
Bearish Scenario (Alternative)
If price rejects near 47,780 and fails to hold above 47,700, we could see a deeper retracement.
Downside targets in that case:
TP1 → 47,500
TP2 → 47,350–47,300
📈 Bias: Bullish above 47,700
📉 Invalidation: Sustained break below 47,600
This plan focuses on waiting for confirmation at key levels rather than chasing momentum. Watch the first 15–30 minutes after NY open for direction confirmation — expect volatility and potential fakeouts.

US30 Trade Set Up Oct 28Price is trading above PDH and made ATH so i will wait for a pullback into 1h FVG before looking for internal structure on the 1m-5m forming IFVG/CISD to take buys back up

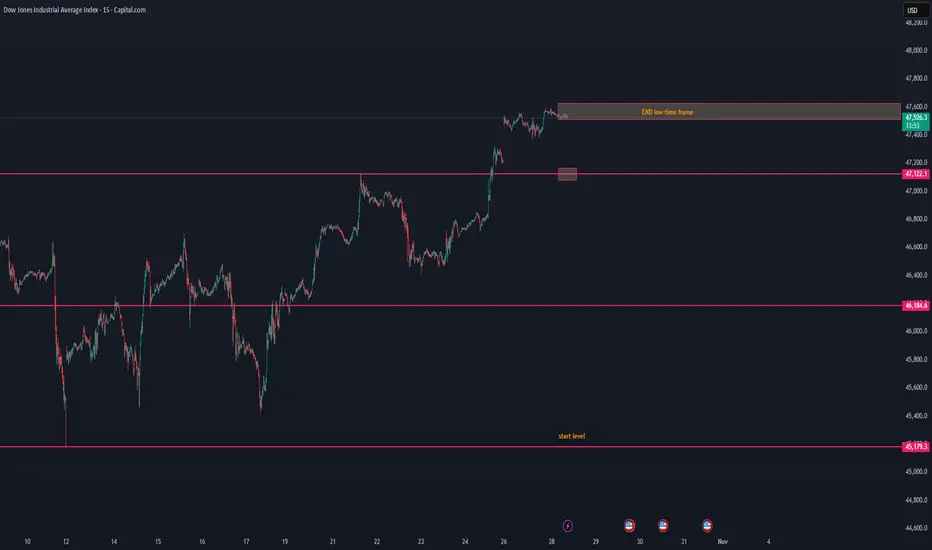
US30 lost its low time frame — possible breakdown aheadUS30 lost its low time frame — possible breakdown ahead ⚠️
US30 has lost its low time frame structure, showing early signs of weakness after the recent push to 47.5K.
The current price action suggests that momentum is fading, and sellers may start to take control.
📉 Short-term view:
Structure break below 47.5K zone confirms loss of bullish control.
The next visible support area sits around 47.1K, followed by 46.1K.
With time, price could continue to drift down toward the start level near 45.1K if buyers fail to defend.
📊 Observation:
Volume has started to cool off, and price is trading below the short-term EMA range — a typical setup before a gradual downward retrace.
💬 Summary:
US30 lost its low time frame momentum and looks to break down step by step toward the start level zone. We’ll monitor if buyers can react near 47.1K or if this becomes a broader correction phase.
US30 H4 | Bearish ReversalDow Jones (US30) is reacting off the sell entry, which aligns with hte 161.8% Fibonacci extension and the 61.8% Fibonacci projection, and could drop from this level to the downside.
Sell entry is at 47,651.31, which lines up with the 161.8% Fibonacci extension and the 61.8% Fibonacci projection.
Stop loss is at 48,228.80, whic lines up with the 100% Fibonacci projection.
Take profit is at 46,892.33, which is an overlap support that lines u;p with hte 38.2% Fibonacci retracement.
Stratos Markets Limited (tradu.com ):
CFDs are complex instruments and come with a high risk of losing money rapidly due to leverage. 68% of retail investor accounts lose money when trading CFDs with this provider. You should consider whether you understand how CFDs work and whether you can afford to take the high risk of losing your money.
Stratos Europe Ltd (tradu.com ):
CFDs are complex instruments and come with a high risk of losing money rapidly due to leverage. 70% of retail investor accounts lose money when trading CFDs with this provider. You should consider whether you understand how CFDs work and whether you can afford to take the high risk of losing your money.

Dow Gains on Earnings Optimism and Shutdown Resolution Hopes.Fundamental approach:
- The Dow Jones index advanced this week, supported by strong corporate earnings optimism and hopes for a government shutdown resolution.
- Major earnings reports from technology companies may lead the gains, with IBM scheduled to report Q3 earnings on Wed, 22 Oct, with expectations for AI-driven growth. Additionally, 3M (MMM) is scheduled to report Q3 earnings on Tue, 21 Oct, before market open.
- Fed Governor Christopher Waller provided a dovish signal, noting inflation was "not a barrier to rate cuts."
- This sentiment pushed US Treasury yields lower, with the 10-year note falling below 4.00%, offering support to equities amid the data uncertainty.
- Investors also focused on the potential end to the federal government shutdown, which has created data blackouts for key economic releases, with National Economic Council Director Kevin Hassett indicating the shutdown could end this week.
Technical approach:
- US30 is testing the previous all-time high at around 47000. The index is above both EMAs, indicating a strong bullish movement.
- If US30 breaches above 47000, the index may advance to test 127.20% Fibonacci Extension at 47590.
- On the contrary, staying below EMA21 may prompt US30 to retest the support at 45700.
Analysis by: Dat Tong, Senior Financial Markets Strategist at Exness
US30 - Intraday Playbook for NY Session 27/10/2025Here’s my structured 15M game plan heading into the US session today. We’re currently sitting inside a bullish trend, but we’re also at a point where price could either continue higher or shift momentum if key demand levels fail. So I’m prepared for both bullish continuation and a possible bearish reversal scenario.
✅ Overall Trend Context:
Higher highs / higher lows remain intact on the 4H / 1H.
Recent bullish leg may need a liquidity sweep / pullback before continuation.
Key intraday structure levels are now clearly defined.
📈 Bullish Continuation Scenario (Primary Bias)
I’ll look for long setups if price pulls back into demand zones and shows bullish rejection.
⚠️ Valid only while price holds above 47,200.
✅ Long Zone #1: 47,300 – 47,350 (first demand / shallow pullback zone)
✅ Long Zone #2: 47,150 – 47,200 (deeper liquidity pool)
Bullish Confirmation Triggers (15M or 5M):
Rejection wick from demand
Bullish engulfing / candle flip
Break of minor 5M structure after tap
🎯 Bullish Targets:
TP1: 47,450 (reaction zone)
TP2: 47,500 – previous high
TP3: 47,600+ if momentum extends
📉 Bearish Reversal Scenario (Alternate Plan)
I will only shift bearish if price breaks below the key higher-low level.
🔻 Bearish bias becomes active if we break & hold below 47,200.
✅ Plan: Wait for a break → retest of 47,200 – 47,250 as resistance → look for rejection
(5M / 15M bearish engulfing, failed reclaim, or lower high confirmation)
🎯 Bearish Targets:
TP1: 47,050 – first liquidity pocket
TP2: 46,900 – prior swing low / demand zone
TP3: 46,750 – deeper structural support
📍 Key Notes
✅ I won’t chase anything at market open — I’ll wait for liquidity grab and confirmation.
❌ No longs if 47,200 breaks decisively and turns into resistance.
❌ No shorts while above 47,200 unless a clear fakeout rejection occurs at 47,500.

US30 Trade Set Up Oct 27 2025Price ended up making ATH in Asia session closing above PDH and creating a 4h FVG which has been filled along with Asia lows/SSL being swept so i am expecting price to continue bullish to London highs/BSL

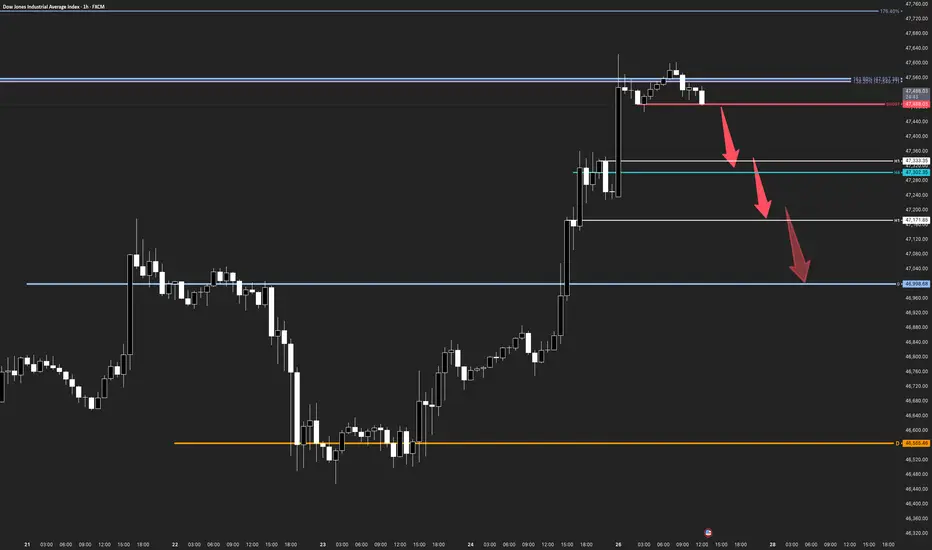
US30 | Countertrend Setup From Long-Term Fibonacci Target ZoneThe Market Flow | Oct 27, 2025
Technical Overview
Weekly / Daily:
• Price has reached the 138.2% Fibonacci extension , aligning with the upper boundary of the long-term impulse zone.
• This region represents a potential profit-taking area within an extended expansion phase.
• The daily structure completed an impulse to the 161.8% Fibonacci target .
• Market currently trades inside a high-probability reaction zone , suggesting risk of corrective flow.
H4:
• Price action shows initial hesitation beneath the prior breakout.
• Intermediate structural support rests near 47,330–47,200 , representing the first countertrend target .
H1:
• A defined trigger = 47,488 (red SHORT level) marks potential short confirmation if broken with a 1–2–3 sequence on M15.
• Below this level, the path → 47,333 → 47,171 → 46,998 aligns with visible breakout retests.
Trade Structure & Levels
• Bias: Bearish countertrend short below 47,488
• Trigger = 47,488
• Invalidation = 47,580 (H1 structure high)
• Path → 47,333 → 47,171 → 46,998
• Phase: Countertrend within extended impulse reaching long-term target zone
Risk & Event Context
• Long-term momentum remains bullish, but exhaustion signals at key Fibonacci confluence may induce a corrective phase.
• Watch for volatility spikes near macro releases or equity session opens that could accelerate profit-taking.
Conclusion
US30 sits within its long-term Fibonacci target zone. A confirmed lower-timeframe trigger below 47,488 would validate a short-term countertrend move toward daily breakout levels before broader structure reassessment.
US30US30 has taken the top one more time, now we are expecting a Pullback to start this week.
Disclosure: We are part of Trade Nation's Influencer program and receive a monthly fee for using their TradingView charts in our analysis.

US30 (1H) — Demand Zone Mapping & Bullish ScenariosHere’s my latest mapping for US30 on the 1-hour timeframe.
After a strong bullish impulsive move, I’m now watching for a potential retracement to one of the key demand zones before the next leg higher.
Zone 1: 47,100 – 47,000
This is the nearest demand zone and the first area where buyers might step in again.
If price holds here and forms a bullish reaction (e.g., engulfing candle or strong wick rejection), I’ll be watching for a possible continuation toward 47,750 – 48,100.
This level aligns closely with the 0.236 Fibonacci retracement, so it could serve as a shallow pullback for aggressive buyers.
Zone 2: 46,850 – 46,700
This zone sits around the 0.5 Fibonacci retracement, which usually acts as a more balanced correction area.
If price rejects Zone 1 but finds support here, it could form a stronger base for a continuation rally.
I’ll be monitoring this level closely for a cleaner structure before re-entry.
Zone 3: 46,600 – 46,400
This deeper zone overlaps with the 0.618–0.786 Fibonacci area, often referred to as the “golden pocket.”
If the market extends its retracement this far, it could present a high-probability buy setup—especially if liquidity sweeps below the previous low before reversing upward.
This would indicate smart money accumulation before a potential breakout.
Upside Targets
If bullish momentum continues, my key upside targets remain:
47,430 (0.27 ext)
47,750 (0.618 ext)
48,100 (1.0 ext)
I’ll look for confirmation and structure before committing to any position.
Bias remains bullish unless price breaks below 46,300, which would invalidate this short-term outlook.
Summary
I’m expecting a short-term pullback followed by a continuation toward new highs.
The goal is to wait patiently for price to come to the demand zones instead of chasing moves.
Plan the trade. Wait for confirmation. Execute with discipline.

US30: Bearish Continuation & Short Signal
US30
- Classic bearish setup
- Our team expects bearish continuation
SUGGESTED TRADE:
Swing Trade
Short US30
Entry Point - 47206
Stop Loss - 47308
Take Profit - 46961
Our Risk - 1%
Start protection of your profits from lower levels
Disclosure: I am part of Trade Nation's Influencer program and receive a monthly fee for using their TradingView charts in my analysis.
❤️ Please, support our work with like & comment! ❤️

US30 Massive Short! SELL!
My dear friends,
Please, find my technical outlook for US30 below:
The instrument tests an important psychological level 47206
Bias - Bearish
Technical Indicators: Supper Trend gives a precise Bearish signal, while Pivot Point HL predicts price changes and potential reversals in the market.
Target - 46982
Recommended Stop Loss - 47329
About Used Indicators:
Super-trend indicator is more useful in trending markets where there are clear uptrends and downtrends in price.
Disclosure: I am part of Trade Nation's Influencer program and receive a monthly fee for using their TradingView charts in my analysis.
———————————
WISH YOU ALL LUCK

Dow Jones Swing Trade Setup – Is 48,000 the Next Stop?📈 US30 "Dow Jones Industrial Average" CFD: Thief's Wealth Strategy Map (Swing/Day Trade) 🚨
🎯 Swing/Day Trade Setup: US30 (Dow Jones Industrial Average CFD)
Get ready to sneak into the market with the Thief Strategy — a cheeky, layered limit-order approach to steal profits from the Wall Street shadows! 😎 This bullish plan is designed for swing or day trading, with a professional yet playful vibe to maximize your market heist. Let’s break it down! 🕵️♂️
🧠 Trade Idea: Bullish Heist on US30 🚀
Asset: US30 (Dow Jones Industrial Average Index CFD)
Market: Wealth Strategy Map (Swing/Day Trade)
Outlook: Bullish 📈
Strategy: The Thief Strategy — using multiple buy limit orders in a layered entry style to catch the best price levels. Think of it as setting traps for profits! 🕸️
📝 The Thief’s Plan: Layered Entry & Key Levels
🔑 Entry Strategy:
Deploy multiple buy limit orders to layer your entries like a master thief:
🎯 46,500
🎯 46,600
🎯 46,700
🎯 46,800
Pro Tip: Feel free to add more layers based on your risk appetite or market conditions. The more traps, the merrier! 😜
Flexible Entry: You can enter at any price level within this range, but layering helps you average into the position like a sneaky pro.
🔐 Stop Loss (SL):
Set at 46,300 — the Thief’s escape hatch! 🚪
Note: Dear Ladies & Gentlemen (Thief OGs 🕶️), this SL is my suggestion, but it’s your heist! Adjust based on your risk tolerance and account size. Only risk what you can afford to lose!
🎯 Take Profit (TP):
Primary target: 47,600 — a juicy profit zone before the Police Barricade (resistance) at 48,000.
Why 47,600? This level avoids the overbought trap and potential reversal at 48,000, where strong resistance and market shenanigans may lurk. 🕵️♂️
Note: Thief OGs, this TP is my call, but you’re the boss! Take profits at your own discretion and secure the bag. 💰
🔍 Why This Setup? Key Analysis Points
Market Context: The US30 is showing bullish momentum, supported by recent economic data and market sentiment (check social posts and financial news for real-time vibes).
Technical View:
The layered entry approach leverages potential pullbacks within a bullish trend, maximizing your entry efficiency.
The 46,300 SL is placed below key support to protect against sudden reversals.
The 48,000 level acts as a major resistance (overbought zone + psychological barrier), making 47,600 a safer TP.
Risk Management: The Thief Strategy spreads risk across multiple entry points, reducing the impact of volatility spikes.
💹 Related Pairs to Watch (Correlated Assets in USD)
To boost your market awareness, keep an eye on these correlated assets:
SP:SPX (S&P 500 Index CFD): Moves closely with US30 due to shared exposure to U.S. large-cap stocks. A bullish US30 often aligns with SPX strength. 📈
PEPPERSTONE:NAS100 (Nasdaq 100 Index CFD): Tech-heavy index that can amplify or diverge from US30 moves. Watch for tech sector momentum. 💻
FX:USDJPY (Forex Pair): A stronger USD often supports bullish US equity indices like US30. Monitor for USD strength or Yen weakness. 💵
Key Correlation Insight: If SP:SPX and PEPPERSTONE:NAS100 show similar bullish patterns, it reinforces the US30 setup. Conversely, a sharp USDJPY drop could signal caution for US indices.
⚠️ Disclaimer
This Thief Style trading strategy is just for fun and educational purposes! 😜 Trading involves risks, and past performance doesn’t guarantee future results. Always conduct your own analysis, manage risk wisely, and only trade what you can afford to lose.
✨ If you find value in my analysis, a 👍 and 🚀 boost is much appreciated — it helps me share more setups with the community!
#US30 #DowJones #ThiefStrategy #SwingTrading #DayTrading #Bullish #TechnicalAnalysis #TradingView #WealthStrategy

DJI (US30) SPOT TECHNICAL ANALYSIS 📊 DJI (US30) SPOT TECHNICAL ANALYSIS | Oct 27-31, 2025 | Intraday Swing Trading Blueprint 🚀
Current Price: 42,210.7 | Timeframe Focus: 5M, 15M, 30M, 1H, 4H & 1D ⏰
━━━━━━━━━━━━━━━━━━━━━━━━━━━━━━━━━━━━━━━━━━━━━━━
🔍 DAILY (1D) ANALYSIS - Swing Trade Framework
On the daily timeframe, DJI exhibits strong bullish momentum with price trading above key exponential moving averages (EMA 50 & 200). 📈 The Ichimoku Cloud shows bullish alignment with price above the cloud, indicating sustained uptrend. Elliott Wave analysis suggests we're in Wave 3 or Wave 5 of an impulse sequence.
Key Support: 41,800-42,000 | Key Resistance: 42,500-42,800
Bollinger Bands on 1D are expanding, confirming rising volatility . RSI hovers near 60-70 zone (approaching overbought but not critical). Volume profile shows accumulation phases at lower levels with distribution emerging at current price action. Dow Theory confirms higher highs and higher lows pattern intact. 💪
━━━━━━━━━━━━━━━━━━━━━━━━━━━━━━━━━━━━━━━━━━━━━━━
⚡ 4-HOUR (4H) SWING TRADE Setup - PRIMARY ENTRY SIGNAL
4H chart displays bullish breakout potential above 42,400 resistance. Harmonic Pattern analysis reveals potential Gartley reversal at support (41,950-42,050). RSI at 65 indicates strong momentum without extreme overbought conditions. 📊
Wyckoff Accumulation: Identified spring pattern suggesting buyers in control
VWAP Analysis: Price above VWAP = bullish bias maintained
Volume Breakout: Watch for volume spike above 42,400 for confirmation
Gann Theory Angle: 45° resistance level aligns with psychological 42,500 mark. Entry on breakout with stop loss at 42,050. Target: 42,650 for quick swing profits! 🎯
━━━━━━━━━━━━━━━━━━━━━━━━━━━━━━━━━━━━━━━━━━━━━━━
🎯 1-HOUR (1H) INTRADAY SCALP SETUP
Hourly timeframe shows consolidation within 42,100-42,300 range . Elliott Wave suggests completion of Wave 2 correction with Wave 3 breakout imminent. 💥 Bollinger Bands are contracting = volatility squeeze incoming!
RSI oscillates near 50 (neutral zone) - PERFECT setup for directional bias confirmation. Support holds at 42,150 (VWAP cluster). Resistance breakout at 42,350 triggers aggressive long entry.
Harmonic Pattern Recognition: Butterfly reversal pattern forming near support zone. Risk/Reward ratio: 1:3 on breakout trades! 📈
━━━━━━━━━━━━━━━━━━━━━━━━━━━━━━━━━━━━━━━━━━━━━━━
⏱️ 30-MINUTE (30M) TACTICAL ENTRY GUIDE
30M timeframe is CRITICAL for entry timing ! Currently showing micro-consolidation with 3 candle reversal pattern forming. Ichimoku Cloud on 30M provides dynamic support around 42,200.
Watch for: Channel breakout above 42,280 for aggressive long setup
Simple Moving Average (SMA 20) acts as dynamic support. Exponential Moving Average (EMA 9) shows bearish crossover risk - key reversal indicator! ⚠️ RSI dip below 50 offers contrarian entry for counter-trend scalps.
Volume Spike Incoming: Wyckoff Distribution phase detected - anticipate volatility expansion into London/US session open! 🌍
━━━━━━━━━━━━━━━━━━━━━━━━━━━━━━━━━━━━━━━━━━━━━━━
🚀 15-MINUTE (15M) MOMENTUM BREAKOUT SETUP
Perfect swing trade entry timeframe ! 15M displays textbook Elliott Wave 5-wave pattern completing. Price oscillating in 42,150-42,350 box. 📦
Bollinger Band Squeeze: Expansion breakout imminent this week
RSI Divergence: Bullish reversal divergence between last two lows
VWAP Bounce: Strong rejection from VWAP = trend resumption likely
Dow Theory Confirmation: Higher lows maintained perfectly. Harmonic Pattern (Gartley) completion nearing 42,050-42,100. Gann angles converge at 42,420 - MAJOR BREAKOUT ZONE! 🎯
━━━━━━━━━━━━━━━━━━━━━━━━━━━━━━━━━━━━━━━━━━━━━━━
⚡ 5-MINUTE (5M) ULTRA-SCALP ENTRIES - EXECUTION TIMING
5M chart = TRADE EXECUTION window ! Shows tight consolidation within 15 pips range (42,210-42,225). Japanese candlestick patterns reveal Doji + Hammer reversal formations. 🔨
Ichimoku Cloud on ultra-low timeframe provides micro S&R; levels. RSI oscillating 45-55 zone = prepare for directional breakout. Volume surge on breakout candle = GREEN LIGHT for entry! 💚
Bollinger Bands on 5M are at tightest compression - expect violent move incoming! Stop losses tight at 42,190 for risk management.
Target 1: 42,280 | Target 2: 42,350 | Target 3: 42,420
━━━━━━━━━━━━━━━━━━━━━━━━━━━━━━━━━━━━━━━━━━━━━━━
📌 WEEKLY TRADING STRATEGY (Oct 27-31)
BULLISH BIAS DOMINATES across all timeframes! Wyckoff accumulation + Elliott Wave Wave 3 setup = explosive move likely. RSI proximity to overbought (not yet extremes) = continuation room.
Key Trading Rules:
Harmonic Pattern targets hit first = take 50% profits
Gann angles breached = add to position
VWAP rejection at support = reversal setup triggered
Volume confirmation on breakouts = only trade valid entries
Volatility Expected: Bollinger Band width expansion + options expiry week = 150-200 pips potential range! 🔥
Reversals Watch: Identifying overbought RSI extremes above 75 triggers pullback potential. Support zones (42,050-42,100) act as reversal pivots. Breakout failures at 42,500 = harmonic reversal zones activate.
Risk Management Critical: Use tight stops at 42,190. Take profits at Gann angles. Scale in using Wyckoff distribution signals. Ichimoku Cloud breakouts = strong follow-through probability.
━━━━━━━━━━━━━━━━━━━━━━━━━━━━━━━━━━━━━━━━━━━━━━━
🎯 FINAL VERDICT: BUY breakout above 42,400 | HOLD through 42,500-42,650 targets | EXIT on harmonic reversal signals
#DJI #US30Spot #TechnicalAnalysis #ElliottWave #SwingTrading #IntraDayTrading #Harmonic #WyckoffMethod #TradingView #ForexAnalysis #StockMarket #CryptoCommunity #TradersOfTwitter #TechnicalAnalyst #BreakoutTrade #MomentumTrading #VolumeAnalysis #VWAP #BollingerBands #RSI #Ichimoku #GannTheory #DowTheory #TradingSignals #Oct2025 🚀📊💹
━━━━━━━━━━━━━━━━━━━━━━━━━━━━━━━━━━━━━━━━━━━━━━━
Disclaimer: This analysis is educational only. Not financial advice. Always trade with proper risk management and your own analysis. Past performance ≠ future results. Trade at your own risk! ⚠️
Study the charts, confirm setups, and execute with precision! Happy trading! 🎯💰
NAS100 1H: Bulls vs Bears at the Line📊 NAS100 – 1 Hour Analysis
Hello friends,
Here’s my NAS100 analysis for you.
Looking at the 1-hour chart, I want to highlight a critical level.
👉 If NAS100 breaks above 25,038 and closes a candle there, the next move could point higher.
👉 If NAS100 fails to break 25,038, then a pullback toward 24,267 may come into play.
🙏 Every like is my biggest motivation to keep sharing these analyses.
Thanks to everyone supporting me!

US30: Price fails to break high, sellers step inSPREADEX:DJI – Price Rejects Previous High, Possible Pullback Ahead
🕒 Timeframe: 30-Minute Chart
📊 Data Source: Spreadex
💵 Currency: USD
________________________________________
🧠 Short Summary (SEO Preview)
US30 (Dow Jones) has rejected its previous swing high near 47,100 after a strong bullish recovery. Price action now shows early signs of weakness from the supply zone, suggesting a potential short-term correction before the next directional move.
#US30 #DowJones #WallStreet #PriceAction #SupplyAndDemand #TechnicalAnalysis #TradingViewIdeas
________________________________________
📈 Market Overview
After forming a solid base around 46,250 – 46,300, the Wall Street Index (US30) has staged a strong V-shaped recovery.
However, recent candles show that price was rejected at the previous high around 47,100, indicating that buying momentum may be fading as the market hits a strong supply zone.
________________________________________
🔍 Key Technical Zones
Supply Zone (Resistance):
47,000 – 47,150
This zone aligns with the previous swing high where strong selling pressure emerged.
The rejection from this level signals potential exhaustion of buyers in the short term.
Demand Zone (Support):
46,750 – 46,850
This is a former resistance area turned support. A retest here could trigger a short-term bullish reaction before the market decides its next move.
________________________________________
🎯 Trading Scenarios
Scenario 1 – Rejection from Supply Zone (Main Bias)
1. Price has tested the 47,000 – 47,150 zone and rejected the previous high.
2. If sellers remain in control, a pullback toward 46,750 – 46,850 is likely.
3. A deeper correction could extend toward 46,600 – 46,650 if momentum builds.
Scenario 2 – Breakout Above Supply Zone
1. A confirmed candle close above 47,150 would invalidate the short-term bearish bias.
2. In that case, 47,150 may flip into support, opening room for 47,300 – 47,400 as the next bullish targets.
________________________________________
🧭 Technical Outlook
• The rejection of the previous high at 47,100 confirms a key resistance zone.
• Momentum is slowing, suggesting a likely short-term pullback before any new highs.
• Potential strategy: Wait for bearish confirmation (e.g., rejection candle, lower-high formation) around 47,000 – 47,150 before making any decision.
________________________________________
Disclaimer
This analysis is for educational and technical purposes only — not financial advice.
Always manage risk and follow your own trading plan before taking any trades.
Please like and comment below to support our traders. Your reactions will motivate us to do more analysis in the future 🙏✨
Harry Andrew @ ZuperView

Us30 Trade Set Up Oct 24 2025Price is trading higher due to CPI news and has swept BSL and could sweep ATL but it price closes under those levels i will look for internal structure to target Asia lows/SSL or 4h FVG. But if prices comes down first to sweep SSL i will look for buys to ATH

24-10-2025 Intraday Plan (CPI + NY Open Scenario) – US30 5M/1M💬 Intraday Plan (CPI + NY Open Scenario) – US30 5M/1M
📍 Bias remains bullish above 46,700 (structure still forming higher lows).
📍 Expecting CPI at 13:30 to create a liquidity grab — ideally sweeping lows into the ascending trendline/support.
📍 After CPI spike settles, looking for a NY Open breakout above 46,850 (key resistance).
📍 If we get a break + retest of 46,850, I’ll look for long entries targeting:
✅ TP1: 47,000
✅ TP2: 47,100
✅ TP3: 47,200 (liquidity extension)
❌ If CPI breaks below 46,700 and fails to recover, I’ll reassess for a bearish scenario.
🕒 No trades during initial CPI spike – waiting for structure confirmation post-news & into NY session.
📌 Plan: CPI grab → NY breakout → retest entry → continuation.
