SHORT ON US30US30 Has given us a nice CHOC (Change of Character) to the downside.
This indicates a huge potential of US30 dropping more after it pulls back into the supply zone that created the change.
Dollar news is also a catalyst today for this play. If news comes out good for PMI and makes the dollar rise... US30 could fall almost 3000 points over the next few days.
Take Advantage.
Us30short

US30 Swing Short!
HI,Traders !
#US30 keeps falling down
And the index broke the
Key wide horizontal level
Around 43924.6 which is now
A resistance and the breakout
Is confirmed so we are very
Bearish biased and we will
Be expecting a bearish
Continuation on Monday !
Comment and subscribe to help us grow !

US30 Bearish Breakout!
HI,Traders !
#US30 made a bearish
Breakout of the key horizontal
Level of 44822.3which also
Seems to have been a neckline
Of the small H&S pattern so
We are locally bearish biased
And we will be expecting a
Further bearish move down !
Comment and subscribe to help us grow !

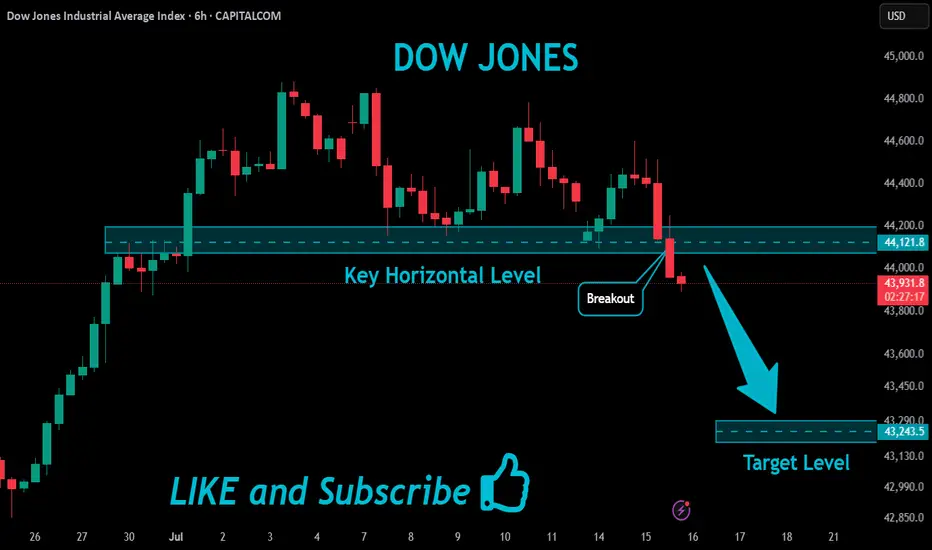
US30 Bearish Breakout!
HI,Traders !
#US30 index is trading in a strong downtrend,
and has broken through the key horizontal
level at 44121.8, reinforcing our bearish
outlook. We expect further declines !
Comment and subscribe to help us grow !
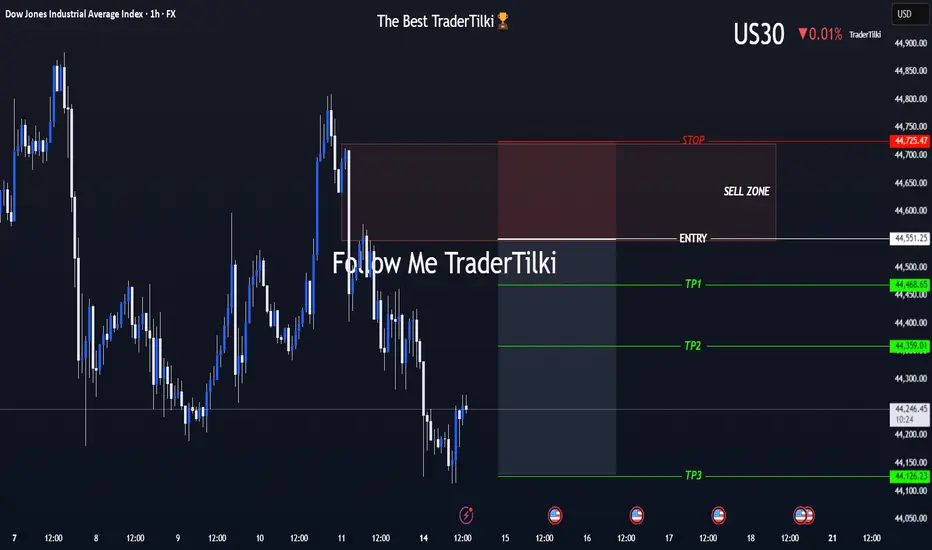
US30 (Dow Jones) Is On My Radar — The Moment’s Getting Close!Hey Guys,
I've marked my sell zone on the Dow Jones (US30) chart.
Once price reaches my entry range, I’ll be jumping into this high-probability trade setup.
🚪 Entry Levels: 44,551 – 44,632 – 44,677
🛑 Stop Loss: 44,725
🎯 Targets:
• TP1: 44,468
• TP2: 44,359
• TP3: 44,126
📐 Risk-to-Reward Ratio: Approximately 2.41 from the 44,551 entry
Your likes and support are what keep me motivated to share these analyses consistently.
Huge thanks to everyone who shows love and appreciation! 🙏
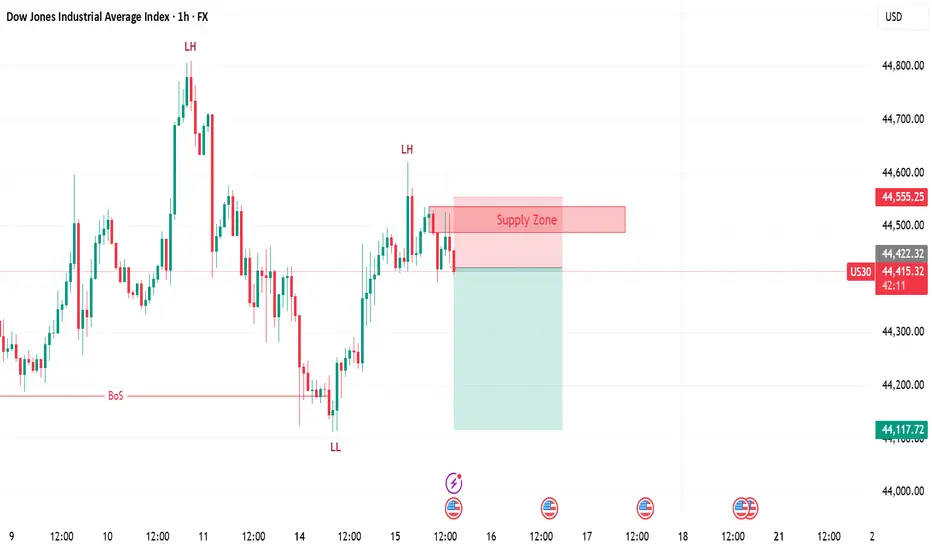
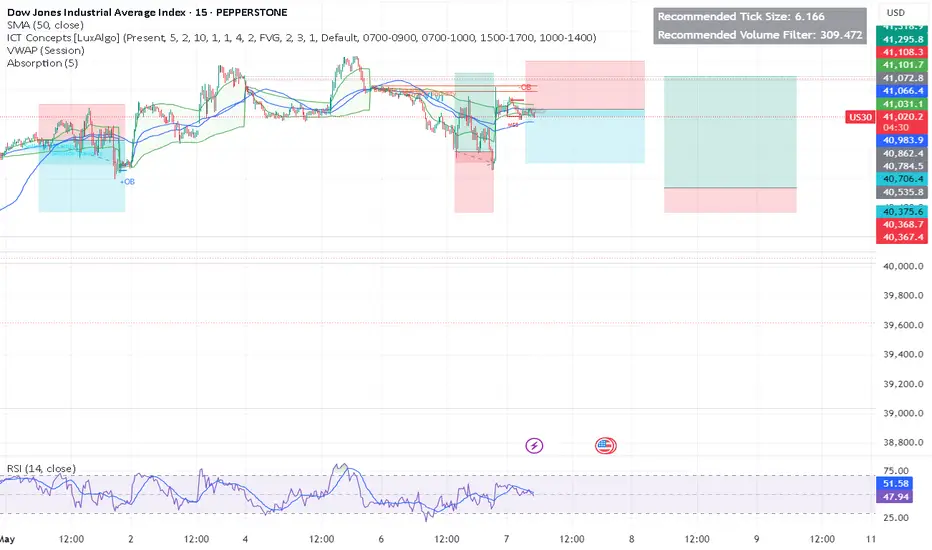
US30 | SELLConfirmation from 15 minute timeframe.
General trend in 1H is downward.
Trading with impulse.
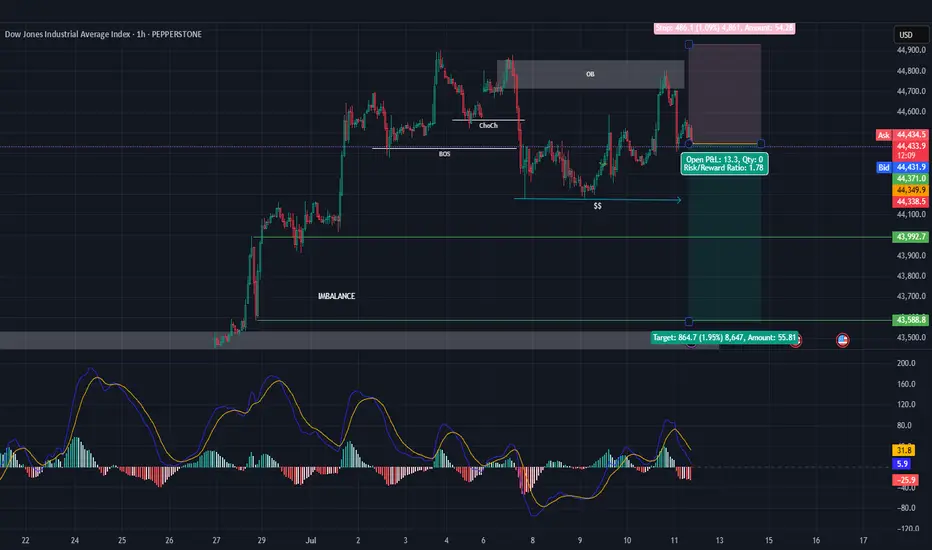
US30 - Short SellThe Dow Jones aka US30
* Overall trend is bullish
* Currently trading the retracement with the following points.
1. Valid OB
2. Liquidity to the sell side
3. Imbalance to the sell side
4. Price failed to break the previous HH activating the Bear positions, the question is How Deep The Retracement Will Be ? So we are closely monitoring the price action to adjust at any changes that the market might face.
US30 short bias- 9th July 2025
I have conducted a comprehensive multi-timeframe analysis of the US30 index, with particular focus on its recent price action and structural context.
Quarterly Timeframe:
On the three-month timeframe, the second quarter’s candle close is notably bullish, having engulfed the previous ten quarterly candles. This significant engulfing pattern suggests strong underlying momentum. Importantly, there has not yet been a body closure above this quarterly candle, which indicates that price may attempt to break above its range to establish new all-time highs.
Recently, price action reached an all-time high near a major psychological level of 45,000 before retracing sharply to a liquidity region around 37,500. Since this retracement, there has been substantial accumulation of bullish orders, reinforcing the potential for price to retest and surpass prior highs.
Monthly Timeframe:
On the monthly timeframe, price has approached a key liquidity region around 44,500, where it is currently encountering resistance. While the higher timeframe bias remains firmly bullish, it is reasonable to expect healthy retracements before new all-time highs are made. It is worth noting that price has already broken above significant monthly levels at 41,750 and 42,600.
A retracement to these regions to collect further liquidity remains plausible, although this scenario is speculative rather than confirmed at present. Consequently, my bias on the monthly timeframe remains neutral in the short term, pending further developments.
Weekly Timeframe:
Price action on the weekly timeframe mirrors that of the monthly. There is little of note beyond the observation that price absorbed considerable bullish orders at 41,750 and has since encountered resistance near 44,750, leading to a modest retracement. Given this structure, I maintain a neutral outlook on the weekly timeframe.
Daily Timeframe:
On the daily chart, we can observe that the bullish momentum initiated from the 43,000 order block region faced resistance at approximately 44,500. Price briefly broke above this region on Thursday, 3rd July, but quickly closed below it on Monday, indicating a lack of sustained buying interest to propel price higher.
This retracement suggests that the market is searching for a deeper liquidity area to support its next upward move. Notably, a bearish three-pin formation is present, implying that price may break below the recent lows around 44,150. Accordingly, my bias for today is bearish.
4-Hour Timeframe:
In alignment with the daily bias, the 4-hour timeframe indicates that price is likely to target Monday’s low at approximately 44,155. The next key liquidity region lies around 44,000, where substantial bullish orders were previously filled. I am currently waiting for price to offer a suitable entry region to sell towards 44,000.
I am also mindful that the FOMC minutes are scheduled for release today, which could introduce significant volatility. Should a valid setup emerge, I will look to enter a short position. Specifically, if the current 4-hour candle closes bearish, I intend to consider shorts from around 44,220.
---
Disclaimer:
This analysis is for educational purposes only and does not constitute financial advice. Always conduct your own research and manage risk accordingly.

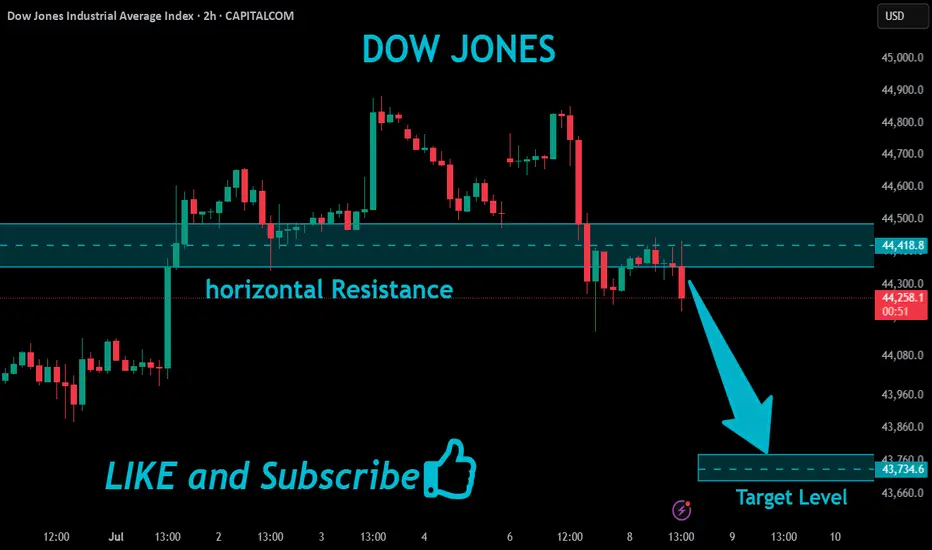
US30 Will Fall!
HI,Traders !
US30 made a retest
Of the key horizontal
Resistance level of 44418.8
From where we are
Already seeing a bearish
Reaction and we will
Be expecting a
Further bearish move down !
Comment and subscribe to help us grow !
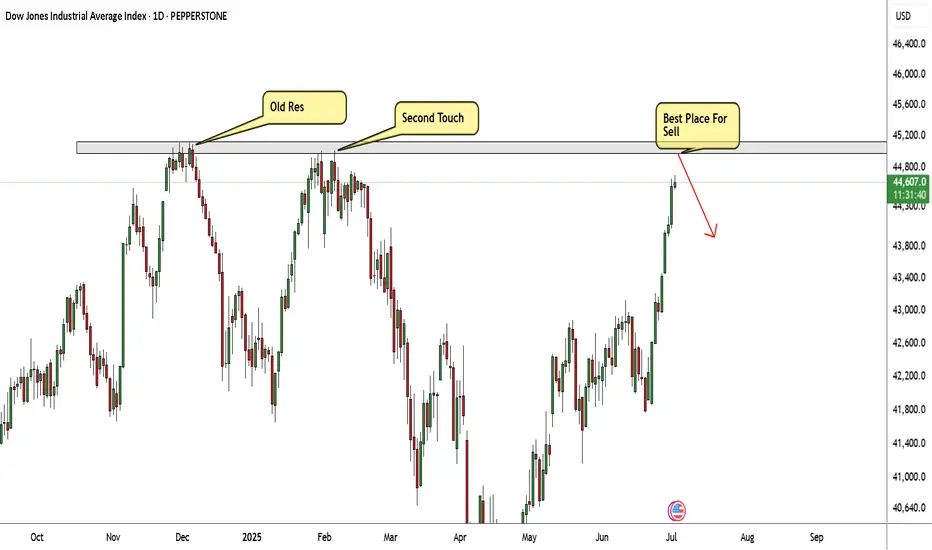
US30 Very Near Strong Res Area , Short Setup To Get 500 Pips !Here is my US30 Daily Chart , the price very near the highest price area , this res area forced the price to go down very hard 2 times so i think this time will be the biggest movement to downside , so i`m waiting the price to touch it and give me a good bearish price action and then we can enter a sell trade and targeting at least 500 pips . if we have a daily closure above then this idea will not be valid .
Dow Jones Industrial Average Index - 4h Chart (FOREXCOM)4-hour chart of the Dow Jones Industrial Average Index (US30) shows the price movement from late June to early July 2025. The current value is 43,057.7, reflecting a slight increase of +78.0 (+0.18%). The chart highlights key price levels, including a resistance zone around 43,324.1 and a support zone near 42,875.8, with recent price action showing a breakout above the resistance level.

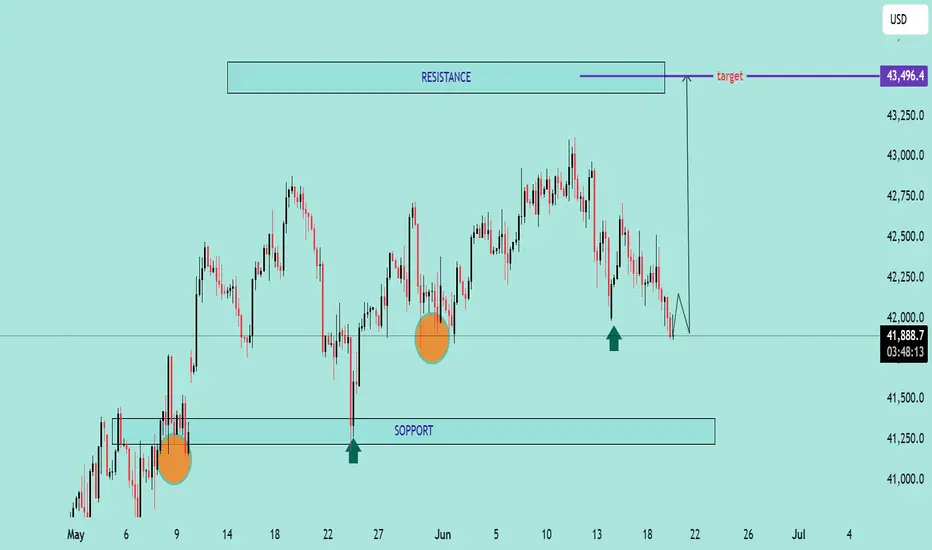
US30 Potential Rebound from Key Support Zone
US30 Potential Rebound from Key Support Zone 🚀📊
📉 Analysis Overview:
The US30 (Dow Jones Index) is currently testing a major support zone near the 41,800–41,900 range, a level that has held firm multiple times in the past (highlighted with green arrows and orange circles). This area has acted as a demand zone, leading to strong bullish reactions previously.
🔍 Key Technical Highlights:
🔸 Support Zone: Clearly respected at ~41,800. Price is once again bouncing here.
🔸 Resistance Zone: Around 43,250–43,500. This area has acted as a ceiling, where price struggled to break through.
🟢 Reversal Indicators: Multiple successful defenses of the support zone suggest accumulation and possible bullish reversal.
📈 Target Projection: If support holds, the price may rally toward the target zone near 43,496.4, as shown by the purple arrow.
📌 Conclusion:
As long as the 41,800 support holds, US30 shows bullish potential toward the 43,500 resistance. A break below this zone would invalidate the bullish scenario and shift focus back to the lower support near 41,250.
🛑 Risk Management Tip: Watch for confirmation candles and volume before entering long positions. Always set a stop-loss below the support zone.
US30 Under Pressure: Possible Short Setup Brewing on the 4HI'm currently eyeing the US30 (Dow Jones Index) for a potential short opportunity based on multi-timeframe structure 📊.
🔍 Weekly Overview:
The weekly chart continues to show sustained pressure, with this week and last week both closing bearish. The sellers are clearly in control at the macro level. 🔻
📆 Daily & 4H Structure:
Drilling down to the daily and 4-hour charts, we can clearly see a break of structure (BOS). The 4H specifically is showing textbook signs of a bearish trend with lower highs and lower lows forming consecutively 🪜🔽.
🎯 Trade Plan:
I'm watching for a pullback into equilibrium, ideally near the 50% level of the recent Fibonacci range. If price revisits that zone, I’ll be looking for short confirmations to ride the momentum back toward the previous lows, as marked on the chart. 🧠💸.

US30 – Bearish Setup Below Resistance Zone US30 – Bearish Setup Below Resistance Zone 🚨🟥
The US30 index is exhibiting signs of bearish momentum after repeated rejections from the key resistance zone near 43,200. Let's break down the technical picture:
🔍 Technical Analysis
📌 Resistance Zone (🟥 43,200 area)
Price was rejected twice from this resistance (marked by red arrows), showing strong seller presence.
Bearish candlesticks followed each touch, confirming exhaustion near this level.
📌 Support Zone (🟦 40,800 area)
The area around 40,800 has acted as a strong demand zone in the past (highlighted with green arrows and orange circles).
Price might revisit this area if current bearish structure continues.
📌 Intermediate Support (🟪 41,828)
This level serves as short-term support.
If broken, it could accelerate the decline toward the major support.
📌 Market Structure
Lower highs forming after each bounce indicate weakening bullish strength.
A potential bearish breakout pattern is forming (highlighted by the projected path).
📈 Conclusion & Trade Outlook
Bias: Bearish 📉
Trigger: Break below 41,828 support
Target: 40,800 zone
Invalidation: Break and close above 43,200 resistance

US30 Technical Analysis – 8th June 2025c US30 Technical Analysis – 8th June 2025
🔍 Chart Overview:
The chart shows a classic range-bound structure with clearly defined support and resistance zones.
📍 Key Zones:
🔼 Resistance Zone: ~$42,900 – $43,000
Marked by multiple rejections (🔴 red arrows).
Price has failed to close above this area convincingly.
Sellers are actively defending this level.
⚠️ Bearish pressure likely to increase if price stays below this level.
🔽 Support Zone: ~$41,750 – $41,850
Marked by strong bullish reactions (🟢 green arrows).
Buyers have stepped in consistently in this demand zone.
A breakdown below this level could trigger further downside momentum.
📈 Current Price Action:
The price is hovering around $42,781.3, just below the resistance zone.
The latest candlestick shows rejection from the top, forming a bearish wick, indicating potential reversal pressure.
The large downward arrow (⬇️) on the chart suggests a bearish bias is expected by the analyst.
📉 Outlook & Strategy:
🔻 Bearish Scenario (High Probability):
If price fails to break and sustain above $43,000, expect a move back down towards the support zone at ~$41,800.
A breakdown below support could lead to deeper downside, targeting $41,500 or lower.
🛑 Invalidation:
A clean breakout and daily close above $43,000 would invalidate the bearish setup and suggest potential continuation higher.
🎯 Trading Tips:
🔹 Short Bias: Look for short entries near resistance with tight stops above $43,000.
🔹 Target: $42,200 → $41,800
🔹 Risk Management: Always maintain a good risk-to-reward ratio and use proper stop-loss.
📌 Conclusion:
⚠️ The chart favors a bearish reversal from resistance unless bulls can push decisively above $43,000. Traders should watch for rejection patterns or breakdown confirmations to align with the bearish move

SHORT ON US30US30 Has given us a change of character to the downside with a nice retest creating a lower high.
I will be selling us30 to the next demand zone looking to catch 500-1000 points.

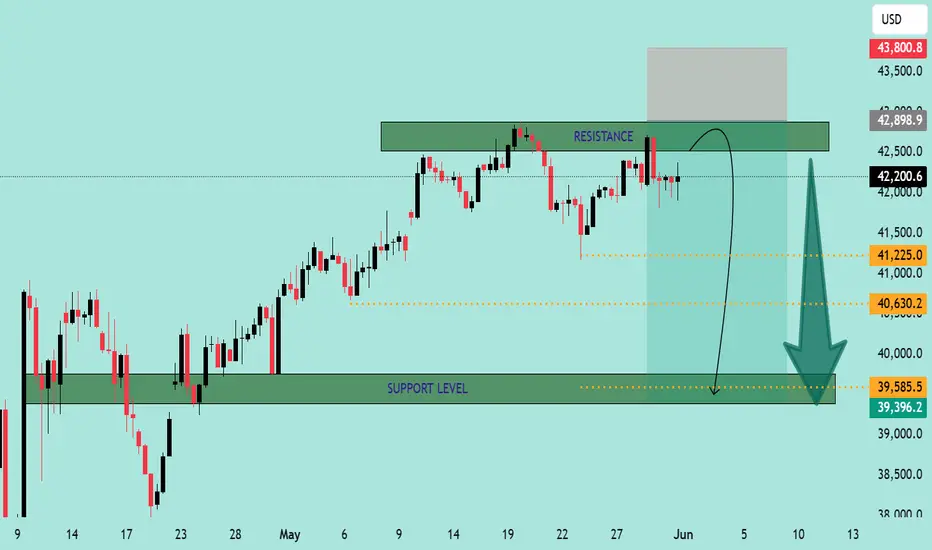
US30 Bearish Rejection at Resistance – Potential Drop Ahead📉 US30 Bearish Rejection at Resistance – Potential Drop Ahead 🚨
The US30 (Dow Jones Industrial Average) is exhibiting signs of bearish weakness after rejecting a strong resistance zone around 42,898.9 - 43,800.8. Here's a breakdown of the current market structure and outlook:
🔍 Technical Analysis
📌 Resistance Zone (Sell Pressure)
Price has failed to break above the marked resistance area multiple times.
Strong wicks and rejections indicate seller dominance near the top.
A short-term bounce into the resistance is anticipated before a likely reversal.
📌 Support Zone (Buy Interest)
The key support is at 39,396.2 - 39,585.5.
This zone has previously served as a strong demand area, with multiple bullish reversals in the past.
📌 Bearish Projection Path
Chart shows a potential rejection pattern playing out.
Price is expected to retest the resistance, then decline towards the support zone.
Intermediate support levels:
41,225.0
40,630.2
🔄 Outlook
🛑 Scenario A (Likely):
Price tests the upper resistance again and forms a double top or shooting star before declining toward the 39.5k support zone.
✅ Scenario B (Invalidation):
If price closes above 43,800 with strong volume, bearish bias will be invalidated, and a bullish continuation can be expected.
🧭 Trade Idea (Not Financial Advice)
🔹 Entry: Short near 42,800–43,000 (after confirmation)
🔹 Target 1: 41,225
🔹 Target 2: 40,630
🔹 Final Target: 39,585
🔹 Stop Loss: Above 43,800
Conclusion:
⚠️ The chart indicates a high-probability short setup unless bulls manage a strong breakout above resistance. Eyes on the price action near resistance for confirmation. 📉📊
SHORT ON US30US30 Has given us a nice pullback to a major supply area.
I am expecting price to rise a little higher into the supply are then give us a major drop to the previous swing low for over 1000 points!!!
I have placed a sell limit order withing the supply area looking to short us30 for the rest of the week.

Dow Jones Short Term Sell Trading PlanM15 - Strong bearish momentum
Lower lows on the moving averages of the MACD indicator.
Until the two Fibonacci resistance zones hold I expect the price to continue lower further.
If you enjoy this idea, don’t forget to LIKE 👍, FOLLOW ✅, SHARE 🙌, and COMMENT ✍! Drop your thoughts and charts below to keep the discussion going. Your support helps keep this content free and reach more people! 🚀
--------------------------------------------------------------------------------------------------------------------
Disclosure: I am part of Trade Nation's Influencer program and receive a monthly fee for using their TradingView charts in my analysis.

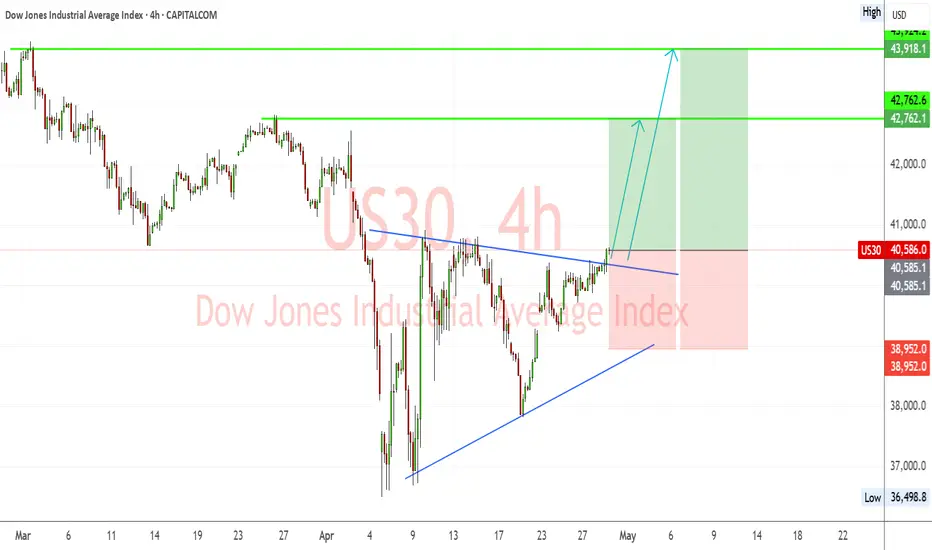
US30 Breakout from Symmetrical Triangle – Bullish Targets EyedUS30 (Dow Jones) has successfully broken out of a symmetrical triangle consolidation pattern, signaling a shift toward bullish momentum. The breakout is occurring after a strong recovery from April lows, with higher lows supporting upward price pressure.
🔹 Chart Structure:
Symmetrical triangle with a clean breakout above descending resistance.
Series of higher lows indicating accumulation.
Bullish breakout confirmed with price pushing above the 40,580 zone.
🔑 Key Levels:
Current Price: 40,586
Breakout Confirmation Level: 40,580
Immediate Resistance/TP1: 42,762
Major Resistance/TP2: 43,924
Support Zone: 38,950
Invalidation/Stop Level: Below 38,950
✅ Bullish Confluence Factors:
Breakout of symmetrical triangle pattern
Higher lows indicate bullish strength and accumulation
Momentum shift visible on lower timeframes
Positive correlation with improving US equity market sentiment
Anticipation of dovish Fed tone could boost equities
🧠 Fundamental Context:
Market is cautiously optimistic ahead of FOMC this week; dovish stance expected due to recent soft economic indicators.
Earnings season tailwinds and lower bond yields support index gains.
Ongoing political and tariff-related headlines may cause volatility, but technical breakout remains in focus.
💡 Trade Idea:
Bias: Bullish
Entry: On successful retest of 40,580 or continuation above 40,600
TP1: 42,762
TP2: 43,924
Stop Loss: Below 38,950
📌 Note: Watch for pullbacks to triangle resistance-turned-support. FOMC and US macro data releases midweek can impact momentum.
DOW/US30 - we hope everyone make million last nightTeam, yesterday was a big win for all of us, twice the DOW/NAS massive win
today, the market will likely pull back toward the price set in the chart
make sure you have tight stop-loss
also, once it drops more than 50 points, bring stop loss to BE
we are looking at around 40930-40850
The interest rate decision within 12 hours time frame,
we expect the market will be volatile if it dumps toward our LONG entry position, which I set out in the chart.
Follow that, and you will kill the market with me
UNTIL then, I wish you all the best
US30 Trading Into Major Resistance - Look For Dow Jones Retrace🔍 US30 Analysis: At the moment, I'm watching the US30 as it looks overextended 📈 and is trading into previous highs. 🧱 If you look left on the chart, it's approaching a key resistance level on both the weekly and daily timeframes.
I’m expecting a potential retracement 🔁 and monitoring for a bearish break of structure on the 30-minute timeframe ⏱️ as a possible setup for a counter-trend short 📉 — aiming for the imbalance zone visible on that timeframe.
📏 Drawing a Fibonacci retracement from the recent swing low to high, the 50% equilibrium 🔄 lines up perfectly with the imbalance area, adding confluence to the idea.
📚 This is shared for educational purposes only and should not be considered financial advice 💼.

US30 Dow Jones Trade Idea📉 The US30 (Dow Jones) is currently overextended! In this video, we analyze the price action 🔍 and go over my trading plan for a potential short 📊—if the setup plays out as discussed. 🚨 Not financial advice! 🚫e.
