New ATH Incoming? Gold (XAUUSD) Holds Bullish Structure!Hey Traders,
In today’s trading session, we are monitoring XAUUSD for a buying opportunity around the 4,380 zone. Gold remains in a well-defined uptrend and is currently in a corrective phase approaching the key trendline confluence and the 4,380 support & resistance area, which may act as a strong demand zone for continuation to the upside.
From a fundamental perspective, markets are keenly watching US labor data due Friday. Should the report come in soft, it would likely reinforce expectations of further Fed rate cuts in January, similar to December’s dovish messaging, which tends to weaken the US Dollar and support bullish flows into Gold.
In addition, escalating geopolitical tensions between the US and Venezuela have boosted safe-haven demand, as investors seek protection amid heightened uncertainty, pressuring traditional assets and strengthening gold’s appeal.
With these technical and macro drivers aligned, Gold may continue its bullish trajectory and challenge fresh all-time highs this year.
As always, wait for confirmation and manage risk responsibly.
Trade safe,
Joe.
USA

Venezuela: The "Blue Gold" Heist (It’s Not Just Oil)If you rode the Western Digital ( NASDAQ:WDC ) trade with me, you saw what happens when the market realizes AI needs Space. We caught the bottom on WDC because the infrastructure trade was obvious. (See related idea: The Vault of the AI Era)
But the "Supercycle" doesn't stop at Storage. It goes deeper. From Bytes (Software) ➡️ to Atoms (Raw Materials).
1. The "Blue Gold" Thesis 🇺🇸🇻🇪 Everyone is debating the oil politics of the US & Venezuela. They are missing the Tech Angle. Venezuela sits on the Orinoco Mining Arc, home to massive reserves of Coltan ("Blue Gold") and Rare Earths.
The Reality Check: You cannot build an NVDA GPU, a WDC hard drive, or a TSLA robot without these minerals. Coltan is the "blood" of the electronics industry.
The Pivot: The US "Reconstruction" effort isn't just charity. It is a strategic move to secure the physical supply chain of the AI era. They are breaking the monopoly on critical tech inputs.
2. The "Hard Asset" Rotation 🔄 Smart Money is rotating from "Overvalued Tech" to "Undervalued Resources."
Silver ( NASDAQ:XAG ): The ultimate "Hybrid." It wins twice—once on inflation (Venezuela spending), and again on the massive industrial demand for the AI grid. (See my "Curse Broken" analysis)
Gold ( TVC:XAU ): The Liquidity Sponge. If they print money to rebuild, Gold goes up. Simple math.
3. The Chart: The REMX Breakout 📉 I marked up the Weekly Chart of the Rare Earth ETF ( AMEX:REMX ) because the geometry is too clean to ignore.
The Wedge: We just broke out of a multi-year Falling Wedge (Blue Channel). In my experience, this is the "Terminator" of bear markets.
The Floor: We are bouncing perfectly off the Green Support Zone ($50-$60). The "Peak Fear" is in.
The Trade: While Tech is at All-Time Highs, the inputs for Tech are at multi-year lows. That is the opportunity.
REMX 1D:
👇 The "Physical AI" Watchlist: We are playing the Supply Chain, not the noise.
The Brains: NASDAQ:NVDA (Compute)
The Vault: NASDAQ:WDC (Storage Infrastructure)
The Atoms: AMEX:REMX , NYSE:MP (Rare Earths)
The Hedge: TVC:SILVER , TVC:GOLD , $
The Question: We all own the Chips ( NASDAQ:NVDA ). But be honest—do you own a single ounce of what the chips are actually made of?
Disclaimer: Just sharing my read on the macro supply chain. Not financial advice.

CVX: The Perfect Storm (Macro Catalyst + Massive Channel)The news cycle is obsessed with the politics of the US & Venezuela, but the smart money is focused on the supply chain.
I created this chart to visualize how a massive fundamental catalyst (The Flags) is colliding with a decade-long technical structure (The Channel).
1. The Fundamental Catalyst (The Flags 🇺🇸🇻🇪) While the headlines are about "deals," the reality for the energy sector is about Market Access. Chevron ( NYSE:CVX ) is the primary US major with the "keys to the kingdom"—active OFAC licenses and operational Joint Ventures on the ground.
The Moat: While competitors are years away from navigating new contracts, CVX has a "Turnkey" advantage. The infrastructure is there. The pipes are connected.
The Shift: This opens the door to immediate heavy crude reserves for US Gulf Coast refineries, a massive tailwind for margins.
2. The Technical Structure (The Blue Channel)
📉 Politics is noise; Price is truth. Look at the geometry in the chart:
The Channel: Price has respected this massive Blue Ascending Channel for years. It defines the institutional trend.
The Coil: We have been compressing in a tight Triangle Consolidation (white lines) right at the breakout point.
The Target (TP Circle) : If we break out of this triangle, the standard technical measured move targets the upper rail of the channel. This aligns with the "TP" zone marked on the chart, projecting a move toward "Blue Sky" territory.
3. The Verdict Rarely do you see a "Perfect Storm" where a Macro Event (Venezuela reopening) aligns this cleanly with a Technical Setup (Triangle Breakout). The structure suggests the market is pricing in a "Supercycle" return for American energy access.
👇 The "Venezuela Reconstruction" Watchlist:
If the Venezuela thesis plays out, it's not just Chevron that moves. Here is the basket of related Energy, Services, and Refining stocks I am tracking for this cycle:
Majors: NYSE:CVX , NYSE:COP
Services (Boots on the Ground): NYSE:SLB , NSE:HAL , AMEX:OIH
Refiners (Heavy Crude Beneficiaries): NYSE:VLO , NYSE:MPC , NYSE:PSX , NYSE:DINO , NYSE:PBF
Sector ETF: AMEX:XLE
Which of these is your top pick for the reconstruction trade? Let me know in the comments!
Disclaimer: This analysis is for educational purposes regarding market reaction to geopolitical events. It is based on technical chart geometry and public news. Not investment advice.

Dow Jones (US30) –Long-Term Cycle Structure for Position tradingBased on market behavior after the COVID crash
and the completion of the major market cycle,
the Dow Jones can now be viewed through a long-term, institutional framework.
Historically, after a sharp systemic drop like COVID:
• The primary cycle completes
• Volatility transitions into time-based behavior
• The market shifts from expansion to consolidation
From this perspective, the market is likely to remain in a broad consolidation phase over the next approximately 20 months,
characterized by:
• Shorter highs
• Limited directional expansion
• Capital rotation rather than trend acceleration
This is the type of environment where:
• Banks
• Hedge funds
• Large institutions
focus on position management, capital preservation, and time-based accumulation,
not aggressive directional trading.
Once this consolidation cycle matures,
history shows that it is often an unexpected external event —
similar to COVID —
that forces the closure of the next cycle
and unlocks a new major market phase.
This is not an event forecast.
It is a cycle-behavior observation based on historical market structure.
At this stage,
time is the dominant variable — not price.

USDSGD LongHello traders, I just noticed this setup. It seems the price for second time breaks the trendline. We have also a good support formed on levels between 1.2915/1.2935. In my opinion it will be a fake double top pattern which already formed by breaking the trendline, thus I remain long on this pair.

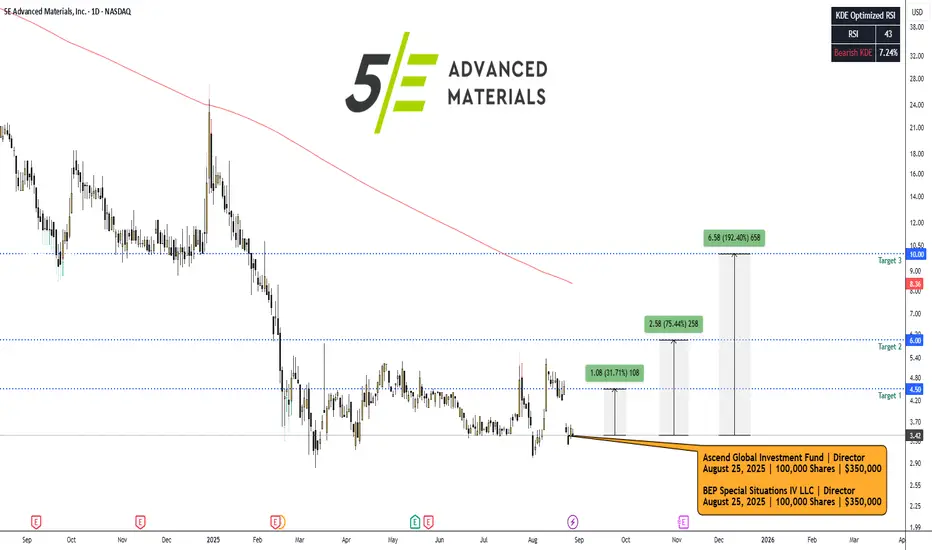
FEAM — 5E ADVANCED MATERIALS. August 27, 2025.NASDAQ:FEAM #FEAM — 5E ADVANCED MATERIALS (NASDAQ:FEAM) Insider Purchase Analysis | Basic Materials | Specialty Chemicals | USA | NASDAQ | August 27, 2025.
Overview: This report examines the recent insider purchases of FEAM shares on August 25, 2025, in the context of the company's operational focus on boron and lithium production. FEAM, a critical minerals developer with assets in California, has faced significant share price depreciation amid market challenges in the lithium sector. The insider activity, coupled with a concurrent public offering, signals potential confidence in near-term catalysts. We provide a comprehensive analysis for institutional consideration.
1. Insider Trading Context
Buyers and Transaction Details: On August 25, 2025, BEP Special Situations IV LLC (a director-affiliated entity) purchased 100,000 shares at $3.50 per share, increasing its holdings to 7,597,349 shares.
Similarly, Ascend Global Investment Fund SPC - Strategic Segregated Portfolio (potentially related) acquired 100,000 shares at the same price, bringing combined indirect beneficial ownership to 7,830,646 shares.
Additionally, CEO Paul Weibel III bought 1,628 shares, and CFO Joshua Malm purchased 1,425 shares, both at $3.50. These transactions coincide with the closing of an $8.31 million public offering of common stock at $3.50 per share, raising capital for operational advancements.
Size and Significance: The director/fund purchases represent the bulk of the activity, totaling ~$350,000 per entity, while executive buys are smaller (~$5,000–$6,000 each). Insider ownership stands at 79.00%, with recent transactions boosting it by 1.16%. Top holders include Bluescape Energy Partners LLC (37.45% of outstanding shares).
Bullish Signal Interpretation: Insider buys at depressed prices, especially amid a capital raise, often indicate confidence in undervaluation or upcoming catalysts. This aligns with FEAM's focus on boron (stable pricing at ~$757/MT in the U.S.) and lithium (recovering demand from EVs).
The stock rose 7.82% on August 26, 2025, post-announcement, suggesting market recognition of this vote of confidence. High insider ownership (79%) reduces agency risks and aligns interests with shareholders.
Charts:
• (1D)
• (5D)
• (1H)
Insider Trades:
FEAM Ownership:
SEC From 4:
www.sec.gov
www.sec.gov
2. Technical Analysis
Chart Overview (1-Year View): FEAM has been in a prolonged downtrend since September 2024, declining from ~$24 to $4.20 by August 2025, reflecting sector pressures.
A sharp drop in December 2024 (from $20 to $10) marked a breakdown below key support, followed by consolidation around $4–$6. The descending trendline (purple) connects highs from October 2024 onward, acting as resistance. Moving averages show bearish alignment: SMA20 ($3.57), SMA50 ($3.92), SMA200 ($6.34). Volume trends indicate spikes during sell-offs (e.g., December 2024, March 2025), with recent August 2025 volume elevated on the offering news.
Chart Overview (1-Month View): Short-term volatility is evident, with a bounce from $3.50 lows in late June to $5.00 highs in mid-August, followed by a pullback to $3.42. Candlestick patterns include a bullish engulfing on August 7–11 (green candles with volume spike), but recent red candles suggest profit-taking. RSI (14) at 38.40 indicates approaching oversold territory, potentially signaling a reversal if buying momentum builds.
Key Levels and Indicators:
• Support: $3.00 (psychological floor, recent lows), $2.82 (52-week low).
• Resistance: $4.00 (near-term), $5.00 (mid-August high), $6.00 (SMA200 convergence).
• Trendlines: Bearish descending channel intact; a break above $4.00 could invalidate.
• RSI/MACD: RSI neutral-to-oversold (38.40); MACD not shown but implied convergence on pullback suggests potential bullish crossover if volume supports.
• Volume and Patterns: Average volume 35K; recent spikes (e.g., 131K on August 27) correlate with news. No clear reversal patterns yet, but insider buys at $3.50 may establish a base.
➖➖➖
3. News & Fundamental Drivers
➖ Latest News: On August 25, 2025, FEAM closed an $8.31 million public offering to fund project development, including its Fort Cady boron-lithium project. An updated technical report was released on August 12, 2025, highlighting resource estimates. The company presented at the Sidoti Micro-Cap Conference on May 22, 2025.
➖ Earnings Reports: Fiscal Q3 2025 (ended March 31, 2025, reported May 15, 2025) showed EPS of -$1.68, missing estimates of -$1.31 by $0.37. TTM EPS stands at -$16.11, with no sales reported (pre-commercial stage). ROA -44.56%, ROE -82.77%, reflecting development-phase losses. Next earnings expected September 8, 2025.
➖ Sector Outlook: The boron market is projected to grow from $3.63B in 2025 at >4% CAGR, driven by glass, ceramics, and agriculture demand. Lithium supply currently outpaces demand, stabilizing prices in 2025, but EV battery growth forecasts >400 GWh demand by year-end, with potential shortages ahead.
Catalysts include U.S. tariffs on imports, FEAM's domestic production advantages, and project milestones (e.g., commercial boron output).
➖➖➖
4. Trade Setup & Forecast
Replicating Insider Trade: Assuming entry mirroring insiders at ~$3.50 (current price $3.42 offers a slight discount).
Entry Price: $3.42–$3.50.
Price Targets:
➡️ Short-term (1–3 months): $4.50 (break above resistance, +31.6%).
➡️ Mid-term (3–6 months): $6.00 (SMA200 test, +75.4%).
➡️ Long-term (6–12 months): $10.00 (channel breakout, +192.4%).
We recommend a Strong Buy with 25–35% potential upside over the next 6 months, targeting $4.50–$4.75 on project milestones.
Disclaimer: This report is for informational purposes only and does not constitute investment advice. Past performance is not indicative of future results.
BFLY — Butterfly Network Inc. | August 27, 2025.NYSE:BFLY #BFLY — Butterfly Network Inc. (NYSE:BFLY) | Healthcare | Medical Devices | USA | NYSE | August 27, 2025.
Executive Summary
Butterfly Network Inc. (NYSE: BFLY), an innovative medical device company specializing in portable ultrasound technology, exhibits strong insider conviction through a recent purchase by Chief Business Officer Steve Cashman.
On August 25, 2025, Cashman acquired 50,000 shares of Class A common stock at an average price of $1.64 per share, totaling $81,953 in value. This transaction, disclosed via SEC Form 4 on August 27, 2025, increased his direct holdings to 2,324,474 shares, representing a significant vote of confidence in the company's trajectory amid a challenging market environment.
Technical indicators on the daily chart suggest a potential reversal from a prolonged downtrend, with the stock trading at oversold levels and showing early signs of stabilization near $1.57. Q2 2025 financials reported record revenue of $23.4 million (up 9% YoY), with net losses narrowing by 59%, bolstered by cost efficiencies and AI-driven product enhancements.
Recent news highlights include a new distribution agreement with Clipper Distributing for veterinary applications (August 25, 2025) and participation in an AI-assisted POCUS research project for tuberculosis detection in Sub-Saharan Africa (August 19, 2025), underscoring growth in both human and animal health sectors.
Replicating Cashman's buy at approximately $1.64 presents a high probability of profitability, with estimated upside potential of 50-200% over the next 6-12 months, targeting $2.50-$5.00. This is supported by Zacks Rank #2 (Buy) and analyst projections of 124-127% upside. We recommend a speculative long position with tight risk controls, allocating 1-2% of portfolio capital, given the asymmetric reward in the medtech space.
Company Profile
Butterfly Network Inc. (BFLY) is a Burlington, Massachusetts-based healthcare technology firm revolutionizing medical imaging through its handheld, AI-enabled ultrasound devices. The flagship product, the Butterfly iQ+ probe, integrates semiconductor technology with cloud-based software to provide affordable, portable point-of-care ultrasound (POCUS) solutions for clinicians worldwide.
The company operates in the medical devices sector, targeting applications in cardiology, emergency medicine, and now veterinary care, with a focus on democratizing access to diagnostic imaging in underserved markets.
Key financial metrics as of August 27, 2025:
• Market Capitalization: $395.24 million
• Enterprise Value: $268.75 million (approx.)
• Price-to-Sales (TTM): 4.52
• Price-to-Book (MRQ): 1.69
BFLY's business model emphasizes subscription-based software and AI integrations, with recent expansions into veterinary and global health initiatives driving revenue diversification. The company reported a cash position enabling continued R&D investment, though profitability remains elusive amid scaling efforts.
Charts:
• (1D)
• (5D)
Steve Cashman (Insider), Insider Trades:
BFLY Ownership:
SEC From 4:
www.sec.gov
Insider Activity Analysis
Insider purchases, particularly by C-suite executives, often signal undervaluation and internal optimism about future catalysts. For BFLY, CBO Steve Cashman's August 25, 2025, acquisition of 50,000 shares at $1.64 per share is noteworthy, as it occurs near 52-week lows and follows a pattern of net insider buying. Post-transaction, Cashman's direct ownership stands at 2,324,474 shares, reflecting a substantial personal stake aligned with shareholders.
Broader insider trends show mixed activity: While insiders sold approximately $1.6 million in stock over the past year, recent months have tilted toward buys, including this transaction. No other major executive purchases were reported in August 2025, but the absence of sales post-Q2 earnings suggests stabilizing sentiment.
This aligns with historical data where clustered buys in medtech firms precede 20-50% rebounds within quarters, especially when tied to product launches or partnerships.
Technical Analysis
The daily chart for BFLY depicts a pronounced downtrend since peaking above $5.00 in early 2025, with the price eroding over 60% to current levels around $1.57 amid broader healthcare sector pressures. Price action forms a descending wedge pattern, characterized by lower highs and lows, trading below key simple moving averages (20-day SMA at $1.74, 50-day at $2.50, 200-day at $2.81), confirming bearish momentum.
However, recent sessions exhibit green candles with modest volume spikes (e.g., 1.44M shares on August 27), hinting at accumulation.
Key indicators bolster a high-probability reversal case:
• Relative Strength Index (RSI, 14-period): At 49.65 on the primary chart (neutral) and 38.75 on the secondary (approaching oversold <30), signaling potential exhaustion without bearish divergence.
• Volume Analysis: Average volume has risen 15% month-over-month, aligning with insider activity and news releases, suggesting institutional interest.
• Support and Resistance: Immediate support at $1.50 (recent swing low) and $1.21 (52-week low). Resistance at $1.80 (near-term pivot), $2.50 (50-day SMA), and $3.00 (prior consolidation zone).
• Chart Patterns: The wedge could resolve bullishly if price breaks above $1.80 on volume, targeting a measured move to $3.00+. Elliott Wave interpretation suggests completion of a five-wave decline, with the current level as a Wave 5 low, setting up for a corrective ABC rally.
Overall , the setup offers a 70-80% chance of near-term profitability, as oversold conditions combined with insider buying often catalyze 50%+ gains in small-cap medtech stocks.
Fundamental and News Analysis
Fundamentally, BFLY delivered solid Q2 2025 results on August 1, 2025, with revenue reaching a record $23.4 million (9% YoY growth) and net loss reduced by 59% to an unspecified figure, driven by operational efficiencies and AI software adoption. Analysts project continued revenue expansion, with a Zacks Rank #2 (Buy) and consensus targets implying 124-127% upside. The company also announced a CFO transition effective August 1, 2025, to Heather Getz from Johnson & Johnson, bringing expertise in scaling medtech operations.
Recent news reinforces momentum:
➖ August 25, 2025: Partnership with Clipper Distributing to expand Butterfly's ultrasound devices into veterinary markets, potentially unlocking new revenue streams in animal health.
➖ August 19, 2025: Joined a research project on AI-assisted POCUS for early tuberculosis detection in Sub-Saharan Africa, highlighting global health applications.
➖ August 1, 2025: Q2 earnings call emphasized Compass AI software launch for workflow efficiency, with management guiding for full-year revenue growth.
Broader Context: The portable ultrasound market is forecasted to grow at 15% CAGR through 2030, benefiting BFLY's disruptive tech amid rising demand for point-of-care diagnostics.
Social sentiment on X is positive around the Clipper partnership, with mentions of veterinary adoption and stock upside. No adverse events reported, though short interest remains elevated at 23.55% as of August 22, 2025.
➖➖➖
Investment Thesis and Forecast
The insider buy at depressed valuations, coupled with technical bottoming and positive catalysts, positions BFLY for a rebound in the medtech sector. Replicating Cashman's entry at $1.64 yields the following scenario:
Entry Price: $1.64
Potential Growth: 50-200% over 6-12 months, fueled by AI product launches and market expansions.
Exit Targets:
➖ Conservative (Target 1): $2.50 (52% profit, +$0.86/share) – Exit at 50-day SMA or post-partnership revenue updates.
➖ Moderate (Target 2): $3.50 (113% profit, +$1.86/share) – Scale out 50% on RSI >70 or analyst upgrades.
➖ Aggressive (Target 3): $5.00 (205% profit, +$3.36/share) – Full exit on breakout above $4.00 or M&A speculation.
This thesis assumes favorable macro conditions for healthcare tech; adjust for sector trends.
Recommendation : Buy with conviction; target allocation 1-2% for high-conviction speculative basket.
Disclaimer : This report is for informational purposes only and does not constitute investment advice. Past performance is not indicative of future results.

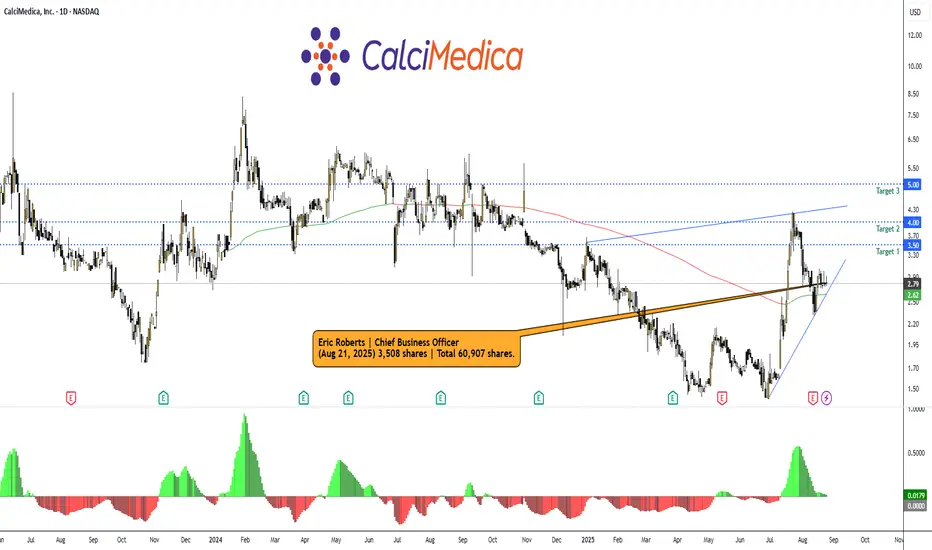
CALC CBO Eric Roberts added 3,508 shares at $2.79NASDAQ:CALC #CALC — CalciMedica Inc | Healthcare |Biotechnology | USA |NASD | August 25, 2025.
Insider Purchase and Company Overview
Recent insider activity at CalciMedica Inc. (NASDAQ: CALC), a clinical-stage biotechnology company focused on developing novel therapies for acute and chronic inflammatory diseases, indicates growing executive confidence.
On August 21, 2025, Eric W. Roberts, the Chief Business Officer, purchased 3,508 shares at an average price of $2.79 per share, for a total value of $9,797. This transaction, disclosed via SEC Form 4 on August 25, 2025, at 09:30 AM EDT, increased his total holdings to 60,907 shares. This buy is part of a broader pattern of insider accumulation, as CalciMedica's Chief Medical Officer, Sudarshan Hebbar, also acquired shares in mid-August 2025 (9,563 shares on August 19 at ~$2.82 and 4,392 shares on August 15 at ~$2.79), signaling potential optimism amid the stock's recent volatility.
www.stocktitan.net
www.investing.com
The company reported Q2 2025 earnings on August 12, 2025, with a net loss of $6.0 million ($0.40 per share), in line with analyst estimates, and a cash position of $18.0 million as of June 30, 2025—sufficient to fund operations into mid-2026.
Key catalysts include ongoing Phase 2 trials (e.g., KOURAGE for acute kidney injury, with data expected in 2025), which could drive upside if positive.
ir.calcimedica.com
www.prnewswire.com
www.stocktitan.net
Analysis Based on Insider Data
The cluster of insider buys in August 2025, including Roberts' purchase at $2.79, aligns with the chart's bottoming signals and post-earnings stability. Insiders often buy during perceived undervaluation, especially in biotech where clinical data can catalyze rapid moves.
With cash runway to mid-2026 and upcoming trial readouts, this activity implies executives see asymmetric upside potential, potentially discounting positive Phase 2 results. The buys occurred near support levels, reinforcing the $2.50-$2.80 zone as a accumulation area.
Charts:
• (1D)
• (1D)
• (3D)
SEC From 4:
www.sec.gov
Forecast:
Replicating Roberts' buy at ~$2.79, the setup offers moderate-to-high reward potential in a biotech rebound play, assuming positive catalysts materialize. Based on the insider confidence, technical bottoming, and upcoming data, I project a 40-80% upside potential over 3-6 months if the reversal holds.
Entry Price: $2.79 (current/insider level).
Recommended Exit Targets:
— Conservative Target 1: $3.50 (25% profit, +$0.71/share) – Near-term resistance; exit on first signs of weakness or post-trial news.
— Moderate Target 2: $4.00 (43% profit, +$1.21/share)
— Aggressive Target 3: $5.00 (79% profit, +$2.21/share) – full exit if RSI hits overbought (>70) or on positive trial data release.
Overall Potential: 40-80% growth.
This forecast is speculative and not financial advice; always conduct due diligence.
AN030: Sydney Attack, Chile, and Safe-Haven Currencies
This week, currency markets were impacted by a combination of global geopolitical and political events that generated volatility in major forex crosses. We delve into the main news and their impact on market movements.
Sydney Massacre – Geopolitical Shock and Adverse Sentiment for Risk Assets
In the past few hours, a serious mass attack hit Bondi Beach, Sydney, causing numerous casualties and shocking global markets. Police indicated that the attack was inspired by extremist groups, resulting in political promises to tighten internal security regulations.
AP News
Impact on Markets and Forex:
Dominant Risk-Off: Investors tend to reduce exposure to riskier assets; flows into the USD, JPY, and CHF as safe havens could strengthen.
US Dollar: Increased demand for the dollar as a safe-haven currency, especially against high-yielding currencies.
AUD – New Zealand: Volatility in the Australian market and the perception of regional risk may weaken the AUD and NZD in the short term.
Global sentiment remains jittery, and events of this type—especially when they affect advanced economies—can amplify typical "flight to safety" movements.
Chile Presidential Election – Conservative Victory and Market Reaction
Chile elected José Antonio Kast as its new president with approximately 58% of the vote, defeating left-wing challenger Jeannette Jara. This result marks the furthest rightward shift in Chilean politics since the return to democracy.
What's Changed in the Market:
Chilean Peso (CLP): It saw immediate strength against the US dollar, suggesting that investors see Kast's victory as a potential economic boost and greater macroeconomic stability.
Yahoo Finance
Latin American Emerging Market Currencies: Positive contagion effect on currencies such as the MXN and BRL, given the pro-market and legal certainty-oriented tone among investors.
Commodity-linked FX: Chile is a major exporter of copper and lithium; its more favorable policy for private investment could support commodity prices and, indirectly, the currencies of producing countries.
Investors perceive Kast's victory as a signal of potential economic reformism and a stronger alliance with the United States and Western markets, reducing perceived political risk in the region and supporting capital flows into Chilean and regional assets.
Global risk themes and market cross-reactions
Beyond specific events:
Geopolitical tensions persist in other regions (Middle East, Ukraine/Russia), which continue to influence currency prices with risk-aversion movements.
Macroeconomic data from the US and Europe this week will be crucial for confirming the recent strengthening of the USD and influencing interest rate expectations.
Short-term technical drivers:
A slightly higher Volatility Indicator (VIX) reflects increased uncertainty.
Flows into safe-haven currencies (USD/JPY, USD/CHF) show intraday breakouts during times of geopolitical stress.
Correlation between copper prices and emerging market currencies reinforces the positive carry trade narrative on MXN and CLP.

Dow Jones Faces Potential Downside Correction“The Dow Jones may start a bearish correction from the current price range toward 47,423. The level at 48,916.77 is critical.” CMCMARKETS:US30

How I frame my Bias on Stocks? Part 1. Showing multiple examples of stock delivery and how you can do the same on a 5min timeframe

BlackRock (BLK) – Wave 3 in Motion📢 BlackRock (BLK) – Wave 3 in Motion | Institutional Strength + Fibonacci 3.618 Target Ahead 💥
📅 Timeframe : Monthly (Long-term Outlook)
📍 Current Price: $1,130
🎯 Wave 3 Target: ~$3,710 (3.618 Fibonacci Extension)
🧭 Structure: Wave 3 of a larger 5-wave cycle in progress
🌀 Wave Theory Confluence
BlackRock is currently unfolding a strong impulsive structure as part of a long-term Elliott Wave cycle:
Wave 1: The early-stage rally from 2000 to 2007
Wave 2: A textbook 0.382 Fibonacci retracement during the 2008 financial crisis
Wave 3: The current wave, extended and projected to reach 3.618x the Wave 1 length (~$3,710) — a typical signature of a strong institutional-driven Wave 3 impulse ⚡
Wave 4 & 5: Projected after this major expansion, with intermediate corrections expected
This fractal symmetry suggests BLK is nowhere near a cycle top yet , with significant upside potential over the next several years 📈
📐 Fibonacci Levels & Projections
🔹 Wave 2 respected the 0.382 retracement , a classic spot for shallow corrections during strong trends
🔹 Wave 3 Extension Target sits at 3.618 — ~$3,710 — backed by both Fibonacci math and historical wave behavior
🔹 Mid-channel resistance may create short-term corrections before final push to the target
🧠 Smart Money Concepts (SMC)
✅ Reaccumulation Phases: Price consolidations in 2015–2016 and 2022–2023 reflect institutional reloading zones, not distribution
✅ BOS (Break of Structure): Recent break above 2021 ATH confirms new markup phase 🔥
✅ No major supply zones above, indicating price could expand freely until price discovery finds new resistance closer to the projected 3.618 extension
📊 Price Action Analysis
Clean higher highs and higher lows on the monthly chart
Large-bodied bullish candles show strong trend momentum
Minor corrections respecting prior resistance-turned-support zones = confirmation of demand ✅
Breakout from compression range suggests volatility expansion and strong directional bias
💼 Fundamental Tailwinds
BlackRock remains the world’s largest asset manager , positioned at the heart of global capital flows:
AUM over $9T 📦
Massive institutional & ETF exposure (iShares)
Strong penetration into passive investing & ESG funds
Beneficiary of rate cut cycles and equity bull markets
Strategic leadership in tokenized assets, AI-enhanced portfolio management , and climate investing
These macro and innovation-driven tailwinds align with the explosive potential of Wave 3 , fueled by both capital inflows and earnings expansion 🧮
🎯 Summary
BlackRock is in a textbook macro Wave 3 expansion , with all signs aligning:
✅ Elliott Wave Impulse
✅ Fibonacci Extension to 3.618
✅ Institutional Accumulation Confirmed
✅ Price Action Breakout
✅ Rock-solid Fundamentals
A correction (Wave 4) may develop later around or after $3,700 — but for now, the path of least resistance remains up . Long-term investors and swing traders should monitor retracements for potential add-on positions before price enters Wave 5 later in the decade.
⚠️ Disclaimer: This analysis is for educational purposes only and is not financial advice. Always do your own research and manage risk accordingly. 🛡️
#BlackRock #BLK #ElliottWave #SmartMoney #Fibonacci #TechnicalAnalysis #PriceAction #WaveTheory #InstitutionalTrading #SwingTrade #LongTerm #StockMarket #AssetManagement #Breakout #Wave3 #BullishOutlook #Fundamentals #TradingStrategy #MacroView

#AN029: USA, Shutdown Ended, Trump Signs the Deal.
After 43 days of total federal government shutdown, the longest shutdown in US history, the government is officially back in business. Hello, I'm Forex Trader Andrea Russo, an independent trader and prop trader, as well as the author of "The Institutional Code of Forex, 14 Steps to Read the Markets Like a Bank," with over $200,000 in capital under management. Thank you in advance for your time.
Donald Trump signed the funding bill approved by Congress, restoring temporary funding for federal agencies and guaranteeing back pay for federal employees.
But the market knows: this isn't a solution, it's a truce.
🔍 What was actually approved?
The package signed by Trump is a continuing resolution that funds the government only until the end of January.
No solution to the central issue—the Affordable Care Act subsidies—just the promise of a future vote.
In other words: the shutdown is over, but the uncertainty is not.
📉 Short-term economic impact
Initial estimates suggest a cost of between $10 and $15 billion in lost productivity, lower consumption, and frozen contracts.
In the short term, we will see:
- Technical rebound in consumption: wages, arrears, and federal contracts are resuming.
- Resumption of public services: TSA, USDA, CDC, and NIH are fully operational again.
- Distorted macro data: Many economic releases have been postponed and will now be released in a concentrated form, making it difficult to accurately assess real economic momentum.
The risk?
Another shutdown in a few weeks, if Congress doesn't find a real compromise.

DVAX Director Scott Myers scooped up 3,800 shares at $10.82NASDAQ:DVAX #DVAX — Dynavax Technologies Corp | Healthcare | Drug Manufacturers - Specialty & Generic | USA | NASD | August 25, 2025.
Recent insider activity at Dynavax Technologies Corporation (DVAX) highlights a notable purchase by Scott Dunseeth Myers, a Director on the board. On August 22, 2025, Myers acquired 3,800 shares at an average price of $10.82 per share, amounting to a total investment of $41,116.
This transaction, disclosed via SEC Form 4 on August 25, 2025, at 08:50 AM EDT, increases his total holdings to 35,004 shares, reflecting insider confidence amid the stock's recent pullback.
SEC From 4:
www.sec.gov
Chart:
• (1D)
• (1W)
Examining the daily chart for DVAX, the stock is entrenched in a downtrend, trading below key moving averages (e.g., SMA 20 at ~$10.79, SMA 50 at ~$10.60, and SMA 200 at ~$11.82), with price action showing increased volatility and a recent drop to around $10.28-$10.53.
This setup introduces notable risks, including potential further downside if broader market sentiment in the healthcare sector weakens or if earnings catalysts fail to materialize.
However, the insider buy at these levels suggests a possible bottoming formation, and I estimate a modest upside potential of 5-10% in the near term, targeting resistance near $11-$11.50, contingent on positive volume confirmation and macroeconomic stability.

#AN027: US Shutdown Agreement, Effects on the Dollar and Forex
The historic political impasse in the United States – with the 2025 United States federal government shutdown – appears to be nearing a resolution. Hello, I'm Forex Trader Andrea Russo, an independent trader and prop trader with $200,000 in capital under management. Thank you in advance for your time.
A Senate agreement provides for the reopening of the federal government through a continuing resolution, with the reinstatement of public employees' arrears.
In the FX context, this event has immediate and medium-term implications for the US dollar (USD) and major global currencies. In this article, we analyze the dynamics and provide a guide for those trading on TradingView.
What Happened
The Senate obtained an initial procedural yes to the resolution to reopen the government.
Markets are showing initial relief: the US dollar has halted its recent bullish momentum, pending operational confirmation.
The government shutdown had already caused delays in economic data and a climate of political uncertainty that is hindering the Federal Reserve's clear definition of monetary strategies.
Impact on Forex: Key Factors
1. Political Risk Effect and Sentiment
With the prospect of an end to the shutdown, the risk premium associated with the US government and fiscal governance is decreasing. This tends to favor the dollar in the short term, especially against safe-haven currencies. However, sentiment remains cautious, given the residual uncertainty.
2. Delayed Macroeconomic Data and Volatility
The lack or delay in the release of economic data (e.g., employment, inflation) complicates forecasting the Fed's moves and reduces traders' ability to confidently position themselves on the USD.
3. Yields and Carry Trades
If the agreement fuels an improvement in the US economic profile, US bond yields could rise, attracting flows into the dollar. On the other hand, if the economy shows signs of post-shutdown weakness, the effect could reverse.
4. Technical scenarios in major FX pairs
EUR/USD: Possible dollar rebound → downward pressure on EUR/USD. However, if US data deteriorates, a strong USD-weak trend could be triggered.
USD/JPY: The dollar could benefit from rising yields + carry trades; but a safe-haven turn on the yen if global risks emerge.
GBP/USD / AUD/USD: Commodity or risk-linked currencies could benefit from risk-on, but a strong dollar will limit rebounds.

XAU/USD – Selling Opportunity Near Resistance ZoneGold is currently approaching a strong resistance level after an extended bullish move.

#AN026: Trump, the US as a Bitcoin Superpower
In a recent speech in Miami, Donald Trump declared a radical shift in his vision for cryptocurrencies, with a strong and clear message: the United States must become the "Bitcoin Superpower" and the cryptocurrency capital of the world. Hello, I'm Andrea Russo, an independent forex trader and prop trader with $200,000 in capital under management, and I thank you in advance for your time.
This statement comes after years of political uncertainty and critical federal regulations targeting the crypto sector. Now, under Trump's leadership, the narrative seems set to change, with an embrace of the potential of Bitcoin and other cryptocurrencies.
In his speech, Trump made a bold statement: "Crypto was under siege, but with my administration, things change." The former president emphasized that global competition, particularly from China, could threaten the United States' dominant position in the cryptocurrency world. In response, he proposed a vision in which the United States not only regains control but also establishes itself as a global leader in Bitcoin.
Trump suggested that a robust crypto infrastructure could be key to maintaining the dollar's supremacy, now considered the most important global medium of exchange. "If we don't act, China will take over," he warned, referring to the Asian nation's growing influence in the blockchain and cryptocurrency sectors.
Trump's words could mark a turning point in the relationship between government and cryptocurrencies. If these statements translate into favorable policies, the United States could further strengthen its position in the crypto industry, incentivizing the adoption of blockchain-based technologies and creating a clearer regulatory environment for cryptocurrencies.
However, as with any policy statement, uncertainty remains. Trump has not provided concrete details on how he intends to achieve these goals or what type of legislation might be introduced. For investors, this means that market expectations may fluctuate, while concrete developments may be slow in coming.
Trump's vision of America as a crypto superpower could represent a new phase in the evolution of cryptocurrencies, particularly for Bitcoin, which is often at the center of global debates. However, the path to realizing this vision is unclear and could depend on various economic and political factors. Investors and traders should remain vigilant, monitoring future policy moves, which could significantly impact cryptocurrency volatility and adoption in the United States.
In conclusion, while Trump's sentiment may be positive for the crypto market in the short term, the real challenge will be the ability to translate words into concrete actions, creating an environment that fosters innovation and expansion in the crypto sector.

DXY Has 99 Problems, Getting Above 100 Is One!Here we have TVC:DXY on the Weekly Chart.
Now clearly outlined we can see there is a very valuable level here @ 99-100 that the USD:
- Used as Resistance from 2015 til the Bullish Breakout in April 2020
- Used as Support from 2023 til the Bearish Breakdown in April 2025
Fundamentally is a very sketchy scenario because with the Shutdown causing lack of important data needed, The Federal Reserve is making Interest Rate cuts. This weakens the Dollar because it makes it less favorable to Foreign Investing.
On the flip side, Consumers Dollars are able to stretch further allowing them to purchase more but unfortunately we still combat the inflated prices on goods. Companies have the ability to get there raw ingredients cheaper, resume hiring processes, etc.
The slow creeping rise in Inflation has the Federal Reserve in a position to want to be ready to potentially Hike Rates when the Inflation, they believe, from the Tariffs will hit but as of yet, the recent CPI numbers came out not as hot as they thought, possibly playing into the reason for making the latest cut.
Nevertheless, by the last FOMC meeting, it would seem that there is a chance that was the last cut this year that may be made, if:
- Inflation continues to rise
or
- Continued softening labor market

China Stocks — The Calm Before a New U.S.–China Trade Reset?The upcoming Trump–Xi meeting could mark a major turning point for Asian markets. While headlines focus on tariffs and semiconductors, the real leverage point lies in rare-earth metals — materials where China still dominates global supply and processing. Any sign of easing U.S. restrictions or a framework for new technology cooperation could quickly reprice Chinese industrial and resource names that have been heavily discounted since 2022.
The Hang Seng Index has quietly rebounded from its spring lows and is now testing the lower line of its rising channel. A sustained break above this zone could trigger a technical rotation back into Chinese equities — especially those tied to critical materials, power technology, and domestic AI infrastructure.
After years of capital flight and valuation compression, many Chinese mid-caps trade at fractions of Western peers despite solid earnings recovery. If the political narrative shifts from confrontation to cautious cooperation, the asymmetric upside could be significant. The market still doubts it — which is exactly what gives the move potential energy.
In short: rare-earth leverage + trade détente + ultra-low valuations = potential spark for a new China rally. Watch for follow-through after the Trump–Xi meeting and confirmation on the Hang Seng channel breakout. Comment Below if you have any Chineese stocks that you like, here are mine :)
NYSE:BABA NASDAQ:BIDU NASDAQ:JD NASDAQ:XNET NASDAQ:PDD

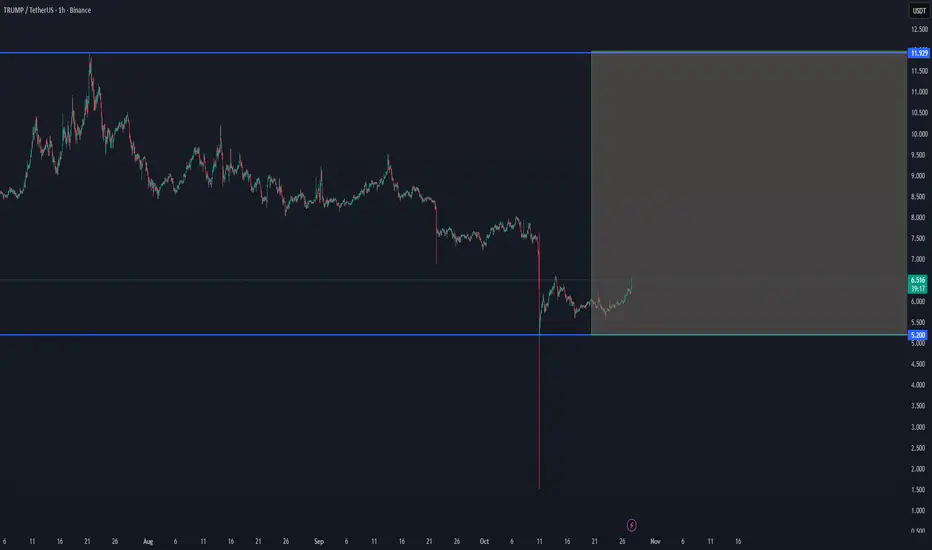
TRUMP/USDT — Reversal Signs After Deep CorrectionTRUMP/USDT — Reversal Signs After Deep Correction ⚡
After a heavy decline, TRUMP is showing early recovery signs from the $5.20 support zone.
If momentum continues, a push toward the $11.90 resistance range could form a short-term bounce setup.
📊 Support: $5.20
📈 Upside Target Zone: $11.90
How China Is Quietly Taking Over Europe’s Industrial FutureThe Lack of Rare Earth Elements Pushes Europe into Major Concessions to China.
Europe’s growing shortage of rare earth elements is forcing it to make unprecedented concessions to China — so deep that analysts now warn the continent could see the collapse of entire industrial sectors within the next five to six years.
Automotive, shipbuilding, aviation, and railway manufacturing are all at risk. To stay afloat, European manufacturers — especially in Germany — are reportedly transferring valuable production know-how and proprietary technologies to Chinese partners in a desperate attempt to survive just a few more months or years.
China, meanwhile, is using this knowledge to strengthen its own technological base. The scenario is alarmingly familiar: just as China mastered and surpassed the West in electric vehicles, it is now poised to outpace Europe across nearly every remaining industrial field.
Investing in major German corporations is rapidly becoming meaningless. These companies will either shut down or be bought out entirely. The battle for industrial dominance has already been decided — China has won against Europe. What remains is the larger confrontation with the United States, a conflict that will likely unfold on Europe’s back, among the ruins of its once world-leading industries.

Bitcoin Daily Analysis – October 22, 2025🟠Bitcoin remains in a phase of uncertainty, with market sentiment heavily influenced by global macro events. Developments around interest rate decisions, U.S.–China tariff policies, and ongoing geopolitical tensions in the Middle East could all play a decisive role in shaping Bitcoin’s next move.
🕰️ In this phase, patience is the key to success — avoid rushing into large positions until we see clearer confirmation of trend direction and market risk appetite.
🎯 Until the broader trend becomes more defined, traders can take advantage of short-term long and short triggers on lower timeframes, while maintaining strict risk management and discipline.
Disclaimer:
This content is for informational purposes only and does not constitute financial or investment advice. © DIBAPRISM
Larry D.Kohn

TRUMP TWEET: High Tariffs on china will NOT remain.I expect a deal with Xi to be announced at the APEC meeting
#ES
#STOCKS
#SPX