USDCAD H4 | Potential Bullish Bounce Off SupportBased on the H4 chart analysis, we can see that the price has bounced off the buy entry, which is a pullback support that lines up with the 50% Fibonacci retracemnt and could rise from this level to the take profit.
Buy entry is at 1.3910, whichis a pullback support that lines up with the 50% Fibonacci retracement.
Stop loss is at 1.3881, whichis a pullback support.
Take profit is at 1.3982, which s a pullback resistance that lines up with the 50% Fibonacci retracemnt.
Stratos Markets Limited (tradu.com ):
CFDs are complex instruments and come with a high risk of losing money rapidly due to leverage. 68% of retail investor accounts lose money when trading CFDs with this provider. You should consider whether you understand how CFDs work and whether you can afford to take the high risk of losing your money.
Stratos Europe Ltd (tradu.com ):
CFDs are complex instruments and come with a high risk of losing money rapidly due to leverage. 70% of retail investor accounts lose money when trading CFDs with this provider. You should consider whether you understand how CFDs work and whether you can afford to take the high risk of losing your money.
Usd-cad
Potential bullish reversal?The Loonie (USD/CAD) has bounced off the pivot and could rise to the 1st resistance.
Pivot: 1.3913
1st Support: 1.3864
1st Resistance: 1.3981
Disclaimer:
The above opinions given constitute general market commentary, and do not constitute the opinion or advice of IC Markets or any form of personal or investment advice.
Any opinions, news, research, analyses, prices, other information, or links to third-party sites contained on this website are provided on an "as-is" basis, are intended only to be informative, is not an advice nor a recommendation, nor research, or a record of our trading prices, or an offer of, or solicitation for a transaction in any financial instrument and thus should not be treated as such. The information provided does not involve any specific investment objectives, financial situation and needs of any specific person who may receive it. Please be aware, that past performance is not a reliable indicator of future performance and/or results. Past Performance or Forward-looking scenarios based upon the reasonable beliefs of the third-party provider are not a guarantee of future performance. Actual results may differ materially from those anticipated in forward-looking or past performance statements. IC Markets makes no representation or warranty and assumes no liability as to the accuracy or completeness of the information provided, nor any loss arising from any investment based on a recommendation, forecast or any information supplied by any third-party.

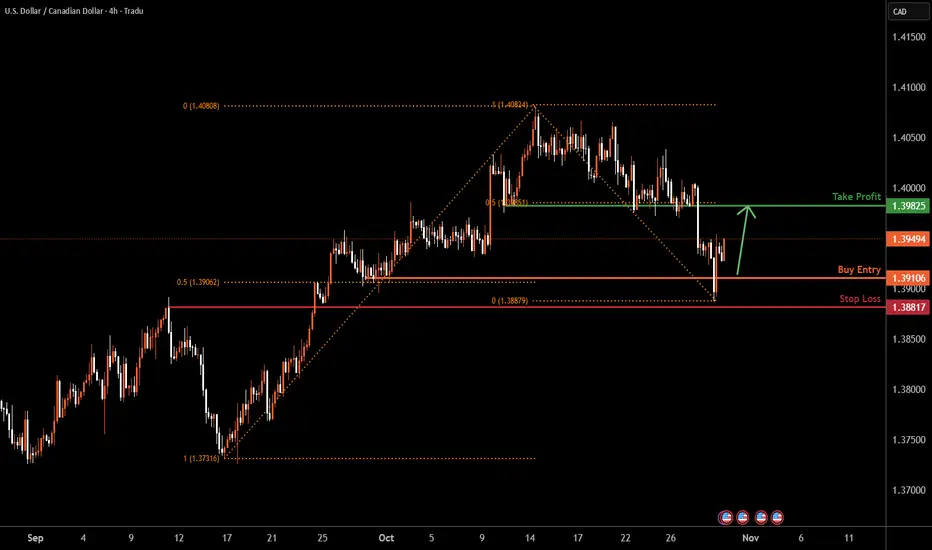
USDCAD H4 | Bullish Bounce off Pullback SupportLoonie (USD/CAD) is falling towards the buy entry which is a pullback support that aligns with the 50% Fibonacci retracement and could bounce from this level to the take profit.
Buy entry is at 1.3910, which is a pullback support that aligns with th 50% Fibonacci retracemnt.
Stop loss is at 1.3881, which is an overlap support.
Take profit is at 1.3968, whichis an overlap resistance.
Stratos Markets Limited (tradu.com ):
CFDs are complex instruments and come with a high risk of losing money rapidly due to leverage. 68% of retail investor accounts lose money when trading CFDs with this provider. You should consider whether you understand how CFDs work and whether you can afford to take the high risk of losing your money.
Stratos Europe Ltd (tradu.com ):
CFDs are complex instruments and come with a high risk of losing money rapidly due to leverage. 70% of retail investor accounts lose money when trading CFDs with this provider. You should consider whether you understand how CFDs work and whether you can afford to take the high risk of losing your money.

Falling towards 50% Fibonacci support?USD/CAD is falling towards the support level which is a pullback support that aligns with the 50% Fibonacci retracement and could bounce from this level to our take profit.
Entry: 1.3910
Why we like it:
There is a pullback support level that aligns with the 50% Fibonacci retracement.
Stop loss: 1.3861
Why we like it:
There is a pullback support that is slightly below the 50% Fibonacci retracement.
Take profit: 1.3982
Why we like it:
There is a pullback resistance level.
Enjoying your TradingView experience? Review us!
Please be advised that the information presented on TradingView is provided to Vantage (‘Vantage Global Limited’, ‘we’) by a third-party provider (‘Everest Fortune Group’). Please be reminded that you are solely responsible for the trading decisions on your account. There is a very high degree of risk involved in trading. Any information and/or content is intended entirely for research, educational and informational purposes only and does not constitute investment or consultation advice or investment strategy. The information is not tailored to the investment needs of any specific person and therefore does not involve a consideration of any of the investment objectives, financial situation or needs of any viewer that may receive it. Kindly also note that past performance is not a reliable indicator of future results. Actual results may differ materially from those anticipated in forward-looking or past performance statements. We assume no liability as to the accuracy or completeness of any of the information and/or content provided herein and the Company cannot be held responsible for any omission, mistake nor for any loss or damage including without limitation to any loss of profit which may arise from reliance on any information supplied by Everest Fortune Group.

USDCAD Faces Pressure as DXY Correction Nears Key Resistance!!Hey Traders, in today’s trading session we are monitoring USDCAD for a potential selling opportunity around the 1.40200 zone.
The pair remains in a broader downtrend and is currently in a correction phase, approaching the trendline and resistance area at 1.40200.
From a macro perspective, the US Dollar Index (DXY) is testing its 98.900 channel resistance, where upside momentum may fade amid a weakening U.S. labour market and rising expectations for a dovish shift from the Fed.
A potential DXY rejection from that level could amplify downside pressure on USDCAD, especially if oil continues to find demand and supports the Canadian Dollar.
Next move: Watching for bearish confirmation near 1.40200 for potential continuation of the broader downtrend.
💬 What’s your view on USDCAD and the Dollar outlook this week? Share your thoughts below!

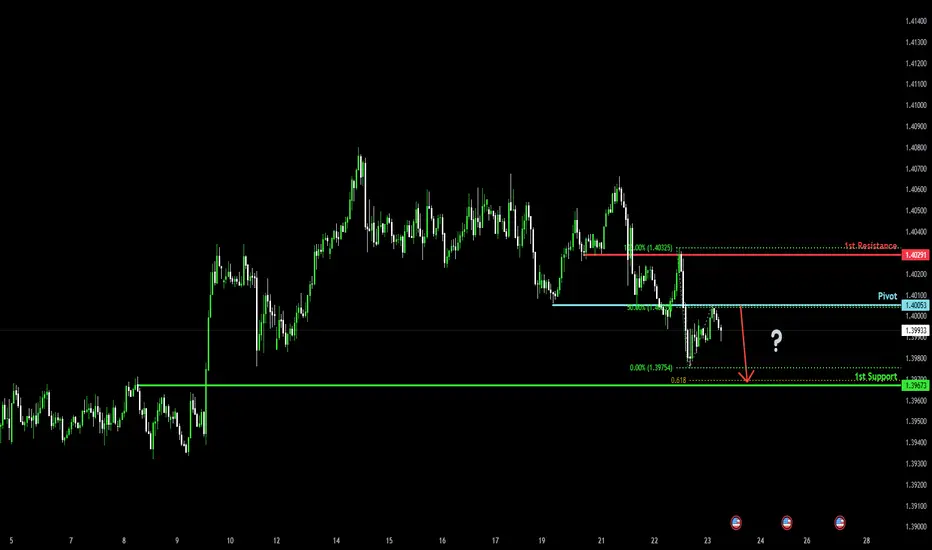
Bearish drop off?The Loonie (USD/CAD) is rising towards the pivot and could reverse to the 1st support.
Pivot: 1.4012
1st Support: 1.3969
1st Resistance: 1.4073
Disclaimer:
The above opinions given constitute general market commentary, and do not constitute the opinion or advice of IC Markets or any form of personal or investment advice.
Any opinions, news, research, analyses, prices, other information, or links to third-party sites contained on this website are provided on an "as-is" basis, are intended only to be informative, is not an advice nor a recommendation, nor research, or a record of our trading prices, or an offer of, or solicitation for a transaction in any financial instrument and thus should not be treated as such. The information provided does not involve any specific investment objectives, financial situation and needs of any specific person who may receive it. Please be aware, that past performance is not a reliable indicator of future performance and/or results. Past Performance or Forward-looking scenarios based upon the reasonable beliefs of the third-party provider are not a guarantee of future performance. Actual results may differ materially from those anticipated in forward-looking or past performance statements. IC Markets makes no representation or warranty and assumes no liability as to the accuracy or completeness of the information provided, nor any loss arising from any investment based on a recommendation, forecast or any information supplied by any third-party.

USDCAD | Bearish Reversal Forming at Overlap ResistanceBased on the M30, we can see that the price is reacting off the sell entry whic is an overlap resistance and could drop from this level to the downside.
Sell entry is at 1.4004, which is an overlap resistance.
Stop loss is at 1.4019, which is a pullback resistance that aligns with the 61.8% Fibonacci retracement.
Take profit is at 1.3978, which is a multi swing low support.
Stratos Markets Limited (tradu.com ):
CFDs are complex instruments and come with a high risk of losing money rapidly due to leverage. 68% of retail investor accounts lose money when trading CFDs with this provider. You should consider whether you understand how CFDs work and whether you can afford to take the high risk of losing your money.
Stratos Europe Ltd (tradu.com ):
CFDs are complex instruments and come with a high risk of losing money rapidly due to leverage. 70% of retail investor accounts lose money when trading CFDs with this provider. You should consider whether you understand how CFDs work and whether you can afford to take the high risk of losing your money.

Bullish momentum expected?The Loonie (USD/CAD) is falling towards the pivot, which is a pullback support and could bounce to the 61.8% Fibonacci resistance.
Pivot: 1.3913
1st Support: 1.3753
1st Resistance: 1.4152
Disclaimer:
The above opinions given constitute general market commentary, and do not constitute the opinion or advice of IC Markets or any form of personal or investment advice.
Any opinions, news, research, analyses, prices, other information, or links to third-party sites contained on this website are provided on an "as-is" basis, are intended only to be informative, is not an advice nor a recommendation, nor research, or a record of our trading prices, or an offer of, or solicitation for a transaction in any financial instrument and thus should not be treated as such. The information provided does not involve any specific investment objectives, financial situation and needs of any specific person who may receive it. Please be aware, that past performance is not a reliable indicator of future performance and/or results. Past Performance or Forward-looking scenarios based upon the reasonable beliefs of the third-party provider are not a guarantee of future performance. Actual results may differ materially from those anticipated in forward-looking or past performance statements. IC Markets makes no representation or warranty and assumes no liability as to the accuracy or completeness of the information provided, nor any loss arising from any investment based on a recommendation, forecast or any information supplied by any third-party.

Bearish drop off for the Loonie?The price has reacted off the resistance level, which is a pullback resistance and could potentially drop from this level to our take profit.
Entry: 1.4003
Why we like it:
There is a pullback resistance level.
Stop loss: 1.4027
Why we like it:
There is a swing high resistance level.
Take profit: 1.3969
Why we like it:
There is a pullback support level.1
Enjoying your TradingView experience? Review us!
Please be advised that the information presented on TradingView is provided to Vantage (‘Vantage Global Limited’, ‘we’) by a third-party provider (‘Everest Fortune Group’). Please be reminded that you are solely responsible for the trading decisions on your account. There is a very high degree of risk involved in trading. Any information and/or content is intended entirely for research, educational and informational purposes only and does not constitute investment or consultation advice or investment strategy. The information is not tailored to the investment needs of any specific person and therefore does not involve a consideration of any of the investment objectives, financial situation or needs of any viewer that may receive it. Kindly also note that past performance is not a reliable indicator of future results. Actual results may differ materially from those anticipated in forward-looking or past performance statements. We assume no liability as to the accuracy or completeness of any of the information and/or content provided herein and the Company cannot be held responsible for any omission, mistake nor for any loss or damage including without limitation to any loss of profit which may arise from reliance on any information supplied by Everest Fortune Group.

#036: USD/CAD Long Investment Opportunity
In recent days, the USD/CAD cross has shown a consolidation phase within a medium-term structure characterized by progressively higher lows and a gradual absorption of supply in the lower part of the range. Hello, I'm Forex Trader Andrea Russo, an independent trader and prop trader with $200,000 in capital under management. Thank you in advance for your time.
Observing the price behavior in the last 8-hour candles, we see how buyers have resolutely defended the support zone, repelling any attempts to decline with increasing volume and clear wicks below key levels.
This type of price action, typical of accumulation environments, suggests that strong hands are gradually building long positions in anticipation of a new bullish leg.
On a technical level, the break of intermediate micro-resistance, accompanied by growing momentum on the US dollar and a weakening Canadian dollar, increases the likelihood of an extension into higher liquidity areas.
This movement would be consistent with the rebalancing dynamic of order flow, which in recent sessions has shown a marked reduction in short-term pressure.
At the intermarket level, the weakening energy market continues to be a drag on the Canadian currency, historically correlated with oil prices.
At the same time, the stability of US yields and still-tight interest rate expectations keep the greenback in a position of relative strength.
In summary, the overall picture shows a favorable environment for a continuation of the bullish movement, provided the price maintains its current support structure and confirms solid closes above minor resistance levels.

USDCAD H1 | Bearish Reversal in PlayLoonie (USD/CAD) has rejected off the sell entry which is a pullback resistance that aligns with he 50% Fibonacci retracement and could drop from this level to the downside.
sell entry is at 1.4020, which is a pullback resistance that lines up with the 50% Fibonacci retracement.
Stop loss is at 1.4043, which is a pullback resistance that lines up with he 78.6% Fibonacci retracement.
Take profit is at 1.3975, whic is a multi swing low support.
Stratos Markets Limited (tradu.com ):
CFDs are complex instruments and come with a high risk of losing money rapidly due to leverage. 68% of retail investor accounts lose money when trading CFDs with this provider. You should consider whether you understand how CFDs work and whether you can afford to take the high risk of losing your money.
Stratos Europe Ltd (tradu.com ):
CFDs are complex instruments and come with a high risk of losing money rapidly due to leverage. 70% of retail investor accounts lose money when trading CFDs with this provider. You should consider whether you understand how CFDs work and whether you can afford to take the high risk of losing your money.

Heading into major resistance?USD/CAD is rising towards the resistance level which is an overlap resistance that aligns with the 50% Fibonacci retracement and could reverse from this level to our take profit.
Entry: 1.4024
Why we like it:
There is an overlap resistance that aligns with the 50% Fibonacci retracement.
Stop loss: 1.4061
Why we like it:
There is a swing high resistance level.
Take profit: 1.3969
Why we like it:
There is a pullback support level.
Enjoying your TradingView experience? Review us!
Please be advised that the information presented on TradingView is provided to Vantage (‘Vantage Global Limited’, ‘we’) by a third-party provider (‘Everest Fortune Group’). Please be reminded that you are solely responsible for the trading decisions on your account. There is a very high degree of risk involved in trading. Any information and/or content is intended entirely for research, educational and informational purposes only and does not constitute investment or consultation advice or investment strategy. The information is not tailored to the investment needs of any specific person and therefore does not involve a consideration of any of the investment objectives, financial situation or needs of any viewer that may receive it. Kindly also note that past performance is not a reliable indicator of future results. Actual results may differ materially from those anticipated in forward-looking or past performance statements. We assume no liability as to the accuracy or completeness of any of the information and/or content provided herein and the Company cannot be held responsible for any omission, mistake nor for any loss or damage including without limitation to any loss of profit which may arise from reliance on any information supplied by Everest Fortune Group.

Bearish reversal off 50% Fibonacci resistance?The Loonie (USD/CAD) has rejected off the pivot, which acts as a pullback resistance that aligns with the 50% Fibonacci retracement and could drop to the 1st support.
Pivot: 1.4005
1st Support: 1.3967
1st Resistance: 1.4029
Disclaimer:
The above opinions given constitute general market commentary, and do not constitute the opinion or advice of IC Markets or any form of personal or investment advice.
Any opinions, news, research, analyses, prices, other information, or links to third-party sites contained on this website are provided on an "as-is" basis, are intended only to be informative, is not an advice nor a recommendation, nor research, or a record of our trading prices, or an offer of, or solicitation for a transaction in any financial instrument and thus should not be treated as such. The information provided does not involve any specific investment objectives, financial situation and needs of any specific person who may receive it. Please be aware, that past performance is not a reliable indicator of future performance and/or results. Past Performance or Forward-looking scenarios based upon the reasonable beliefs of the third-party provider are not a guarantee of future performance. Actual results may differ materially from those anticipated in forward-looking or past performance statements. IC Markets makes no representation or warranty and assumes no liability as to the accuracy or completeness of the information provided, nor any loss arising from any investment based on a recommendation, forecast or any information supplied by any third-party.
USDCAD H1 | Bullish Bounce Off SupportBased on the H1 chart analysis, we can see that the price has bounced off the buy entry which is a pullback support and could rise from this level to the upside.
Buy entry is at 1.3998, whichis a pullback support.
Stop loss is at 1.3983, whichis a pullback support that aligns with the 138.2% Fibonacci extension.
Take profit is at 1.4028, whichis a pullback resistance that aligns with the 50% Fibonacci retracement.
Stratos Markets Limited (tradu.com ):
CFDs are complex instruments and come with a high risk of losing money rapidly due to leverage. 68% of retail investor accounts lose money when trading CFDs with this provider. You should consider whether you understand how CFDs work and whether you can afford to take the high risk of losing your money.
Stratos Europe Ltd (tradu.com ):
CFDs are complex instruments and come with a high risk of losing money rapidly due to leverage. 70% of retail investor accounts lose money when trading CFDs with this provider. You should consider whether you understand how CFDs work and whether you can afford to take the high risk of losing your money.

Heading into swing high resistance?The Loonie (USD/CAD) is rising towards the pivot which has been identified as a swing high resistance and could reverse to the 1st support.
Pivot: 1.4076
1st Support: 1.4033
1st Resistance: 1.4096
Disclaimer:
The above opinions given constitute general market commentary, and do not constitute the opinion or advice of IC Markets or any form of personal or investment advice.
Any opinions, news, research, analyses, prices, other information, or links to third-party sites contained on this website are provided on an "as-is" basis, are intended only to be informative, is not an advice nor a recommendation, nor research, or a record of our trading prices, or an offer of, or solicitation for a transaction in any financial instrument and thus should not be treated as such. The information provided does not involve any specific investment objectives, financial situation and needs of any specific person who may receive it. Please be aware, that past performance is not a reliable indicator of future performance and/or results. Past Performance or Forward-looking scenarios based upon the reasonable beliefs of the third-party provider are not a guarantee of future performance. Actual results may differ materially from those anticipated in forward-looking or past performance statements. IC Markets makes no representation or warranty and assumes no liability as to the accuracy or completeness of the information provided, nor any loss arising from any investment based on a recommendation, forecast or any information supplied by any third-party.

1.40 Appears Pivotal For USD/CADUSD/CAD remains in an established uptrend on the daily chart, although momentum showed signs of turning lower on Friday. Still, the 1.40 handle and monthly R1 pivot sit close by as a key support zone, making this area pivotal for both bulls and bears in the near term.
If the support zone holds, the bias favours a move toward 1.41, near the monthly R2 pivot. However, a break below 1.40 would shift focus to the high-volume node (HVN) at 1.3948, where bears may look to extend downside pressure. Given the prevailing uptrend, bulls may continue to watch for evidence of a swing low before re-entering.
Matt Simpson, Market Analyst at City Index and Forex.com

Bullish momentum to extend?The Loonie (USD/CAD is falling towards the pivot which has been identifed as a pullback support and could bounce to the 61.8% Fibonacci resistance.
Pivot: 1.3908
1st Support: 1.3742
1st Resistance: 1.4166
Disclaimer:
The above opinions given constitute general market commentary, and do not constitute the opinion or advice of IC Markets or any form of personal or investment advice.
Any opinions, news, research, analyses, prices, other information, or links to third-party sites contained on this website are provided on an "as-is" basis, are intended only to be informative, is not an advice nor a recommendation, nor research, or a record of our trading prices, or an offer of, or solicitation for a transaction in any financial instrument and thus should not be treated as such. The information provided does not involve any specific investment objectives, financial situation and needs of any specific person who may receive it. Please be aware, that past performance is not a reliable indicator of future performance and/or results. Past Performance or Forward-looking scenarios based upon the reasonable beliefs of the third-party provider are not a guarantee of future performance. Actual results may differ materially from those anticipated in forward-looking or past performance statements. IC Markets makes no representation or warranty and assumes no liability as to the accuracy or completeness of the information provided, nor any loss arising from any investment based on a recommendation, forecast or any information supplied by any third-party.

USDCAD M30 | Bearish Drop In PlayUSD/CAD has rejected off the sell entry, which is a multi swing high resistance, and could drop from this level to the 61.8% Fibonacci support.
Sell entry is at 1.4056, which is a multi-swing high resistance.
Stop loss is at 1.4076, which is a swing high resistance.
Take profit is at 1.4016, which is a pullback support that lines up with the 61.8% Fibonacci retracement.
High Risk Investment Warning
Trading Forex/CFDs on margin carries a high level of risk and may not be suitable for all investors. Leverage can work against you.
Stratos Markets Limited (tradu.com ):
CFDs are complex instruments and come with a high risk of losing money rapidly due to leverage. 65% of retail investor accounts lose money when trading CFDs with this provider. You should consider whether you understand how CFDs work and whether you can afford to take the high risk of losing your money.
Stratos Europe Ltd (tradu.com ):
CFDs are complex instruments and come with a high risk of losing money rapidly due to leverage. 66% of retail investor accounts lose money when trading CFDs with this provider. You should consider whether you understand how CFDs work and whether you can afford to take the high risk of losing your money.
Stratos Global LLC (tradu.com ):
Losses can exceed deposits.
Please be advised that the information presented on TradingView is provided to Tradu (‘Company’, ‘we’) by a third-party provider (‘TFA Global Pte Ltd’). Please be reminded that you are solely responsible for the trading decisions on your account. There is a very high degree of risk involved in trading. Any information and/or content is intended entirely for research, educational and informational purposes only and does not constitute investment or consultation advice or investment strategy. The information is not tailored to the investment needs of any specific person and therefore does not involve a consideration of any of the investment objectives, financial situation or needs of any viewer that may receive it. Kindly also note that past performance is not a reliable indicator of future results. Actual results may differ materially from those anticipated in forward-looking or past performance statements. We assume no liability as to the accuracy or completeness of any of the information and/or content provided herein and the Company cannot be held responsible for any omission, mistake nor for any loss or damage including without limitation to any loss of profit which may arise from reliance on any information supplied by TFA Global Pte Ltd.
The speaker(s) is neither an employee, agent nor representative of Tradu and is therefore acting independently. The opinions given are their own, constitute general market commentary, and do not constitute the opinion or advice of Tradu or any form of personal or investment advice. Tradu neither endorses nor guarantees offerings of third-party speakers, nor is Tradu responsible for the content, veracity or opinions of third-party speakers, presenters or participants.

USD/CAD: Bearish Loonie SlideUSD/CAD: Bearish Loonie Slide Amid #Fed Cut Hype and #Forex Volatility Buzz? 1.39 Breakout Target in Sight?
USD/CAD is trading at 1.3795 today, up 0.17% amid a rebound from 1.3728 lows as markets eye the Fed's rate decision later, with 65% odds of a 50bps cut to 4.00-4.25% pressuring the dollar but offset by BoC's own easing signals.
This follows a 0.25% CAD gain earlier in the week on CPI data, but the pair remains range-bound with analysts forecasting a bearish tilt to 1.35 by year-end if Fed cuts deepen.
Just as #Fed surges with 15K mentions on X amid rate speculation, and #Forex trends spotlight policy divergence (e.g., BoC vs. Fed easing), USD/CAD's sensitivity to oil and CAD vulnerability position it for choppy action in the $1.8T daily forex market.
But with volatility at 3.88%, is USD/CAD undervalued for a bull run to 1.39, or will dovish Fed trigger a CAD rebound? Let's break down the fundamentals, SWOT, charts, and setups for September 18, 2025.
Fundamental Analysis
USD/CAD's trajectory hinges on diverging central bank paths, with the BoC's recent cuts weakening the loonie while Fed easing caps USD upside—yet oil prices above $70/bbl support CAD via Canada's export reliance.
Analysts project a 2025 average of 1.35, bearish on CAD amid #Fed cuts, but short-term resistance at 1.3800 could hold if US data softens. With #Forex volatility buzzing, the pair's undervaluation shines in a risk-on environment if Fed delivers 50bps, but sticky US inflation (2.6% core) risks a hawkish pivot.
- **Positive:**
- BoC easing and CAD vulnerability amid #Forex hype project USD strength to 1.3863 if Fed holds steady.
- Oil tailwinds and EM inflows (e.g., SA bonds) bolster CAD floors, undervaluing the pair at current levels vs. 1.40 peaks.
- Broader #Fed trends favor USD if dot plot signals fewer cuts, eyeing 0.5% monthly gains.
- **Negative:**
- Dovish Fed expectations weaken USD, clashing with #Fed optimism if 50bps cut confirms CAD rebound.
- Canada CPI resilience (2.0% YoY) could strengthen CAD if BoC pauses, pressuring the pair lower.
SWOT Analysis
**Strengths:** Policy divergence favors USD with Fed's relative hawkishness vs. BoC, amplified by #Fed relevance in dollar sentiment.
**Weaknesses:** High oil correlation exposes CAD upside; overbought momentum vulnerable in #Forex-shifting markets post-Fed.
**Opportunities:** Fed cut confirmation narrows spreads, with undervalued bull potential to 1.3891 amid #Fed boom.
**Threats:** Hawkish BoC surprises eroding gains; competition from AUD/CAD if commodity trends capitalize on #Forex volatility.
Technical Analysis
On the daily chart, USD/CAD rebounds in an ascending channel from 1.3728 support, with a pivot at 1.3800 mirroring #Fed volatility spikes. The weekly shows neutral bias with 1.3889 as key breakout. Current price: 1.3795, with VWAP at 1.3770 as intraday balance.
Key indicators:
- **RSI (14-day):** At 55, neutral—potential bull signal amid #Fed surge. 📈
- **MACD:** Histogram positive, crossover holding for upside.
- **Moving Averages:** Price above 21-day EMA (1.3750) but testing 50-day SMA (1.3820)—bullish if holds.
Support/Resistance: Support at 1.3728 (recent low), resistance at 1.3863 and 1.3891. Patterns/Momentum: Channel bounce targets 1.3863; fueled by #Forex momentum. 🟢 Bullish signals: Higher lows on volume. 🔴 Bearish risks: Failure at 1.3800 eyes 1.36.
Scenarios and Risk Management
- **Bullish Scenario:** Break above 1.3863 on hawkish Fed targets 1.3891; long on pullbacks to 1.3728, especially if #Fed signals fewer cuts.
- **Bearish Scenario:** Drop below 1.3728 eyes 1.3538; watch for CAD cross amid #Forex fade on dovish pivot.
- **Neutral/Goldilocks:** Range-bound 1.3728–1.3863 if dot plot mixed and #Fed cools.
Risk Tips: Use stops at 1.3700. Risk 1-2% per trade. Diversify to avoid correlation traps with #Fed-linked pairs like EUR/USD.
Conclusion/Outlook
Overall, a bullish bias if USD/CAD holds 1.3728, supercharged by today's #Fed and #Forex trends, with 0.7% upside to 1.39 on policy divergence. But watch the Fed outcome for confirmation—this fits September's rate volatility theme amid easing hype.
What’s your take? Bullish on USD/CAD amid #Fed cuts or fading the loonie? Share in the comments!

USD/CAD - Wedge Breakout (15.10.2025)📊 Setup Overview: OANDA:USDCAD
USD/CAD has completed a rising wedge formation and broken below the support trendline — a classic sign of bearish reversal pressure. The price is now rejecting from the resistance zone, supported by weakening momentum within the Ichimoku cloud. This setup indicates a potential move toward the next major support levels.
📈 Trade Plan:
Bias: Bearish
Sell Entry Zone: Near 1.4040 – 1.4060 (resistance retest area)
1st Target: 1.3992 ✅
2nd Target: 1.3954 🎯
Invalidation: Above 1.4075 resistance zone
🧩 Supporting Factors:
Clear wedge breakout below trendline
Resistance zone rejection after sharp upward push
Price trading below Ichimoku cloud, signaling bearish control
Volume and structure aligning for a potential downside continuation
#USDCAD #Forex #PriceAction #TechnicalAnalysis #TradingView #ChartPattern #WedgeBreakout #ForexSignals #BearishSetup #FXTrading #Ichimoku #ChartsDontLie
⚠️ Disclaimer:
This analysis is for educational purposes only and not financial advice. Always conduct your own analysis and use proper risk management before taking any trade.
💬 Support the Analysis:
If you found this helpful — Like 👍, Comment 💬, and Follow ✅ for more high-quality chart setups and pattern-based analyses!

USDCAD H1 | Bullish Bounce ConfirmedBased on the H1 chart analysis, we can see that the price has bounced off the buy entry, which serves as a pullback support that aligns with the 50% Fibonacci retracement. This level could potentially rise to the upside from here.
Buy entry is at 1.4032, whichis an overlap support that lines up with the 50% Fibonacci retracement.
Stop loss is at 1.4008, whichis a pullback support that aligns with the 50% Fibonacci retracement.
Take profit is at 1.4093, whichis a pullback resistance.
High Risk Investment Warning
Trading Forex/CFDs on margin carries a high level of risk and may not be suitable for all investors. Leverage can work against you.
Stratos Markets Limited (tradu.com ):
CFDs are complex instruments and come with a high risk of losing money rapidly due to leverage. 65% of retail investor accounts lose money when trading CFDs with this provider. You should consider whether you understand how CFDs work and whether you can afford to take the high risk of losing your money.
Stratos Europe Ltd (tradu.com ):
CFDs are complex instruments and come with a high risk of losing money rapidly due to leverage. 66% of retail investor accounts lose money when trading CFDs with this provider. You should consider whether you understand how CFDs work and whether you can afford to take the high risk of losing your money.
Stratos Global LLC (tradu.com ):
Losses can exceed deposits.
Please be advised that the information presented on TradingView is provided to Tradu (‘Company’, ‘we’) by a third-party provider (‘TFA Global Pte Ltd’). Please be reminded that you are solely responsible for the trading decisions on your account. There is a very high degree of risk involved in trading. Any information and/or content is intended entirely for research, educational and informational purposes only and does not constitute investment or consultation advice or investment strategy. The information is not tailored to the investment needs of any specific person and therefore does not involve a consideration of any of the investment objectives, financial situation or needs of any viewer that may receive it. Kindly also note that past performance is not a reliable indicator of future results. Actual results may differ materially from those anticipated in forward-looking or past performance statements. We assume no liability as to the accuracy or completeness of any of the information and/or content provided herein and the Company cannot be held responsible for any omission, mistake nor for any loss or damage including without limitation to any loss of profit which may arise from reliance on any information supplied by TFA Global Pte Ltd.
The speaker(s) is neither an employee, agent nor representative of Tradu and is therefore acting independently. The opinions given are their own, constitute general market commentary, and do not constitute the opinion or advice of Tradu or any form of personal or investment advice. Tradu neither endorses nor guarantees offerings of third-party speakers, nor is Tradu responsible for the content, veracity or opinions of third-party speakers, presenters or participants.

Bearish drop off?USD/CAD has rejected off the resistance level, which is a pullback resistance that aligns with the 50% Fibonacci retracement, and could drop from this level to our take profit.
Entry: 1.4054
Why we like it:
There is a pullback resistance level that aligns with the 50% Fibonacci retracement.
Stop loss: 1.4076
Why we like it:
There is a swing high resistance level.
Take profit: 1.4013
Why we like it:
There is a pullback support level.
Enjoying your TradingView experience? Review us!
Please be advised that the information presented on TradingView is provided to Vantage (‘Vantage Global Limited’, ‘we’) by a third-party provider (‘Everest Fortune Group’). Please be reminded that you are solely responsible for the trading decisions on your account. There is a very high degree of risk involved in trading. Any information and/or content is intended entirely for research, educational and informational purposes only and does not constitute investment or consultation advice or investment strategy. The information is not tailored to the investment needs of any specific person and therefore does not involve a consideration of any of the investment objectives, financial situation or needs of any viewer that may receive it. Kindly also note that past performance is not a reliable indicator of future results. Actual results may differ materially from those anticipated in forward-looking or past performance statements. We assume no liability as to the accuracy or completeness of any of the information and/or content provided herein and the Company cannot be held responsible for any omission, mistake nor for any loss or damage including without limitation to any loss of profit which may arise from reliance on any information supplied by Everest Fortune Group.

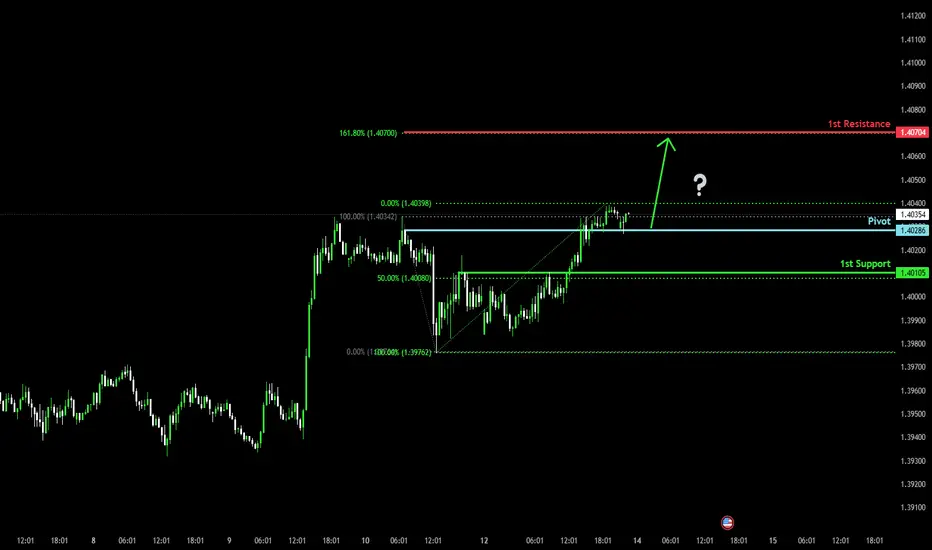
Bullish momentum to extend?The Loonie (USD/CAD) has bounced off the pivot which is a pullback support, and could rise to the 1st resistance.
Pivot: 1.3028
1st Support: 1.4010
1st Resistance: 1.4070
Disclaimer:
The above opinions given constitute general market commentary, and do not constitute the opinion or advice of IC Markets or any form of personal or investment advice.
Any opinions, news, research, analyses, prices, other information, or links to third-party sites contained on this website are provided on an "as-is" basis, are intended only to be informative, is not an advice nor a recommendation, nor research, or a record of our trading prices, or an offer of, or solicitation for a transaction in any financial instrument and thus should not be treated as such. The information provided does not involve any specific investment objectives, financial situation and needs of any specific person who may receive it. Please be aware, that past performance is not a reliable indicator of future performance and/or results. Past Performance or Forward-looking scenarios based upon the reasonable beliefs of the third-party provider are not a guarantee of future performance. Actual results may differ materially from those anticipated in forward-looking or past performance statements. IC Markets makes no representation or warranty and assumes no liability as to the accuracy or completeness of the information provided, nor any loss arising from any investment based on a recommendation, forecast or any information supplied by any third-party.