USDCAD | FRGNT DAILY FORECAST | Q1 | W6 | D11 | Y26📅 Q1 | W6 | D11 | Y26
📊USDCAD | FRGNT DAILY FORECAST |
🔍 Analysis Approach
I’m applying a developed version of Smart Money Concepts, with a structured focus on:
• Identifying Key Points of Interest (POIs) on Higher Time Frames (HTFs) 🕰️
• Using those POIs to define a clear and controlled trading range 📐
• Refining those zones on Lower Time Frames (LTFs) 🔎
• Waiting for a Break of Structure (BoS) as confirmation ✅
This process keeps me precise, disciplined, and aligned with market narrative, rather than reacting emotionally or chasing price.
💡 My Motto
“Capital management, discipline, and consistency in your trading edge.”
A positive risk-to-reward ratio, combined with a high-probability execution model, is the backbone of any sustainable trading plan 📈🔐
⚠️ On Losses
Losses are part of the mathematical reality of trading 🎲
They don’t define you — they are necessary, expected, and managed.
We acknowledge them, learn, and move forward 📊➡️
🙏 I appreciate you taking the time to review my Daily Forecast.
Further context and supporting material can be found in the Links section.
Stay sharp 🧠
Stay consistent 🎯
Protect your capital 🔐
— FRGNT 🚀📈
FX:USDCAD
Usdcadanalysis

USDCAD After Selloff Structure Building for a Recovery LegUSDCAD has shifted from a clean downtrend into a compression phase, and that usually means one thing on the higher timeframe a directional break is getting closer. The daily structure shows a sharp selloff, a strong reaction from the lows, and now a tightening wedge under resistance. With oil, rate expectations, and USD flows all pulling on this pair, this is one of those spots where structure and macro are about to collide. I’m treating this as a decision zone, not a drift zone.
Current Bias
Bullish recovery bias while price holds above the recent base and compression support.
Momentum has shifted from impulsive selling to corrective basing with higher lows forming into resistance.
Key Fundamental Drivers
USD side supported by relatively firmer US macro data and slower Fed easing expectations.
CAD remains highly sensitive to crude oil direction and global growth expectations.
Recent oil inventory data and price swings have increased CAD volatility.
Bank of Canada policy tone is cautious, with markets leaning toward gradual easing if growth slows.
Yield spreads currently favor USD slightly over CAD.
Macro Context
Interest Rates: Fed expected to ease slowly, not aggressively, after sticky services inflation and resilient activity. BoC is also cautious, but Canada’s growth sensitivity makes rate-cut expectations more reactive to data.
Growth Trends: US growth signals remain steadier than Canada’s, where household leverage and housing sensitivity matter more.
Commodity Flows: Oil is the key macro lever for CAD. When crude firms, CAD tends to strengthen and USDCAD falls. When oil stalls or drops, USDCAD lifts.
Risk Environment: Mixed risk sentiment keeps commodity currencies choppy rather than trending cleanly.
Geopolitics: Any supply-side oil shock or trade tension can quickly feed into CAD pricing.
Primary Risk to the Trend
A strong upside break in crude oil combined with softer US data would flip flows back into CAD and invalidate the recovery structure, pushing USDCAD back toward the recent lows.
Most Critical Upcoming News/Event
Top watch items:
US inflation and labor data for Fed path repricing
Canadian CPI and employment for BoC expectations
Weekly crude oil inventory and oil price trend
Leader/Lagger Dynamics
USDCAD is usually a lagger to oil and USD index moves, not a primary leader.
It tends to follow:
Crude oil direction first
Broad USD trend (DXY, EURUSD) second
North American yield spread moves
If oil leads strongly, USDCAD reacts rather than predicts.
Key Levels
Support Levels:
1.3550 zone
1.3480–1.3500 major base support
Resistance Levels:
1.3710
1.3920
1.4140 higher timeframe resistance
Stop Loss (SL):
Below 1.3480 for bullish recovery structure
Take Profit (TP):
1.3710 first target
1.3920 second target
1.4140 extended target if macro confirms
Summary: Bias and Watchpoints
USDCAD is transitioning from a strong selloff into a tightening base, and the structure favors a neutral-to-bullish recovery as long as price holds above the 1.3480 support zone. The fundamental backdrop gives the dollar a mild edge through steadier US data and a slower Fed easing path, while CAD remains tied closely to oil and growth sensitivity. The biggest risk to the recovery view is a renewed oil rally paired with soft US numbers, which would swing flows back into CAD. The key events to watch are US inflation and labor releases, Canadian CPI and jobs, and crude oil trends. In terms of behavior, USDCAD follows oil and broad USD moves more than it leads them, so keep those drivers front and center while trading the 1.3710 and 1.3920 upside levels against the 1.3480 structural floor.

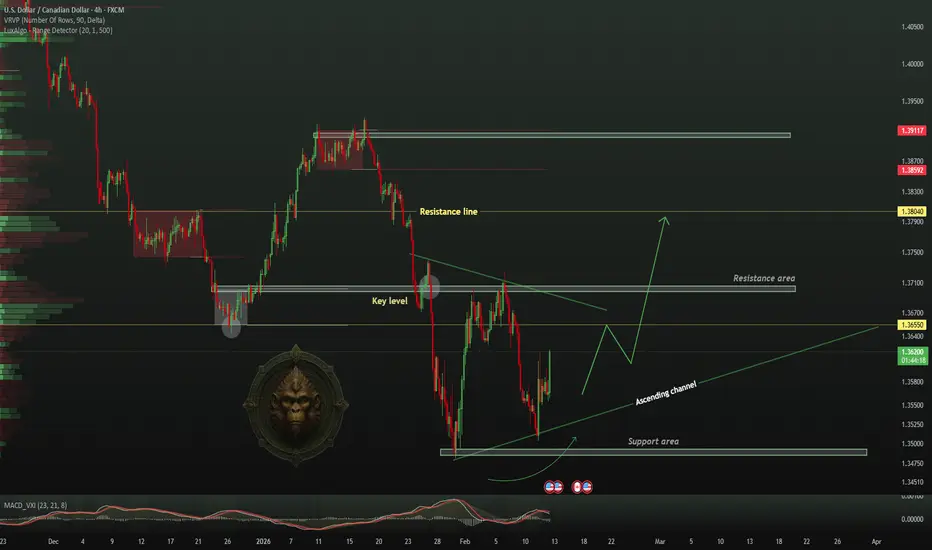
TheGrove | USDCAD Buy | Idea Trading AnalysisUSDCAD is falling towards a support level which is a pullback support and could bounce from this level to our take profit.
We expect a decline in the channel after testing the current level which suggests that the price will continue to rise
Hello Traders, here is the full analysis.
I think we can soon see more fall from this range! GOOD LUCK! Great BUY opportunity USDCAD
I still did my best and this is the most likely count for me at the moment.
-------------------
Traders, if you liked this idea or if you have your own opinion about it, write in the comments. I will be glad 🤝
Positive Bias Still Hovering Over This PairThe USD/CAD pair traded with a positive bias around 1.3580 during today's Asian session. This strengthening was driven by the dominance of the US dollar following the release of solid employment data, although further gains were limited by stable crude oil prices.
🛠️ USD/CAD Technical Analysis (Intraday)
Technically, the pair is testing a short-term resistance area.
⚡Immediate Support ($1.3520 - $1.3540): This level serves as the first line of defense for buyers. As long as the price remains above 1.3520, the daily bias remains bullish.
⚡Key Resistance ($1.3620): A breakout of this level will open the way to the next psychological target at 1.3700.
⚡RSI Indicator: Located around 58, indicating healthy upward momentum but beginning to approach the overbought zone.

USDCAD Weekly Liquidity-Based Smart Money Trading PlanOANDA:USDCAD is no longer in a clean trend phase. After a sharp bearish displacement that swept sell-side liquidity, price is now transitioning into a corrective liquidity rotation, where Smart Money is engineering both premium sells and discount buys rather than chasing continuation.
The recent rebound is corrective in nature, showing classic SMC behavior:
liquidity taken → structure shift → controlled retracement back into key zones.
This environment favors fade-at-zones execution, not breakout trading.
🌐 Market Context (This Week’s Hot USDCAD News)
USDCAD volatility this week is shaped by several key drivers:
US CPI & Fed commentary keeping USD flows reactive and two-sided
Crude oil fluctuations, directly impacting CAD strength
BoC maintaining a cautious, data-dependent stance, limiting CAD follow-through
Market positioning favoring mean reversion and liquidity rebalancing
This macro backdrop supports a range-bound, liquidity-driven week rather than a one-directional trend.
📊 Market Structure & Liquidity Read
HTF bearish expansion completed with strong downside displacement
Sell-side liquidity below prior lows already swept
Bullish CHoCH formed, signaling corrective rebalancing phase
Price now rotating between discount demand and premium supply
Premium zone above acting as inducement for late buyers
Smart Money Framework:
Sweep liquidity → induce retracement → distribute at premium → rebalance again.
🔑 Key Weekly Trading Scenarios
🟢 Discount Buy Setup — Liquidity Re-Accumulation
BUY USDCAD: 1.35847 – 1.35726
SL: 1.35130
Confluence:
HTF discount pricing
Prior sell-side liquidity pool
Reaction base after liquidity sweep
Execution rule:
Wait for LTF bullish CHoCH / BOS before entering.
Expectation:
Reaction from discount → rotation back toward equilibrium / premium.
🔴 Premium Sell Setup — Smart Money Distribution
SELL USDCAD: 1.37537 – 1.37700
SL: 1.38336
Confluence:
HTF premium zone
Prior corrective high & inducement area
Potential distribution before continuation lower
Expectation:
Rejection from premium → pullback toward discount liquidity.
📌 Bias & Execution Notes
Weekly bias: Rotational, liquidity-based
Avoid emotional breakout chasing
Let price come to Smart Money levels
Confirmation always beats prediction
USDCAD this week is not about direction —
it’s about where liquidity is engineered to be taken next.

USDCAD: AB=CD pattern forming, price is expected to drop heavy!The USDCAD pair has two key areas where the price could reject. These areas hold potential and could serve as order blocs. The first entry is expected to be more accurate and likely to occur. However, if it doesn’t respect our level and breaks through the region, the price is likely to head towards the second zone of reversal. Focus on both areas rather than just the first, as we need to consider all market possibilities. Good luck and trade safely.
Like and comment for more. Thanks.
Team Setupsfx_

USDCAD - Retest of Supply Zone Offers Fresh Short OpportunitiesHello Traders! 👋
What are your thoughts on USDCAD?
Price is in a higher‑timeframe supply / resistance zone and has just retested that broken support-now-resistance area.
The idea is to wait for bearish confirmation around this zone and then look for short entries, targeting a continuation of the downtrend to lower levels.
Don’t forget to like and share your thoughts in the comments! ❤️

USDCAD — FRGNT FUN COUPON FRIDAY Q1 | D6 | W5 | Y26📅 Q1 | D6 | W5 | Y26
📊 USDCAD — FRGNT FUN COUPON FRIDAY
🔍 Analysis Approach
I’m applying a developed version of Smart Money Concepts, with a structured focus on:
• Identifying Key Points of Interest (POIs) on Higher Time Frames (HTFs) 🕰️
• Using those POIs to define a clear and controlled trading range 📐
• Refining those zones on Lower Time Frames (LTFs) 🔎
• Waiting for a Break of Structure (BoS) as confirmation ✅
This process keeps me precise, disciplined, and aligned with market narrative, rather than reacting emotionally or chasing price.
💡 My Motto
“Capital management, discipline, and consistency in your trading edge.”
A positive risk-to-reward ratio, combined with a high-probability execution model, is the backbone of any sustainable trading plan 📈🔐
⚠️ On Losses
Losses are part of the mathematical reality of trading 🎲
They don’t define you — they are necessary, expected, and managed.
We acknowledge them, learn, and move forward 📊➡️
🙏 I appreciate you taking the time to review my Daily Forecast.
Further context and supporting material can be found in the Links section.
Stay sharp 🧠
Stay consistent 🎯
Protect your capital 🔐
— FRGNT 🚀📈
FX:USDCAD

USDCAD — FRGNT DAILY FORECAST Q1 | D5 | W5 | Y26📅 Q1 | D5 | W5 | Y26
📊 USDCAD — FRGNT DAILY FORECAST
🔍 Analysis Approach
I’m applying a developed version of Smart Money Concepts, with a structured focus on:
• Identifying Key Points of Interest (POIs) on Higher Time Frames (HTFs) 🕰️
• Using those POIs to define a clear and controlled trading range 📐
• Refining those zones on Lower Time Frames (LTFs) 🔎
• Waiting for a Break of Structure (BoS) as confirmation ✅
This process keeps me precise, disciplined, and aligned with market narrative, rather than reacting emotionally or chasing price.
💡 My Motto
“Capital management, discipline, and consistency in your trading edge.”
A positive risk-to-reward ratio, combined with a high-probability execution model, is the backbone of any sustainable trading plan 📈🔐
⚠️ On Losses
Losses are part of the mathematical reality of trading 🎲
They don’t define you — they are necessary, expected, and managed.
We acknowledge them, learn, and move forward 📊➡️
🙏 I appreciate you taking the time to review my Daily Forecast.
Further context and supporting material can be found in the Links section.
Stay sharp 🧠
Stay consistent 🎯
Protect your capital 🔐
— FRGNT 🚀📈
FX:USDCAD

USDCAD— FRGNT DAILY FORECAST Q1 | D4 | W5 | Y26📅 Q1 | D4 | W5 | Y26
📊 USDCAD— FRGNT DAILY FORECAST
🔍 Analysis Approach
I’m applying a developed version of Smart Money Concepts, with a structured focus on:
• Identifying Key Points of Interest (POIs) on Higher Time Frames (HTFs) 🕰️
• Using those POIs to define a clear and controlled trading range 📐
• Refining those zones on Lower Time Frames (LTFs) 🔎
• Waiting for a Break of Structure (BoS) as confirmation ✅
This process keeps me precise, disciplined, and aligned with market narrative, rather than reacting emotionally or chasing price.
💡 My Motto
“Capital management, discipline, and consistency in your trading edge.”
A positive risk-to-reward ratio, combined with a high-probability execution model, is the backbone of any sustainable trading plan 📈🔐
⚠️ On Losses
Losses are part of the mathematical reality of trading 🎲
They don’t define you — they are necessary, expected, and managed.
We acknowledge them, learn, and move forward 📊➡️
🙏 I appreciate you taking the time to review my Daily Forecast.
Further context and supporting material can be found in the Links section.
Stay sharp 🧠
Stay consistent 🎯
Protect your capital 🔐
— FRGNT 🚀📈
FX:USDCAD

+ 6% USDCAD.Q1 | W4 | D29 | Y26. FRGNT DAILY CHART FORECAST
📅 Q1 | W4 | D29 | Y26
📊 USDCAD— FRGNT DAILY CHART FORECAST
🔍 Analysis Approach
I’m applying a developed version of Smart Money Concepts, with a structured focus on:
• Identifying Key Points of Interest (POIs) on Higher Time Frames (HTFs) 🕰️
• Using those POIs to define a clear and controlled trading range 📐
• Refining those zones on Lower Time Frames (LTFs) 🔎
• Waiting for a Break of Structure (BoS) as confirmation ✅
This process keeps me precise, disciplined, and aligned with market narrative, rather than reacting emotionally or chasing price.
💡 My Motto
“Capital management, discipline, and consistency in your trading edge.”
A positive risk-to-reward ratio, combined with a high-probability execution model, is the backbone of any sustainable trading plan 📈🔐
⚠️ On Losses
Losses are part of the mathematical reality of trading 🎲
They don’t define you — they are necessary, expected, and managed.
We acknowledge them, learn, and move forward 📊➡️
🙏 I appreciate you taking the time to review my Daily Forecast.
Further context and supporting material can be found in the Links section.
Stay sharp 🧠
Stay consistent 🎯
Protect your capital 🔐
— FRGNT 🚀📈
FX:USDCAD

USDCAD— FRGNT DAILY CHART FORECAST. Q1 | W4 | D29 | Y26📅 Q1 | W4 | D29 | Y26
📊 USDCAD— FRGNT DAILY CHART FORECAST
🔍 Analysis Approach
I’m applying a developed version of Smart Money Concepts, with a structured focus on:
• Identifying Key Points of Interest (POIs) on Higher Time Frames (HTFs) 🕰️
• Using those POIs to define a clear and controlled trading range 📐
• Refining those zones on Lower Time Frames (LTFs) 🔎
• Waiting for a Break of Structure (BoS) as confirmation ✅
This process keeps me precise, disciplined, and aligned with market narrative, rather than reacting emotionally or chasing price.
💡 My Motto
“Capital management, discipline, and consistency in your trading edge.”
A positive risk-to-reward ratio, combined with a high-probability execution model, is the backbone of any sustainable trading plan 📈🔐
⚠️ On Losses
Losses are part of the mathematical reality of trading 🎲
They don’t define you — they are necessary, expected, and managed.
We acknowledge them, learn, and move forward 📊➡️
🙏 I appreciate you taking the time to review my Daily Forecast.
Further context and supporting material can be found in the Links section.
Stay sharp 🧠
Stay consistent 🎯
Protect your capital 🔐
— FRGNT 🚀📈
FX:USDCAD

USDCAD ASIA RANGE SETUP. PROCESS DRIVEN. Q1 | W4 | D29 | Y26📅 Q1 | W4 | D29 | Y26
📊 USDCAD— FRGNT DAILY CHART FORECAST
🔍 Analysis Approach
I’m applying a developed version of Smart Money Concepts, with a structured focus on:
• Identifying Key Points of Interest (POIs) on Higher Time Frames (HTFs) 🕰️
• Using those POIs to define a clear and controlled trading range 📐
• Refining those zones on Lower Time Frames (LTFs) 🔎
• Waiting for a Break of Structure (BoS) as confirmation ✅
This process keeps me precise, disciplined, and aligned with market narrative, rather than reacting emotionally or chasing price.
💡 My Motto
“Capital management, discipline, and consistency in your trading edge.”
A positive risk-to-reward ratio, combined with a high-probability execution model, is the backbone of any sustainable trading plan 📈🔐
⚠️ On Losses
Losses are part of the mathematical reality of trading 🎲
They don’t define you — they are necessary, expected, and managed.
We acknowledge them, learn, and move forward 📊➡️
🙏 I appreciate you taking the time to review my Daily Forecast.
Further context and supporting material can be found in the Links section.
Stay sharp 🧠
Stay consistent 🎯
Protect your capital 🔐
— FRGNT 🚀📈

USD/CAD Falls Below the 2025 LowUSD/CAD Falls Below the 2025 Low
Yesterday, financial markets were closely watching statements from central banks regarding interest rates, including the Federal Reserve and the Bank of Canada. According to Forex Factory:
→ The Federal Reserve kept the Federal Funds Rate at 3.75% by a majority vote. “The economy has once again surprised us with its strength,” Powell said at the press conference. The Fed Chair also added that “our policy is in a good place”.
→ The Bank of Canada left the Overnight Rate unchanged at 2.25%. In its official statement, significant attention was paid to the impact of uncertainty surrounding the trade agreement between Canada, the United States and Mexico (CUSMA).
Although there were no surprises and the central banks’ decisions matched analysts’ forecasts, the reaction of the USD/CAD pair was quite dynamic. After a spike in volatility, the exchange rate fell below the 2025 low. Moreover, on higher-timeframe charts, a bearish break of support is visible, with that support running through the lows of 2023–2025.
Technical Analysis of the USD/CAD Chart
On 19 January, when analysing the USD/CAD chart, we:
→ highlighted important signs of bullish weakness on the chart;
→ suggested that bears might seize the initiative and attempt a break of the local ascending channel (shown in blue).
Indeed, a bearish breakout occurred, after which the price formed a trajectory resembling an accelerating plunge (approximately −2.7% over 10 days). At the same time, there are grounds to assess the market within the context of a long-term downtrend (shown in red).
In this context, we see that the price is near the lower boundary of the channel, which may act as support and slow the decline. However, even if bulls attempt to form a rebound, they are likely to face significant difficulties, because:
→ the price fell aggressively from the median to the lower boundary and broke the December low with virtually no local recoveries;
→ the area around the 1.3650 level appears to be a key resistance zone.
Thus, the USD/CAD exchange rate reflects the broader January trend, in which the US dollar is under considerable pressure due to geopolitical and other factors. Notably, even Powell’s comment about the “strength of the economy” failed to support the dollar. This suggests that the market may currently be driven not by past successes of the US economy, but by concerns about future uncertainty.
This article represents the opinion of the Companies operating under the FXOpen brand only. It is not to be construed as an offer, solicitation, or recommendation with respect to products and services provided by the Companies operating under the FXOpen brand, nor is it to be considered financial advice.

USDCAD: Bearish! Sell The Pullback!Welcome back to the Weekly Forex Forecast for the week of Jan 26-30th.
USDCAD is weak, as the USD is trending lower against the CAD. Looking at the bearish momentum from las t week to continue going into this week.
Enjoy!
May profits be upon you.
Leave any questions or comments in the comment section.
I appreciate any feedback from my viewers!
Like and/or subscribe if you want more accurate analysis.
Thank you so much!
Disclaimer:
I do not provide personal investment advice and I am not a qualified licensed investment advisor.
All information found here, including any ideas, opinions, views, predictions, forecasts, commentaries, suggestions, expressed or implied herein, are for informational, entertainment or educational purposes only and should not be construed as personal investment advice. While the information provided is believed to be accurate, it may include errors or inaccuracies.
I will not and cannot be held liable for any actions you take as a result of anything you read here.
Conduct your own due diligence, or consult a licensed financial advisor or broker before making any and all investment decisions. Any investments, trades, speculations, or decisions made on the basis of any information found on this channel, expressed or implied herein, are committed at your own risk, financial or otherwise.

USDCAD — FRGNT DAILY CHART FORECAST. Q1 | W4 | D28 | Y26📅 Q1 | W4 | D28 | Y26
📊 USDCAD — FRGNT DAILY CHART FORECAST
🔍 Analysis Approach
I’m applying a developed version of Smart Money Concepts, with a structured focus on:
• Identifying Key Points of Interest (POIs) on Higher Time Frames (HTFs) 🕰️
• Using those POIs to define a clear and controlled trading range 📐
• Refining those zones on Lower Time Frames (LTFs) 🔎
• Waiting for a Break of Structure (BoS) as confirmation ✅
This process keeps me precise, disciplined, and aligned with market narrative, rather than reacting emotionally or chasing price.
💡 My Motto
“Capital management, discipline, and consistency in your trading edge.”
A positive risk-to-reward ratio, combined with a high-probability execution model, is the backbone of any sustainable trading plan 📈🔐
⚠️ On Losses
Losses are part of the mathematical reality of trading 🎲
They don’t define you — they are necessary, expected, and managed.
We acknowledge them, learn, and move forward 📊➡️
🙏 I appreciate you taking the time to review my Daily Forecast.
Further context and supporting material can be found in the Links section.
Stay sharp 🧠
Stay consistent 🎯
Protect your capital 🔐
— FRGNT 🚀📈
FX:USDCAD

USDCAD— FRGNT DAILY CHART FORECAST. Q1 | W4 | D28 | Y26📅 Q1 | W4 | D28 | Y26
📊 USDCAD— FRGNT DAILY CHART FORECAST
🔍 Analysis Approach
I’m applying a developed version of Smart Money Concepts, with a structured focus on:
• Identifying Key Points of Interest (POIs) on Higher Time Frames (HTFs) 🕰️
• Using those POIs to define a clear and controlled trading range 📐
• Refining those zones on Lower Time Frames (LTFs) 🔎
• Waiting for a Break of Structure (BoS) as confirmation ✅
This process keeps me precise, disciplined, and aligned with market narrative, rather than reacting emotionally or chasing price.
💡 My Motto
“Capital management, discipline, and consistency in your trading edge.”
A positive risk-to-reward ratio, combined with a high-probability execution model, is the backbone of any sustainable trading plan 📈🔐
⚠️ On Losses
Losses are part of the mathematical reality of trading 🎲
They don’t define you — they are necessary, expected, and managed.
We acknowledge them, learn, and move forward 📊➡️
🙏 I appreciate you taking the time to review my Daily Forecast.
Further context and supporting material can be found in the Links section.
Stay sharp 🧠
Stay consistent 🎯
Protect your capital 🔐
— FRGNT 🚀📈
FX:USDCAD

USDCAD — FRGNT DAILY CHART POST TRADE ANALYSIS. SIMPLE TRADING!📅 Q1 | W4 | D26| Y26
📊 USDCAD — FRGNT DAILY CHART POST TRADE ANALYSIS
🔍 Analysis Approach
I’m applying a developed version of Smart Money Concepts, with a structured focus on:
• Identifying Key Points of Interest (POIs) on Higher Time Frames (HTFs) 🕰️
• Using those POIs to define a clear and controlled trading range 📐
• Refining those zones on Lower Time Frames (LTFs) 🔎
• Waiting for a Break of Structure (BoS) as confirmation ✅
This process keeps me precise, disciplined, and aligned with market narrative, rather than reacting emotionally or chasing price.
💡 My Motto
“Capital management, discipline, and consistency in your trading edge.”
A positive risk-to-reward ratio, combined with a high-probability execution model, is the backbone of any sustainable trading plan 📈🔐
⚠️ On Losses
Losses are part of the mathematical reality of trading 🎲
They don’t define you — they are necessary, expected, and managed.
We acknowledge them, learn, and move forward 📊➡️
🙏 I appreciate you taking the time to review my Daily Forecast.
Further context and supporting material can be found in the Links section.
Stay sharp 🧠
Stay consistent 🎯
Protect your capital 🔐
— FRGNT 🚀📈
FX:USDCAD

USDCAD — FRGNT DAILY CHART FORECAST. Q1 | W4 | D26| Y26📅 Q1 | W4 | D26| Y26
📊 USDCAD — FRGNT DAILY CHART FORECAST
🔍 Analysis Approach
I’m applying a developed version of Smart Money Concepts, with a structured focus on:
• Identifying Key Points of Interest (POIs) on Higher Time Frames (HTFs) 🕰️
• Using those POIs to define a clear and controlled trading range 📐
• Refining those zones on Lower Time Frames (LTFs) 🔎
• Waiting for a Break of Structure (BoS) as confirmation ✅
This process keeps me precise, disciplined, and aligned with market narrative, rather than reacting emotionally or chasing price.
💡 My Motto
“Capital management, discipline, and consistency in your trading edge.”
A positive risk-to-reward ratio, combined with a high-probability execution model, is the backbone of any sustainable trading plan 📈🔐
⚠️ On Losses
Losses are part of the mathematical reality of trading 🎲
They don’t define you — they are necessary, expected, and managed.
We acknowledge them, learn, and move forward 📊➡️
🙏 I appreciate you taking the time to review my Daily Forecast.
Further context and supporting material can be found in the Links section.
Stay sharp 🧠
Stay consistent 🎯
Protect your capital 🔐
— FRGNT 🚀📈
FX:USDCAD

TheGrove | AUDUSD Sell | Idea Trading AnalysisYou can expect a reaction in the direction of selling from the specified Resistance line
USDCAD moving higher as it tests the strong resistance level..
We expect a bearish move from the confluence zone.
Hello Traders, here is the full analysis.
I think we can soon see more fall from this range! GOOD LUCK! Great SELL opportunity USDCAD
I still did my best and this is the most likely count for me at the moment.
-------------------
Traders, if you liked this idea or if you have your own opinion about it, write in the comments. I will be glad 🤝

#USDCAD: +500 Pips Swing Sell Opportunity; One Not To Miss! Dear Traders,
The USDCAD pair is currently in a strong bearish trend and we anticipate a price correction. We expect the price to turn bullish in the short term, filling the liquidity gap it’s left behind. Once filled, the price could reverse and continue selling until it reaches around 1.3200, a 500+ pip move. Currently, there’s only one target, and the stop-loss can be adjusted based on your risk management.
The USD is plummeting, but there’s a chance it could show some bullish momentum. However, the CAD is experiencing a strong, continuous bullish trend, so we expect a correction.
If you enjoy our work, please like and comment. Also, follow us for updates whenever we post ideas.
Team Setupsfx_

TheGrove | USDCAD buy | Idea Trading AnalysisUSD/CAD is trading within a Ascending pattern, with price holding above the ascending support line after a clear bullish and is moving on support line and after going up. Price is trading inside a bullish ascending channel after a strong break of structure.
We expect a decline in the channel after testing the current level
Hello Traders, here is the full analysis.
I think we can soon see more fall from this range! GOOD LUCK! Great buy opportunity USDCAD
I still did my best and this is the most likely count for me at the moment.
-------------------
Traders, if you liked this idea or if you have your own opinion about it, write in the comments. I will be glad ⚜️

Market Analysis: USD/CAD Refuses to BreakMarket Analysis: USD/CAD Refuses to Break
USD/CAD is consolidating gains and might aim for a fresh increase above 1.3900.
Important Takeaways for USD/CAD Analysis Today
- USD/CAD is showing positive signs above the 1.3880 support zone.
- There is a key bullish trend line forming with support at 1.3890 on the hourly chart.
USD/CAD Technical Analysis
On the hourly chart of USD/CAD, the pair formed a strong base above 1.3850. The US Dollar started a fresh increase above 1.3880 and 1.3900 against the Canadian Dollar.
The bulls pushed the pair above the 1.3920 and 1.3925 levels. The pair cleared the 50-hour simple moving average and settled above 1.3880. A high was formed at 1.3928 and the pair is now consolidating gains.
There was a minor pullback below 1.3900, and the 23.6% Fib retracement level of the upward move from the 1.3854 swing low to the 1.3928 high.
Initial support is near a key bullish trend line at 1.3890 and the 50% Fib retracement. The next key breakdown zone could be 1.3880. The main hurdle for the bears might be 1.3870 on the same USD/CAD chart.
A downside break below the 1.3870 could push the pair further lower. The next key area of interest might be 1.3855, below which the pair might visit 1.3800.
If there is another increase, the pair might face hurdles near 1.3910. A clear upside break above 1.3910 could start another steady increase. In the stated case, the pair could test 1.3930. A close above 1.3930 might send the pair toward 1.3965. Any more gains could open the doors for a test of 1.4000.
This article represents the opinion of the Companies operating under the FXOpen brand only. It is not to be construed as an offer, solicitation, or recommendation with respect to products and services provided by the Companies operating under the FXOpen brand, nor is it to be considered financial advice.
