USDCAD BUY | Idea Trading AnalysisUSDCAD is falling towards a support level which is a pullback support and could bounce from this level to our take profit.
We expect a decline in the channel after testing the current level which suggests that the price will continue to rise
Hello Traders, here is the full analysis.
I think we can soon see more fall from this range! GOOD LUCK! Great BUY opportunity USDCAD
I still did my best and this is the most likely count for me at the moment.
-------------------
Traders, if you liked this idea or if you have your own opinion about it, write in the comments. I will be glad 🤝
Usdcadanalysis

Cad is ready to bay Due to the return of the price to the breaking part of the previous ceiling, and also in the area of 76.4 Fibonacci, we are ready to buy.

USD/CAD Recovers From a 2.5-Month LowUSD/CAD Recovers From a 2.5-Month Low
The main driver of the decline was a sharp shift in sentiment and diverging expectations for policy actions in the United States and Canada.
→ Canada: Friday’s employment data came in far stronger than forecast. As a result, traders sharply reduced the likelihood of a Bank of Canada rate cut at the next meeting, judging the economy resilient enough to pause its easing cycle.
→ United States: Markets are pricing in a high probability of a Federal Reserve rate cut at tomorrow’s meeting (22:00 GMT+3).
This contrast pushed USD/CAD to a 2.5-month low. However, the chart shows that the bulls may still have some grounds for optimism.
USD/CAD Technical Analysis
On 1 December we analysed the USD/CAD chart and:
→ drew an ascending channel (shown in blue) and noted several bearish signals;
→ suggested that the 1.4000 level would act as resistance in the near term, with bears likely to attempt to resume the downward move in USD/CAD.
Indeed, as the arrow indicates, the bears managed to restart the downtrend, which led to:
→ a breakout below the lower boundary of the channel;
→ the need to map out a descending trajectory (shown in red), with its median potentially acting as resistance going forward.
In this context, it is reasonable to assume that the bulls have some cause for hope in the short term, as:
→ the price is rebounding from the lower boundary of the red channel, indicating demand;
→ the RSI has risen from extreme oversold levels;
→ the candle highlighted by the second arrow looks bullish – it closed near the top of its range, forming a long lower shadow.
Given the above, traders should not rule out a corrective recovery in USD/CAD until the Federal Reserve releases its decision, which could significantly impact financial markets.
This article represents the opinion of the Companies operating under the FXOpen brand only. It is not to be construed as an offer, solicitation, or recommendation with respect to products and services provided by the Companies operating under the FXOpen brand, nor is it to be considered financial advice.

USDCAD - Breakout Will Flip the Trend BullishUSDCAD has been sliding inside a well-defined descending channel, completing a full five-wave drop toward the support zone. The structure from the top looks corrective rather than impulsive. That means the downtrend is weakening as it reaches its final leg.
Your count shows Wave 3 finishing at the dashed red line zone, followed by a small Wave 4 bounce, and now the market is pushing into the last Wave 5. This final drop is expected to target the Fibonacci levels near 1.3915 and 1.3895 . Nothing suggests strength until those levels are tested.
The price is still trapped inside the downward channel, and every bounce has been getting sold. That confirms sellers are still in control for now. Wave (C) is close to completion, but buyers haven’t proven anything yet.
The bullish outlook only becomes valid after a clean breakout above the channel. Without that break, any upside move is just noise inside a bearish structure. The breakout must hold with a higher low to confirm a trend reversal.
If the channel breaks decisively, a strong bullish reversal toward 1.40+ becomes possible. The entire structure suggests the downtrend is aging, so a major upside swing is likely once sellers exhaust. Until then, downside targets remain open and caution is necessary.
Stay Tuned!
@Money_Dictators

USDCAD Will Keep Falling!
HI,Traders !
#USDCAD is trading in a
Downtrend and the pair made
A retest of the horizontal
Resistance of 1.39769 from where
We are already seeing a bearish
Move down so we will be
Expecting a further
Bearish move down !
Comment and subscribe to help us grow !

USD/CAD Price Outlook – Trade Setup📊 Technical Structure
OANDA:USDCAD USD/CAD is trading flat around 1.3950, holding below the 1.3966–1.3975 Resistance Zone, where repeated rejections keep the short-term bias tilted to the downside. The pair continues to oscillate within a compressed structure, failing to sustain any break above resistance, while the 1.3928–1.3937 Support Zone remains untested below.
As long as price stays under the resistance band, the structure favours another push lower toward support. A clean hourly close above 1.3975 would invalidate the bearish setup and shift momentum back upward.
🎯 Trade Setup
Entry: 1.3966 – 1.3975
Stop Loss: 1.3980
Take Profit 1: 1.3937
Take Profit 2: 1.3928
Risk–Reward Ratio: Approximately 1 : 2.5
Bearish structure remains valid below 1.3975. A breakout above this level invalidates the setup.
🌐 Macro Background
USD/CAD trades in a tight range ahead of Canada’s November employment report. Markets expect the Unemployment Rate to rise to 7%, signalling slower labour-market conditions and increasing the likelihood that the Bank of Canada (BoC) could extend its easing cycle at next week’s policy meeting. Soft Canadian data would generally weaken the CAD.
Meanwhile, the US Dollar remains subdued as traders firmly price in a 25 bps Fed rate cut at the December 9–10 meeting. According to the CME FedWatch Tool, the probability of a cut stands near 87%. Weakening labour-market indicators in the US and expectations that tariff-driven inflation is non-persistent add to the dovish pressure on the USD.
Overall, both currencies face macro headwinds, but the technical picture for USD/CAD favours a downside continuation toward support unless Canada’s jobs report surprises significantly.
🔑 Key Technical Levels
Resistance Zone: 1.3966 – 1.3975
Support Zone: 1.3928 – 1.3937
Structure Break (Invalidation): 1.3980
Targets: 1.3937 / 1.3928
📌 Trade Summary
USD/CAD remains capped beneath the resistance zone, preserving a short-term bearish structure. The preferred approach is to sell into 1.3966–1.3975, targeting a move back toward 1.3928–1.3937 support. A sustained move above 1.3980 cancels the setup.
⚠️ Disclaimer
This analysis is for reference only and does not constitute trading advice. Trading involves significant risk, and proper risk management is essential.

USDCADUSDCAD
- Double Top in Short Time Frame
- Completed " 12345 " Impulsive Waves
- Break of Structure
- RSI - Divergence
- Bullish Channel as an corrective pattern in Long Time Frame

Canadian Dollar Strengthened Sharply After Unexpected GDP DataThe Canadian Dollar Strengthened Sharply After Unexpected GDP Data
Statistics Canada reported on Friday that real GDP grew by 2.6% year-on-year in the third quarter of 2025, which means:
→ a significant beat compared with analysts’ expectations of just 0.5% year-on-year growth;
→ Canada avoided a technical recession (two consecutive quarters of contraction) following a 1.8% decline in the previous quarter.
The release triggered a strong rally in the Canadian dollar, as markets may have concluded that the Bank of Canada has less need to support the economy with additional liquidity, making the loonie more attractive to hold.
On the other hand, the unexpected GDP rise may partly be a statistical artefact linked to calculation methodology and the impact of tariffs introduced into global trade by the Trump administration. It is possible that GDP grew due to falling imports — meaning that even with strong headline numbers, the underlying economy may remain fragile.
Technical Analysis of USD/CAD
On Friday, the USD/CAD rate fell to its lowest level in a month.
The price then rebounded (as shown by the arrow) from the lower boundary of the channel that has been in place for most of the autumn. This bounce not only confirmed the relevance of the channel but also highlighted strong buying interest around 1.3940.
But should the bulls feel confident?
Note that:
→ throughout November, the price repeatedly slipped below 1.4000 — and each time failed to consolidate beneath this psychological level;
→ Friday’s bearish breakout looked exceptionally strong, with wide bearish candles closing near their lows, signalling clear dominance by sellers;
→ the 50% retracement of the A→B impulse sits near 1.4000.
Given these factors, it is entirely possible that 1.4000 will act as resistance in the short term, and that bears will attempt to resume the downward trend in USD/CAD.
This article represents the opinion of the Companies operating under the FXOpen brand only. It is not to be construed as an offer, solicitation, or recommendation with respect to products and services provided by the Companies operating under the FXOpen brand, nor is it to be considered financial advice.

USDCAD - SHORTUSDCAD dropping from our key level.
USDCAD could not break our daily key level, and there comes the bearish pressure. Price might drop down to the 4h key level.

Market Analysis: USD/CAD Maintains Bullish StrengthMarket Analysis: USD/CAD Maintains Bullish Strength
USD/CAD is showing positive signs and might aim for more gains above 1.4130.
Important Takeaways for USD/CAD Analysis Today
- USD/CAD rallied above 1.4000 and 1.4050 before the bears appeared.
- There is a connecting bullish trend line forming with support at 1.4085 on the hourly chart.
USD/CAD Technical Analysis
On the hourly chart of USD/CAD, the pair formed a strong support base above the 1.3970 level. The US Dollar started a fresh increase above 1.4000 against the Canadian Dollar.
The pair cleared the 50-hour simple moving average and climbed above 1.4050. Finally, it tested the 1.4130 zone before the bears appeared. The pair traded below the 23.6% Fib retracement level of the upward move from the 1.3971 swing low to the 1.4130 high.
Initial support is near a connecting bullish trend line at 1.4085 and the 50-hour simple moving average. A downside break below the trend line might send the pair toward 1.4050.
The next major area on the USD/CAD chart could be the 76.4% Fib retracement at 1.4010. A close below 1.4010 could push the pair further lower. In the stated case, the bears might aim for a test of 1.3970.
On the upside, Initial resistance sits near 1.4105. The main breakout zone could be 1.4130. A clear upside break above 1.4130 could start another steady increase. The next major stop for the bulls might be 1.4200. Any more gains could open the doors for a test of 1.4250.
This article represents the opinion of the Companies operating under the FXOpen brand only. It is not to be construed as an offer, solicitation, or recommendation with respect to products and services provided by the Companies operating under the FXOpen brand, nor is it to be considered financial advice.

USD/CAD Closing in on Breakout! Will Bulls Take Control?🔥 USD/CAD "THE LOONIE": Bullish Breakout Play (Swing Trade Setup) | Layer Entry Strategy 🚀
TradingView Description:
🎯 TRADE IDEA: BULLISH SWING ON USD/CAD
🏆 Plan & Thesis:
The Loonie is approaching a critical juncture! 🧐 We are stalking a potential bullish breakout above the strong resistance zone at 1.41400. Our plan is to patiently wait for a confirmed breakout and momentum shift, signaling the next leg up. This is a swing trade opportunity targeting a key resistance area.
⚡ Why This Setup?
Key Resistance Break: A decisive break above 1.41400 indicates buyer strength overpowering sellers.
Trend Continuation: Aligns with the broader bullish structure on the higher timeframes.
Low-Risk, High-Reward Entry: Using the "Thief" layer strategy to optimize our average entry price.
📈 Trade Execution Details:
🎯 Entry Strategy (The "Thief" Layer Method): 🤑
We do not chase the price! We use a strategic layer of Buy Limit orders to enter on any retracement after the breakout is confirmed.
Layer 1: 1.41200
Layer 2: 1.41000
Layer 3: 1.40800
Layer 4: 1.40600
👉 You can adjust the number of layers and levels based on your capital and risk appetite.
🛑 Stop Loss (RISK MANAGEMENT):
A consolidated stop loss is placed below all entry layers at 1.40400.
⚠️ Disclaimer: This is MY stop loss. Please adjust your position size and SL based on YOUR personal risk management strategy. Protect your capital!
🎯 Take Profit Target:
Our primary profit target is set at 1.42100, a zone of strong historical resistance where we anticipate a pullback or overbought conditions.
💡 Pro Tip: Consider taking partial profits on the way up and moving your stop loss to breakeven to secure risk-free trades!
🌐 Market Context & Correlated Pairs to Watch:
Understanding correlations is key to validating this thesis! Keep an eye on these:
OANDA:USDCAD & PEPPERSTONE:USDX (DXY): 👑 DIRECT CORRELATION. A stronger US Dollar Index typically boosts USD/CAD. Watch for DXY strength to confirm our bullish bias.
OANDA:USDCAD & GETTEX:WTIC (Crude Oil): 👑 INVERSE CORRELATION. Canada is a major oil exporter. If Oil prices fall, CAD often weakens, pushing USD/CAD higher (bullish for our trade).
FX:EURUSD & FX:GBPUSD : These major pairs often move inversely to the USD. If they are falling, it can signal broad USD strength, supporting our USD/CAD long.
✅ Key Takeaways:
✅ Wait for a confirmed breakout and close above 1.41400.
✅ Execute entries using the layer method for best average price.
✅ MANAGE YOUR RISK! This is not financial advice. Your risk, your rules.
✅ Watch correlated pairs ( TVC:DXY , TVC:XAU , GETTEX:WTIC ) for confluence.
👑 Let's get this bread, traders! If you found this idea helpful, please give it a LIKE 👍, SHARE it with a fellow trader, and FOLLOW me for more high-quality setups! Your support helps the community grow! 💬 Drop a comment below with your thoughts!

USD/CAD 4H Bullish Channel Continuation From Key Demand ZoneUSD/CAD continues to respect its ascending channel on the 4H timeframe, with price recently rebounding from a well-defined demand zone that aligns with structural support. This reaction confirms continued bullish interest and maintains the overall upward market structure. As long as price holds above this zone, the probability favors a continuation toward the upper boundary of the channel. This setup highlights a strong trend-following opportunity supported by momentum, structure, and confluence.

USD/CAD Falls to November LowUSD/CAD Falls to November Low
The Canadian dollar has strengthened, influenced by several factors — the most important of which is arguably the easing of domestic political tensions.
According to media reports, Canada’s draft budget has passed its first round of voting. Although several stages of review remain, the result suggests that there are enough votes for the budget to be approved in the end.
Had the draft budget failed to pass, it would almost certainly have resulted in the resignation of Prime Minister Mark Carney and the calling of new parliamentary elections less than a year after the previous ones.
With the risk of political turmoil receding, the Canadian dollar effectively “breathed a sigh of relief”, appreciating against other currencies.
Technical Analysis of the USD/CAD Chart
This autumn, movements in the USD/CAD pair have shaped a broad ascending channel. Within this structure:
→ the median line acted as resistance at the start of the week;
→ yesterday’s sharp decline pushed the pair into the lower quarter of the channel, and today the QL line is demonstrating resistance.
This indicates that sellers are currently in control, having:
→ broken through local support at 1.40175;
→ kept the pair below the psychological 1.40000 level.
It is possible that they will attempt to extend this momentum and drive USD/CAD towards the lower boundary of the channel — and if that happens, forex traders may look for opportunities to trade a potential upward reversal from this key support.
This article represents the opinion of the Companies operating under the FXOpen brand only. It is not to be construed as an offer, solicitation, or recommendation with respect to products and services provided by the Companies operating under the FXOpen brand, nor is it to be considered financial advice.

USDCAD Resistance Ahead!
HI,Traders !
#USDCAD keeps going up
And the pair is locally oversold
So after it hits the horizontal
Resistance of 1.40666 we
Will be expecting a local
Bearish correction !
Comment and subscribe to help us grow !

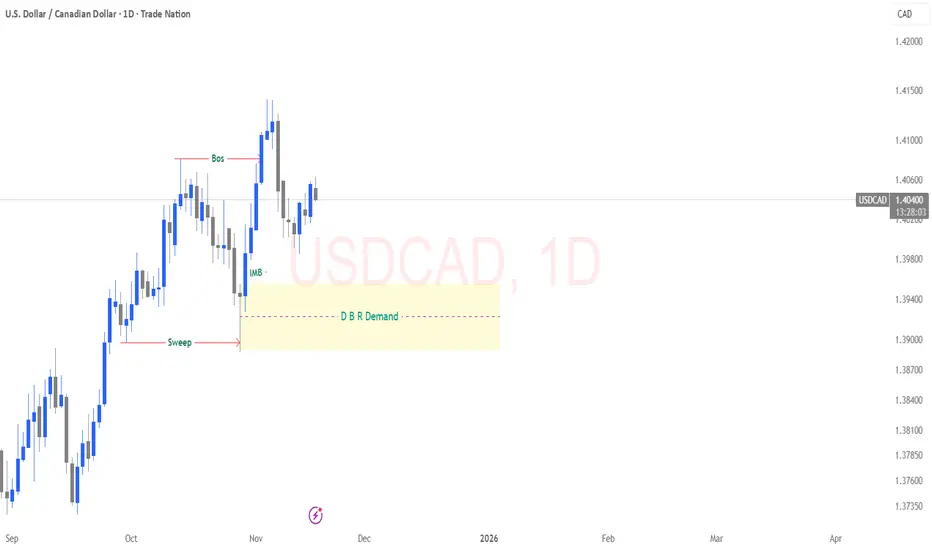
USDCAD – Clean Daily Buy Scenario Price has already established a bullish Break of Structure (BOS), confirming upside order flow on the daily timeframe. After that BOS, the market dipped back down to sweep the previous low, clearing out sell-side liquidity and creating the fuel required for a bullish continuation.
From there, price impulsively rallied, leaving behind a clear imbalance (IMB) and an unmitigated Daily DBR Demand zone the origin of the bullish displacement.
As price pulls back, the expectation is for a corrective move into this DBR demand. This zone represents discounted pricing aligned with the dominant trend and offers high-probability buy setups once lower-timeframe confirmations show up (reaction, BOS, or displacement).
If this demand holds, the next bullish leg should target the highs created above the imbalance, continuing the overall upward structure.
USD/CAD Price Outlook – Trade Setup (USD/CAD)📊 Technical Structure
OANDA:USDCAD USD/CAD remains supported above 1.4014–1.4019, a key intraday demand zone that has supported price multiple times over the past sessions. Price is attempting a rebound from this support area, pushing back toward the 1.4040–1.4045 intraday pivot.
A sustained move above 1.4050 may open room for a continuation toward the resistance zone at 1.4066–1.4072, which aligns with previous supply and structural highs on the 30M chart. Failure to hold 1.4010 would invalidate the bullish setup and expose downside risk toward 1.3980.
Overall, price action favours a buy-the-dip structure as long as the support zone remains intact.
🎯 Trade Setup
Idea: Buy from support zone for continuation toward resistance.
Entry: 1.4014 – 1.4019
Stop Loss: 1.4011
Take Profit 1: 1.4066
Take Profit 2: 1.4072
Risk–Reward Ratio: ≈ 1 : 6.46
Bias remains short-term bullish while the pair trades above 1.4010.
🌐 Macro Background
USD/CAD extends modest gains around 1.4030–1.4050 during Monday’s Asian session as the Canadian Dollar weakens alongside declining crude oil prices.
According to FXStreet, “USD/CAD holds gains near 1.4050 as lower crude Oil prices weigh on the Canadian Dollar.” 【FXStreet】
Oil Pressure on CAD:
WTI crude pulls back from last session’s 2% rise, trading near $59.30 after Russia’s Novorossiysk port resumed operations following a two-day shutdown caused by a Ukrainian drone strike.
Meanwhile, the IEA warns of a potential 4 million bpd oversupply in 2026, reinforcing bearish pressure on energy markets.
BoC Expectations:
Markets expect the Bank of Canada to hold rates steady through 2026, unless economic conditions deteriorate further. October CPI data later today could influence rate expectations.
Fed Commentary:
Hawkish remarks from Fed officials continue to support the US Dollar.
Kansas City Fed President Jeffery Schmid said monetary policy should “lean against demand growth,” calling current conditions “modestly restrictive.”
Rate Cut Odds:
CME FedWatch shows 46% probability of a 25bps Fed cut in December — a sharp decline from 67% last week, reducing near-term dovish expectations.
Overall, the macro backdrop remains slightly USD-supportive, maintaining upward pressure on USD/CAD as long as oil prices stay weak and Fed officials maintain a cautious stance.
🔑 Key Technical Levels
Resistance: 1.4066 – 1.4072
Support: 1.4014 – 1.4019
Psychological Level: 1.4050
📌 Trade Summary
USD/CAD sustains above the 1.4010 support region, keeping the short-term bias tilted to the upside. Weakening oil prices and cautious Fed rhetoric favour a rebound toward 1.4066–1.4072.
A break below 1.4011 would negate the bullish scenario and shift focus toward 1.3980.
⚠️ Disclaimer
This analysis is for reference only and does not constitute trading advice. Trading involves significant risk, and proper risk management is essential.

USD/CAD: Wave of Destruction or Dollar RevivalUSD/CAD: Wave of Destruction or Dollar Revival
📈 Possible Scenarios for the Week
Bearish Scenario (Main Scenario):
Price breaks below ~1.3777
Wave (5) is developing → possible decline to ~1.3570–1.3425
Corrective (Bullish) Scenario:
USD/CAD holds current support
A corrective wave upward is developing to ~1.3970–1.4150
Consolidation:
Range between ~1.3777 and ~1.3970
Prices are gaining strength before the next impulse
✅ Conclusion
USD/CAD could see significant movement in the coming week—the pair is at a crossroads: either the major bearish impulse will continue, or an upward correction will begin.
Key levels: 1.3777 (support) and 1.3970 (resistance)
When trading, it's worth watching for confirmation of the wave structure and price reaction at the designated levels.

There is potential for a correction in the coming months.We are entering one of the most exciting market phases: the start of new major impulse waves in various currency pairs.
For the USD/CAD pair, the corrective phase is coming to an end, and the next major move is forming. What happens next could define opportunities for the next 3–6 months.
Additional Context Analysis:
This analysis uses Elliott Wave terminology, which divides market movements into impulse waves (movements in line with the trend) and corrective waves (movements against the trend).
The key message is that the recent USD/CAD price volatility is merely a correction ahead of a much larger and more profitable impulse move.

USD/CAD) Bearish trend analysis Read The captionSMC Trading point update
Technical analysis of USD/CAD on the 1-hour timeframe. Let’s break down the analysis idea clearly:
---
l Market Context
The overall trend is bearish, as price is trading below both the 50 EMA and 200 EMA, which are sloping downward.
The recent bullish correction appears to have been a retracement within the broader downtrend.
---
Key Technical Insights
1. Bearish Structure:
Price broke below a previous low and confirmed a lower low (LL).
A small bearish flag or rising channel formed during the retracement — a common continuation pattern.
2. Supply Zone (Blue Box):
This zone represents the previous demand turned supply, where sellers re-entered strongly.
Price tapped into this area and sharply rejected, confirming supply dominance.
3. EMA Confluence:
Both EMA(50) and EMA(200) are above price, acting as dynamic resistance.
The rejection from the blue zone occurred around EMA confluence — a strong bearish confirmation signal.
---
Projected Price Action
The structure suggests a minor pullback (to form a lower high) before continuing downward.
The drawn path shows price retesting a small intraday resistance area before resuming the drop.
Target Point: 1.39689 — near the next structural low / liquidity area.
---
Trade Idea Summary
Bias: Bearish continuation
Entry Zone: 1.4010–1.4030 area (retest of minor resistance or broken structure)
Target: 1.3969
Stop-Loss: Above 1.4048 (above supply zone / EMAs)
Risk/Reward Ratio: Approx. 1:2.5 to 1:3 potential setup
Mr SMC Trading point
---
Concept Summary
This setup follows Smart Money Concepts (SMC) logic:
Break of structure → Retracement into supply → Continuation in direction of the higher timeframe trend.
---
Please support boost 🚀 this analysis

USD/CAD) Bullish trend analysis Read The captionSMC Trading point update
Technical analysis of USD/CAD 4-hour timeframe, based on Smart Money Concepts (SMC) and Fibonacci retracement confluences.
Here’s a full breakdown of the idea behind this analysis:
---
Overall Bias: Bullish Continuation
The chart suggests that USD/CAD is in an uptrend, currently undergoing a corrective pullback into a key discount zone (buy area) before potentially continuing higher toward the next liquidity target.
---
Technical Breakdown
1. Trend Context
The pair recently broke structure to the upside, indicating a bullish shift in market structure (MSB).
Price has been forming higher highs and higher lows, confirming bullish order flow.
The 50 EMA (blue) and 200 EMA (black) are aligned in bullish order — 50 EMA above 200 EMA — signaling overall bullish momentum.
2. Retracement / Discount Zone
Price is currently pulling back after a bullish impulse.
The blue box zone represents a discount buy zone between 0.62–0.79 Fibonacci retracement levels.
The green arrow marks the expected reversal area, showing potential demand and liquidity accumulation before continuation.
Confluence:
200 EMA support
0.62–0.79 Fibonacci zone
Prior structure / demand zone
3. Projected Price Path
The price is expected to:
1. Dip into the discount zone (1.3980–1.3950 area).
2. Find bullish rejection / confirmation from that zone.
3. Reverse upward, targeting 1.42135 (the next liquidity / target point).
4. Target Point
The target at 1.42135 aligns with:
Prior swing high (liquidity zone).
Fibonacci extension completion.
Potential imbalance fill.
---
Market Structure Summary
Element Direction Key Levels
Market Bias Bullish
Demand Zone (Buy Area) 1.3980 – 1.3950 0.62–0.79 fib confluence
Support Confluence 200 EMA + Demand Zone
Entry Zone Bullish reaction from blue zone
Target 1.4213 Liquidity target
---
Trade Idea (Conceptually)
Wait for price to reach the blue demand zone and show a bullish confirmation candle or structure shift.
Then consider a long entry with:
Entry: Around 1.3980–1.3960
Stop-loss: Below 1.3930 (beneath zone)
Take-profit: Around 1.4213
Mr SMC Trading point
---
Narrative Summary
> This setup expects a bullish continuation following a corrective retracement into a high-probability demand area. The confluence of Fibonacci discount levels, EMAs, and structure support strengthens the case for buyers to rejoin the trend, targeting liquidity above 1.4213.
---
Please support boost 🚀 this analysis

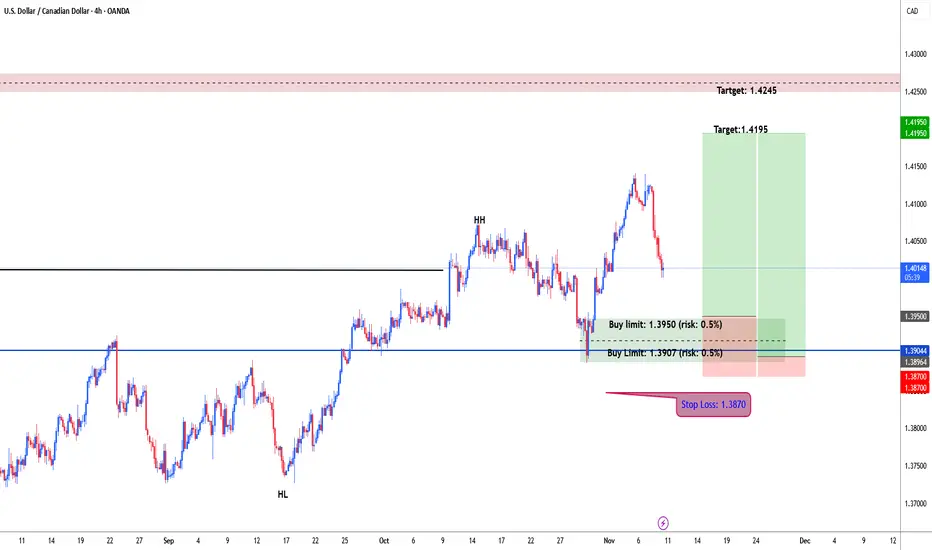
USDCAD possible bullish for 1.4195 & 1.4245#usdcad daily chart forming higher high and higher low. usdcad price broke and closed above 1.4016. wait for correction and test demand zone for another leg higher. i placed my orders at 1.3950 & 1.3906 each with 0.5% risk. stop loss: 1.3870. target: 1.4195 & 1.4245 as well.
USDCAD Eye a Deeper Pullback as Oil & Dollar Momentum CoolsUSDCAD, After a sharp rebound toward 1.4020, USD/CAD is showing signs of exhaustion as selling pressure re-emerges at the top of the recent range. With oil prices stabilizing near mid-60s and the Bank of Canada signaling patience amid weak but steady domestic data, the pair faces the risk of another leg lower toward 1.39 and possibly 1.38 if U.S. data underperforms.
Current Bias
Bearish – USDCAD is holding below key resistance at 1.4030, with price action suggesting a potential correction toward 1.3910 and 1.3810 in the short term.
Key Fundamental Drivers
Oil Recovery: Crude oil has rebounded from recent lows, supporting the Canadian dollar and easing upward pressure on USD/CAD.
Divergent Central Bank Tone: The Fed remains cautious on cuts, while the BoC maintains a “wait and assess” stance, reflecting a balanced policy gap that limits upside for USD/CAD.
Data Softness: Canada’s growth data remains sluggish, but labor market strength offsets deeper pessimism. Meanwhile, U.S. consumer and manufacturing resilience keeps USD demand steady.
Yield Differentials: Modest narrowing between U.S. and Canadian yields favors mild CAD appreciation if risk sentiment holds stable.
Macro Context
U.S. economy continues to show solid momentum, though some leading indicators are flattening. Fed officials, including Logan and Schmid, have signaled that rates are restrictive enough but still not ready for aggressive cuts.
In Canada, Q2 GDP showed contraction, but employment and wage data suggest the downturn is shallow. The BoC remains cautious, preferring stability over immediate easing. Oil’s moderate rebound and stable export demand provide underlying CAD support.
Globally, energy market stabilization and China’s steady PMI data are limiting risk-off flows, reducing USD’s haven premium.
Primary Risk to the Trend
A sudden decline in oil prices or a hawkish shift from the Fed could reignite USD strength and push USD/CAD back toward 1.41+. Conversely, an unexpected BoC hawkish tone or strong Canadian employment data could accelerate the downside.
Most Critical Upcoming News/Event
U.S. ISM Manufacturing and Services PMI
U.S. Non-Farm Payrolls and CPI data
Canada Employment Report and Ivey PMI
BoC’s Business Outlook Survey
Leader/Lagger Dynamics
USD/CAD typically acts as a lagger to broader USD trends but a leader among commodity-linked currencies (AUD/CAD, NZD/CAD). Oil and Treasury yield moves drive its direction, while DXY strength or weakness sets the overall bias.
Key Levels
Support Levels: 1.3910, 1.3810
Resistance Levels: 1.4030, 1.4080
Stop Loss (SL): 1.4070 (above structural resistance)
Take Profit (TP): 1.3810 (lower support confluence)
Summary: Bias and Watchpoints
USDCAD carries a bearish bias as short-term momentum fades below 1.4030. The combination of firmer oil prices, a steady BoC stance, and a cooling dollar backdrop sets the stage for a pullback toward 1.3910 and potentially 1.3810. Traders should watch for confirmation from upcoming U.S. ISM and jobs data, which could either reinforce the correction or restore USD dominance. A stop above 1.4070 helps protect against sudden yield-driven spikes, while 1.3810 remains the key target zone aligned with both technical structure and the evolving macro narrative.

USD/CAD) Bullish trend analysis Read The captionSMC Trading point update
Technical analysis of USD/CAD on the 4H t
Overall Concept
The analysis suggests a retracement entry before a continuation to the upside.
The market is currently bullish, respecting higher highs and higher lows.
The analyst expects a pullback into a discount zone (Fibonacci retracement) before a move toward the target point at 1.41464.
---
Technical Breakdown
1. Trend Context
Price is trading above both the 50 EMA (1.40120) and 200 EMA (1.39622) → confirming bullish momentum.
The strong impulsive bullish candles indicate institutional buying.
2. Key Levels
Current Price: 1.40843
Retracement Zone (Potential Buy Area): Between the 0.62–0.79 Fibonacci retracement levels (≈1.4060–1.4040).
Target Point: 1.41464
3. Fibonacci Tool
The retracement tool is drawn from the most recent swing low to swing high.
The blue shaded zone marks the discount entry zone, ideal for smart money re-entry after a short pullback.
4. Expected Move
Scenario: Price retraces to the 0.62–0.79 zone (liquidity sweep or mitigation of demand)
Then: A bullish continuation toward 1.4146 target level, which aligns with previous liquidity or imbalance area.
5. Volume & Confirmation
Volume is moderate (14.73K), supporting a healthy bullish push after correction.
Candlestick structure shows strong bullish impulses with minor pullbacks → confirming buyer control.
---
Trade Idea Summary
Bias: Bullish
Entry Zone: 1.4060 – 1.4040 (Fibonacci discount zone)
Stop Loss: Below 1.4020 (beneath previous structure)
Target: 1.4146
Risk-to-Reward (RR): Approximately 1:3 or better
Mr SMC Trading point
---
Confirmation to Watch
Bullish rejection candle or engulfing pattern within the blue zone
EMA 50 holding as dynamic support
Possible equal highs liquidity sweep near 1.4146 as the final take-profit zone
Please support boost 🚀 this analysis
