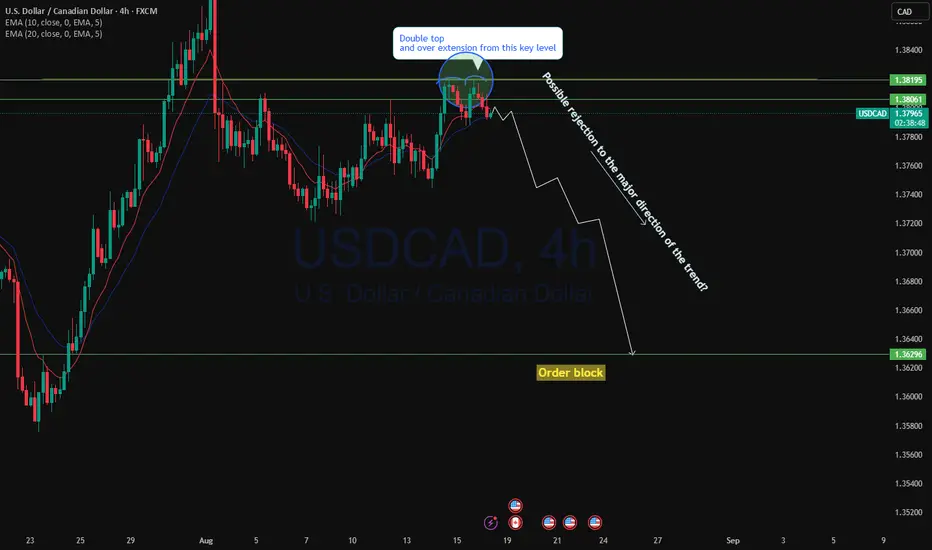
USDCAD set to drop to order block?USDCAD currently showing potential rejection upon testing the resistance 4h timeframe. There is one single move to the upside tested this key level and formed a doble top. The major direction of the trend is down and there is high potential for this market to drop to order block to test that level.
Usdcadforecast
USD/CAD) Bearish Trend Read The captionSMC Trading point update
Technical analysis of USD/CAD on the 4H timeframe, using Smart Money Concepts (SMC).
---
🔍 Technical Breakdown – USD/CAD (4H)
1. FVG (Fair Value Gap) / Supply Zone
Price is currently trading inside a supply/FVG zone (highlighted in yellow at the top).
Market is reacting to this imbalance area where institutional selling pressure is expected.
2. BOS (Break of Structure)
Earlier, price made a Break of Structure (BOS) on the downside, confirming a bearish shift in market structure.
The current bullish retracement into the supply zone is likely just a pullback before continuation down.
3. Bearish Rejection Expected
From the chart, price is anticipated to reject from the supply zone and start a bearish move.
Projection shows a strong drop toward the target support zone (SSS).
4. Target Point
Final downside target is marked at 1.35847, aligning with the Sell-Side Liquidity (SSL) / Support zone (SSS).
This zone is a strong liquidity pool where price may hunt stop losses before reversing.
---
Summary
Bias: Bearish
Current Price: 1.38147
Supply Zone (FVG): 1.3800 – 1.3850 (reaction expected)
Target Zone (SSS): 1.35847
Setup: Look for short entries inside supply zone with confirmation.
Mr SMC Trading point
This is a classic SMC setup: BOS Pullback to FVG Liquidity hunt Target
Please support boost 🚀 this analysis)

USDCAD - Longshort-term pullback before it resumes its upward momentum. My bias remains bullish as long as price holds above key support, with the next major target being the supply zone around 1.3870.
USDCAD Bullish Outlook: Watching for a Pullback📊 I’m reviewing USDCAD and see that it has made a bullish break of structure on the daily timeframe 📈. My outlook stays bullish, though price is currently extended after the recent move. I’ll be looking for a retracement into key fibo and imbalance areas and a bullish BoS to confirm a potential long entry 🔍💡🚀 (not financial advice).

USDCAD Prepaing to Gilde Down ??USDCAD has been struglling to move up, All the monthly and Bi-Monthly analysis show down including D1. Check your support and resistances and open positions accordingly. Wait for Price Again to preform and see the strong breakouts.
Disclaimer:
The content presented in this IMAGE is intended solely for educational and informational purposes. It does not constitute financial, investment, or trading advice.
Trading foreign exchange (Forex) on margin involves a high level of risk and may not be suitable for all investors. The use of leverage can work both for and against you. Before deciding to participate in the Forex market, you should carefully consider your investment objectives, level of experience, and risk tolerance.
There is a possibility that you may incur a loss of some or all of your initial investment, and therefore, you should not invest money that you cannot afford to lose. Be fully aware of all the risks associated with foreign exchange trading, and seek advice from a licensed and independent financial advisor if you have any doubts.
Past performance is not indicative of future results. Always trade responsibly.

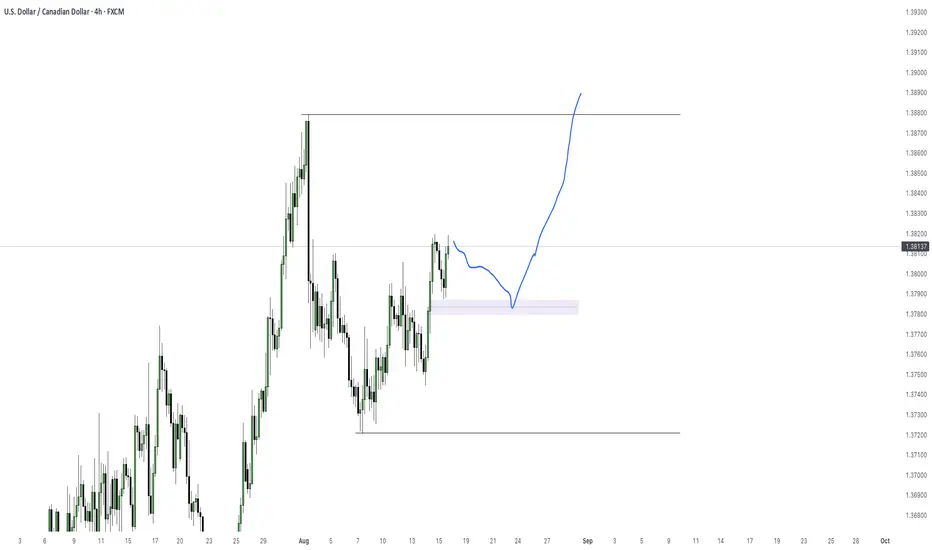
USDCAD drop to order block?Hello traders, this is a complete multiple timeframe analysis of this pair. We see could find significant trading opportunities as per analysis upon price action confirmation we may take this trade. Smash the like button if you find value in this analysis and drop a comment if you have any questions or let me know which pair to cover in my next analysis.

USDCAD(20250808)Today's AnalysisMarket News:
① Trump nominated Stephen Milan, Chairman of the White House Council of Economic Advisers, to serve on the Federal Reserve Board, with a term ending January 31, 2026.
② Waller is reportedly a leading candidate for the next Fed Chair.
③ U.S. Treasury Secretary Bensont stated that the interview process for the Fed Chair has begun.
④ Bostic stated that the July jobs report did change the Fed's outlook on its employment goals.
Technical Analysis:
Today's Buy/Sell Levels:
1.3746
Support and Resistance Levels:
1.3798
1.3778
1.3766
1.3726
1.3713
1.3694
Trading Strategy:
If the price breaks above 1.3746, consider a buy entry, with the first target price being 1.3766. If the price breaks below 1.3726, consider a sell entry, with the first target price being 1.3713.

USD/CAD(20250806)Today's AnalysisMarket News:
The US non-manufacturing PMI fell to 50.1 in July from 50.8 in June, below the expected 51.5. The ISM New Orders Index fell to 50.3 in July from 51.3 in June, with export orders contracting for the fourth time in five months.
Technical Analysis:
Today's Buy/Sell Levels:
1.3781
Support and Resistance Levels:
1.3828
1.3810
1.3799
1.3763
1.3751
1.3734
Trading Strategy:
On a breakout above 1.3781, consider a buy entry, with the first target at 1.3799. On a breakout above 1.3763, consider a sell entry, with the first target at 1.3751.

USD CAD Where Are We Heading DEEP ANALYSIS Hi Trading Fam
So with USD CAD this is what we are seeing:
Bearish:
If we stay under 1.38 then a drop down to the 1.37 range
Bullish:
If we can close above the high at 1.38 then we have levels of 1.3840 , and 1.3980 that could be hit
Trade Smarter Live Better
Kris

Watching Retracement Levels for Potential USDCAD Entry📈 The USDCAD remains firmly in a bullish trend following a sharp pullback on the 4-hour timeframe. Price continues to print higher highs and higher lows, showing sustained upward momentum. I’m watching for a retracement back into equilibrium of the previous price swing — if price dips and then breaks structure to the upside, I’ll be eyeing a potential long entry 🔍📊 (not financial advice).

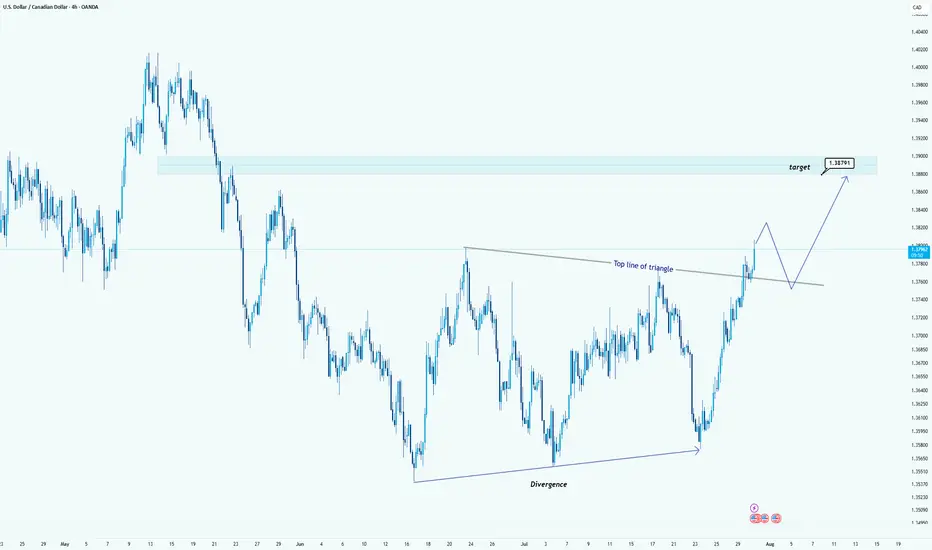
USD/CAD Breaks Triangle: Bullish Target in SightHello guys!
USD/CAD has broken out of a clear triangle formation, signaling strong bullish momentum. The breakout above the top line of the triangle, supported by earlier bullish divergence, confirms that buyers are now in control.
Triangle breakout confirmed
Strong bullish impulse post-breakout
Retest of the broken trendline expected
Target: 1.38791
A clean retest of the breakout level could provide another entry opportunity before price reaches the target zone highlighted in blue.
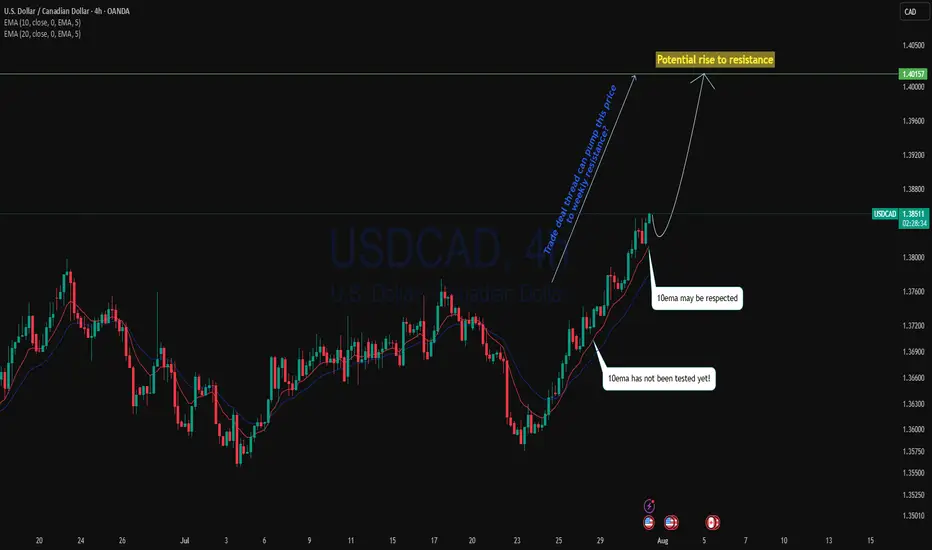
Trade deal thread could pump USDCAD?USDCAD as with the bounce off the monthly support level, current is a strong uptrend.4H perspective, price is trading above 10ema since the cross over of 20ema and 10ema price is pushing back to the upside. With trade deal thread, including upcoming GDP on CAD could pump this price back to the resistance ?
As 10ema has not been tested since cross over, we may see the price to back to the upside with respecting the 10ema.
Buying on EMA is a high probability trade setup.
Uptrend is coming. Opportunity for buyers✏️ OANDA:USDCAD is trading close to the upper boundary of the triangle pattern. There is a high possibility that the current bullish momentum will break the upper boundary and form an uptrend for the USDCAD pair. The important price zone for the sellers at the moment is 1.075. If the buyers are strong enough to push the price above 1.075, the sellers will only be really interested in the price zone of 1.340, the high of the pair in May.
📉 Key Levels
Buy trigger: Reject and Trading above 1.365
BUY DCA Break 1.375
Target: 1.400
Leave your comments on the idea. I am happy to read your views.

USD/ CAD Are We Heading to $1.46 Territory Watch OUT Afternoon Trading Family
Based on what we are seeing is a nice bullish run up to the following levels :
Levels To Watch For:
1) $1.39
2) $1.41
3) $1.43
4) $1.46
However be aware if we for whatever reason we sink back into the 1.35 territory then we could see a drop down to 1.34
Trade Smarter Live Better
Kris

USDCAD Bullish Breakout!
HI,Traders !
#USDCAD was trading in a
Falling wedge pattern
But now we are seeing a
Bullish breakout so we
Will be expecting a
Further bullish move up !
Comment and subscribe to help us grow !

USD/CAD(20250730)Today's AnalysisMarket News:
According to a Reuters/Ipsos poll, Trump's approval rating has fallen to 40%, the lowest level since his second term.
Technical Analysis:
Today's Buy/Sell Levels:
1.3762
Support and Resistance Levels:
1.3820
1.3798
1.3784
1.3739
1.3725
1.3704
Trading Strategy:
If the price breaks above 1.3784, consider a buy entry, with the first target price at 1.3798. If the price breaks below 1.3762, consider a sell entry, with the first target price at 1.3739.

USDCAD: a long positionHello guys.
Divergence:
A bullish RSI divergence is noted, price made lower lows while RSI formed higher lows, signaling a potential bullish reversal.
Price Action:
Price has bounced strongly from around the 1.3570–1.3580 zone and is now approaching a descending trendline resistance.
Trade Setup:
Entry: 1.3718
Stop Loss: Below the breakout candle, near 1.3686
Take Profit: Around 1.3782
Risk-to-Reward: 1:3

USD/CAD Institutional Buy Zone – Thief Trading Alert!🔥 USD/CAD "LOONIE BANK HEIST" 🔥 – THIEF TRADING STYLE (BULLISH SNIPER PLAN)
💸 ATTENTION: Market Robbers & Profit Pirates!
"Steal Like a Pro – Escape Before the Cops Arrive!"
🎯 MASTER TRADE PLAN (Based on Thief Trading Tactics):
Entry Zone (Pullback Heist):
📌 Pullback-1: Market Maker Trap Zone (1.35400+) – Wait for retest!
📌 Pullback-2: Institutional Buy Zone (1.33500+) – Confirm bullish momentum!
"Patience = Perfect Heist Timing. Don’t rush—ambush the trend!"
🎯 Profit Target: 1.38100 (or escape earlier if momentum fades).
🛑 Stop Loss (Escape Route): Nearest 4H Swing Low (wick/close) – Adjust based on risk & lot size!
🚨 SCALPERS’ WARNING:
"Only snipe LONG! Big pockets? Strike now. Small stack? Join swing robbers & trail your SL!"
📉 WHY THIS HEIST? (Bullish Triggers):
Technical + Fundamental alignment (COT, Macro, Sentiment).
Overbought but institutional demand holding strong.
"Bears are trapped—time to rob their stops!"
⚠️ CRITICAL ALERT:
News = Volatility = Police Ambush!
Avoid new trades during high-impact news.
Trailing SL = Your Getaway Car! Lock profits before reversals.
💥 BOOST THIS HEIST!
"Hit 👍, 🔔 Follow, and 🚀 Boost to fuel our next robbery! Let’s drain the banks together!"
🔮 NEXT HEIST COMING SOON… Stay tuned, partner! 🎭💰

USD/CAD(20250725)Today's AnalysisMarket news:
The European Central Bank announced that it would maintain the three key interest rates unchanged, reiterated data dependence, warned that the external environment is highly uncertain, and President Lagarde did not rule out the possibility of future rate hikes. Traders reduced their bets on ECB rate cuts.
Technical analysis:
Today's buying and selling boundaries:
1.3626
Support and resistance levels:
1.3689
1.3666
1.3651
1.3602
1.3587
1.3563
Trading strategy:
If the price breaks through 1.3651, consider buying, with the first target price of 1.3666
If the price breaks through 1.3626, consider selling, with the first target price of 1.3602

USDCAD Bearish Breakout!
HI,Traders !
#USDCAD was trading along
The rising support line but
Now we are seeing a bearish
Breakout so we are bearish
Biased and we will be expecting
A further bearish move down !
Comment and subscribe to help us grow !

USDCAD(20250721)Today's AnalysisMarket news:
Waller refused to comment on whether he would dissent at the July meeting, saying that the private sector was not performing as well as people thought, and said that if the president asked him to be the chairman of the Federal Reserve, he would agree.
Technical analysis:
Today's buying and selling boundaries:
1.3725
Support and resistance levels:
1.3785
1.3763
1.3748
1.3702
1.3687
1.3665
Trading strategy:
If the price breaks through 1.3725, consider buying, and the first target price is 1.3748
If the price breaks through 1.3702, consider selling, and the first target price is 1.3687

Market Analysis: USD/CAD Consolidates GainsMarket Analysis: USD/CAD Consolidates Gains
USD/CAD declined and now consolidates below the 1.3750 level.
Important Takeaways for USD/CAD Analysis Today
- USD/CAD started a fresh decline after it failed to clear the 1.3775 resistance.
- There is a key bullish trend line forming with support at 1.3715 on the hourly chart at FXOpen.
USD/CAD Technical Analysis
On the hourly chart of USD/CAD at FXOpen, the pair climbed toward the 1.3775 resistance zone before the bears appeared. The US Dollar formed a swing high near 1.3774 and recently declined below the 1.3750 support against the Canadian Dollar.
There was also a close below the 50-hour simple moving average and 1.3735. The pair is now consolidating losses below the 50% Fib retracement level of the downward move from the 1.3774 swing high to the 1.3695 low. But the bulls are active near the 1.3700 level.
If there is a fresh increase, the pair could face resistance near the 1.3735 level. The next key resistance on the USD/CAD chart is near the 1.3755 level or the 61.8% Fib retracement level.
If there is an upside break above 1.3755, the pair could rise toward 1.3775. The next major resistance is near the 1.3800 zone, above which it could rise steadily toward 1.3880.
Immediate support is near the 1.3715 level and a key bullish trend line. The first major support is near 1.3675. A close below the 1.3675 level might trigger a strong decline. In the stated case, USD/CAD might test 1.3650. Any more losses may possibly open the doors for a drop toward the 1.3620 support.
This article represents the opinion of the Companies operating under the FXOpen brand only. It is not to be construed as an offer, solicitation, or recommendation with respect to products and services provided by the Companies operating under the FXOpen brand, nor is it to be considered financial advice.

USD/CAD) strong bullish trend Read The captionSMC trading point update
Technical analysis of USD/CAD (U.S. Dollar vs Canadian Dollar) on the daily timeframe. Here's a breakdown of the trade
---
Technical Breakdown:
1. Breakout from Descending Channel:
Price has broken out above a descending trend channel (marked with black lines).
This breakout suggests a potential trend reversal or at least a bullish correction phase.
2. Key Support Zone (Yellow Box):
The yellow zone marked as “support level” was a strong consolidation area.
Price has bounced off this zone multiple times, forming a solid base for further upside.
3. Bullish Price Action:
Price has closed above the previous resistance (now support), signaling bullish intent.
Current candle structure confirms strength with bullish continuation patterns.
4. RSI Indicator:
RSI is at 56.38, indicating bullish momentum without being overbought.
Suggests there is room for further upside before exhaustion.
---
Target Levels:
Target Point 1: 1.37968 (near-term resistance)
Target Point 2: 1.38615 (intermediate target)
Target Point 3: 1.39064–1.39090 (longer-term resistance near the 200 EMA)
Mr SMC Trading point
---
Trade Idea Summary:
Bias: Bullish
Entry Zone: Break and retest of the yellow support area (~1.368–1.371)
Target Zone: 1.379 – 1.390
Invalidation: Break below the yellow support zone
Confluence: RSI strength + breakout of downtrend channel + structural support
plesse support boost 🚀 this analysis)
