USD/CAD Closing in on Breakout! Will Bulls Take Control?🔥 USD/CAD "THE LOONIE": Bullish Breakout Play (Swing Trade Setup) | Layer Entry Strategy 🚀
TradingView Description:
🎯 TRADE IDEA: BULLISH SWING ON USD/CAD
🏆 Plan & Thesis:
The Loonie is approaching a critical juncture! 🧐 We are stalking a potential bullish breakout above the strong resistance zone at 1.41400. Our plan is to patiently wait for a confirmed breakout and momentum shift, signaling the next leg up. This is a swing trade opportunity targeting a key resistance area.
⚡ Why This Setup?
Key Resistance Break: A decisive break above 1.41400 indicates buyer strength overpowering sellers.
Trend Continuation: Aligns with the broader bullish structure on the higher timeframes.
Low-Risk, High-Reward Entry: Using the "Thief" layer strategy to optimize our average entry price.
📈 Trade Execution Details:
🎯 Entry Strategy (The "Thief" Layer Method): 🤑
We do not chase the price! We use a strategic layer of Buy Limit orders to enter on any retracement after the breakout is confirmed.
Layer 1: 1.41200
Layer 2: 1.41000
Layer 3: 1.40800
Layer 4: 1.40600
👉 You can adjust the number of layers and levels based on your capital and risk appetite.
🛑 Stop Loss (RISK MANAGEMENT):
A consolidated stop loss is placed below all entry layers at 1.40400.
⚠️ Disclaimer: This is MY stop loss. Please adjust your position size and SL based on YOUR personal risk management strategy. Protect your capital!
🎯 Take Profit Target:
Our primary profit target is set at 1.42100, a zone of strong historical resistance where we anticipate a pullback or overbought conditions.
💡 Pro Tip: Consider taking partial profits on the way up and moving your stop loss to breakeven to secure risk-free trades!
🌐 Market Context & Correlated Pairs to Watch:
Understanding correlations is key to validating this thesis! Keep an eye on these:
OANDA:USDCAD & PEPPERSTONE:USDX (DXY): 👑 DIRECT CORRELATION. A stronger US Dollar Index typically boosts USD/CAD. Watch for DXY strength to confirm our bullish bias.
OANDA:USDCAD & GETTEX:WTIC (Crude Oil): 👑 INVERSE CORRELATION. Canada is a major oil exporter. If Oil prices fall, CAD often weakens, pushing USD/CAD higher (bullish for our trade).
FX:EURUSD & FX:GBPUSD : These major pairs often move inversely to the USD. If they are falling, it can signal broad USD strength, supporting our USD/CAD long.
✅ Key Takeaways:
✅ Wait for a confirmed breakout and close above 1.41400.
✅ Execute entries using the layer method for best average price.
✅ MANAGE YOUR RISK! This is not financial advice. Your risk, your rules.
✅ Watch correlated pairs ( TVC:DXY , TVC:XAU , GETTEX:WTIC ) for confluence.
👑 Let's get this bread, traders! If you found this idea helpful, please give it a LIKE 👍, SHARE it with a fellow trader, and FOLLOW me for more high-quality setups! Your support helps the community grow! 💬 Drop a comment below with your thoughts!
Usdcadtrade

USDCAD Short Ideathis pair has formed an ascending channel on H1 timeframe
now we're waiting for a momentum candle to close below the last touch of the channel so we can enter a sell trade
Follow us for more idea or trades

USDCAD Bearish Breakout!
HI,Traders !
#USDCAD made a bearish
Breakout of the key
Horizontal level of 1.37376
And the breakout is confirmed
So we are bearish biased and
We will be expecting a
Further bearish continuation !
Comment and subscribe to help us grow !

USDCAD Bearish Trend Continuation From Marked ResistancesH4 - Bearish Trend in play
Two Solid Resistance Levels
Trend continuation very likely after pullback.

Smart Money Levels on USD/CAD – What’s Next for the Loonie?“USD/CAD – The LOONIE Profit Playbook (Swing/Day Trade) 🚀💰”
📋 Description:
Dear Ladies & Gentleman (Thief OG’s),
Here’s the plan for our favourite cross, USD/CAD – “The Loonie”:
Plan: Bullish bias (with a setup for a potential bearish flip if you like to dance with the other side)
Entry (Bullish):
Pullback-1: 1.39400
Pullback-2: 1.39000
Enter at a dip into one of those levels, let the market breathe, then ride the wave.
Stop Loss:
This is Thief SL at 1.38800 — place your stop after the pullback level you used.
Target (Bullish):
Our target zone: 1.41000 — watch for strong resistance, overbought signals & a possible trap. Escape with profit when you see the signs.
Entry (Bearish):
If you prefer the short side: you may enter anywhere, but keep sharp eyes on pullback zones and the target levels below.
Bearish Targets: 1.39400 & 1.39000
🔍 More to watch – Related Pairs & Correlations:
OANDA:USDCHF (often moves inversely with USD/CAD)
OANDA:AUDUSD (commodity-linked crosses, relevant when commodities shift)
OANDA:CADJPY (Canadian dollar strength/weakness can show up across CAD pairs)
Watch how CAD strength or USD strength flows across pairs. When CAD weakens, USD/CAD rises — when CAD strengthens, USD/CAD dips.
⚠️ Note:
Dear Ladies & Gentleman (Thief OG’s), I am not recommending you set only my stop-loss or take-profit rules. It’s your own choice — make money, then take money — at your own risk.
✨ Footer:
“If you find value in my analysis, a 👍 and 🚀 boost is much appreciated — it helps me share more setups with the community!”
📌 Disclaimer:
This is Thief style trading strategy just for fun.
#USDCAD #Forex #SwingTrade #DayTrade #Loonie #ForexSetup #ThiefTrader #TradingViewIdeas #ForexAnalysis #CurrencyPairs

USD/CAD Recovers From a 2.5-Month LowUSD/CAD Recovers From a 2.5-Month Low
The main driver of the decline was a sharp shift in sentiment and diverging expectations for policy actions in the United States and Canada.
→ Canada: Friday’s employment data came in far stronger than forecast. As a result, traders sharply reduced the likelihood of a Bank of Canada rate cut at the next meeting, judging the economy resilient enough to pause its easing cycle.
→ United States: Markets are pricing in a high probability of a Federal Reserve rate cut at tomorrow’s meeting (22:00 GMT+3).
This contrast pushed USD/CAD to a 2.5-month low. However, the chart shows that the bulls may still have some grounds for optimism.
USD/CAD Technical Analysis
On 1 December we analysed the USD/CAD chart and:
→ drew an ascending channel (shown in blue) and noted several bearish signals;
→ suggested that the 1.4000 level would act as resistance in the near term, with bears likely to attempt to resume the downward move in USD/CAD.
Indeed, as the arrow indicates, the bears managed to restart the downtrend, which led to:
→ a breakout below the lower boundary of the channel;
→ the need to map out a descending trajectory (shown in red), with its median potentially acting as resistance going forward.
In this context, it is reasonable to assume that the bulls have some cause for hope in the short term, as:
→ the price is rebounding from the lower boundary of the red channel, indicating demand;
→ the RSI has risen from extreme oversold levels;
→ the candle highlighted by the second arrow looks bullish – it closed near the top of its range, forming a long lower shadow.
Given the above, traders should not rule out a corrective recovery in USD/CAD until the Federal Reserve releases its decision, which could significantly impact financial markets.
This article represents the opinion of the Companies operating under the FXOpen brand only. It is not to be construed as an offer, solicitation, or recommendation with respect to products and services provided by the Companies operating under the FXOpen brand, nor is it to be considered financial advice.

USDCAD Will Keep Falling!
HI,Traders !
#USDCAD is trading in a
Downtrend and the pair made
A retest of the horizontal
Resistance of 1.39769 from where
We are already seeing a bearish
Move down so we will be
Expecting a further
Bearish move down !
Comment and subscribe to help us grow !

USDCAD Resistance Ahead!
HI,Traders !
#USDCAD keeps going up
And the pair is locally oversold
So after it hits the horizontal
Resistance of 1.40666 we
Will be expecting a local
Bearish correction !
Comment and subscribe to help us grow !

USD/CAD Declines Amid a Flurry of Market NewsUSD/CAD Declines Amid a Flurry of Market News
The Canadian dollar strengthened against the U.S. dollar today, pushing USD/CAD down to 1.39750 – a level that acted as resistance in early October but has since turned into support.
The pair’s fluctuations come amid a busy news backdrop. On Friday:
→ President Trump announced the suspension of trade talks with Canada, reportedly due to his dissatisfaction with Canadian advertising campaigns using Ronald Reagan’s image to criticise tariffs.
→ The CPI report came in weaker than expected. According to Forex Factory, U.S. annual inflation stood at 3.0%, compared with the 3.1% forecast by analysts.
This week could bring heightened volatility as markets await two key rate decisions on Wednesday:
→ At 16:45 GMT+3, the Bank of Canada is expected to cut its policy rate from 2.50% to 2.25%;
→ At 21:00 GMT+3, the Federal Reserve is forecast to lower the Federal Funds Rate from 4.25% to 4.0%.
Both announcements will be accompanied by policy statements that could significantly influence USD/CAD price action.
Technical Analysis: USD/CAD Chart
Last month’s analysis highlighted two key structures:
→ A red long-term descending channel originating in early February;
→ A blue ascending channel formed by price swings since mid-summer.
Since then:
→ Bulls managed to break above the red channel’s upper boundary;
→ The price consolidated around the median line of the blue channel in early October.
From a bearish perspective:
→ The price failed to hold above the psychological level of 1.4000;
→ A sequence of lower highs forms a descending trendline.
From a bullish perspective:
→ The blue channel remains intact;
→ 1.39750 serves as support;
→ An additional support zone lies just below, near the breakout point of the red channel where buying pressure was previously strong.
Given these factors, the red trendline may represent a corrective pattern within the broader bullish structure. Whether buyers can resume the uptrend successfully will largely depend on the upcoming central bank decisions and any further statements from President Trump.
This article represents the opinion of the Companies operating under the FXOpen brand only. It is not to be construed as an offer, solicitation, or recommendation with respect to products and services provided by the Companies operating under the FXOpen brand, nor is it to be considered financial advice.

Trading Map for USD/CAD — Bullish Layered Entry Strategy🦒 The Loonie Heist: USD/CAD Swing & Day Trade Wealth Map 🚀
Asset: USD/CAD ("The Loonie")
Outlook: Bullish 📈
Vibe: Thief-Style Layering Strategy — Sneaky, Smart, and Stylish 😎
Welcome, Ladies and Gentlemen, to the Loonie Heist! This USD/CAD trading plan is designed for the crafty traders out there — our Thief OG's — ready to layer up entries and snatch profits like pros. Let’s break down this stylish, rule-compliant TradingView idea that’s ready to steal the spotlight! ✨
📜 The Plan: Bullish Breakout with a Thief’s Precision 🕵️♂️
Strategy: Thief Layering — A multi-limit order approach for smooth, calculated entries.
Entry Levels: Deploy your buy limit orders like a mastermind at:
1.39300
1.39400
1.39500
1.39600
Pro Tip: Feel free to add more layers based on your risk appetite — scale it up, Thief OG style!
Stop Loss (SL): Set a sneaky SL at 1.39000 to guard your loot.
Note: This is my suggested SL, but you’re the boss of your trades — adjust to your risk tolerance! ⚠️
Take Profit (TP): Aim for 1.40500, just shy of the 1.40600 police barricade (a strong resistance zone with overbought signals and potential traps). Lock in profits and escape like a pro! 🏃♂️ Note: TP is your call — take the money when it feels right!
🔍 Why USD/CAD? Key Market Insights 🧠
Market Context: USD/CAD is riding a bullish wave, driven by USD strength and CAD’s sensitivity to oil prices. Keep an eye on macroeconomic data like US Non-Farm Payrolls and Canadian employment reports, as they can sway the Loonie! 📊
Technical Setup: The pair is testing key support levels around 1.39300–1.39600, making it a prime spot for layered entries. The 1.40600 resistance is a historical hurdle, so watch for price action there! 🚨
Thief’s Edge: By layering buy limits, you’re stacking the odds in your favor, catching dips and riding the trend with finesse.
💰 Related Pairs to Watch 👀
Keep these correlated pairs on your radar to spot opportunities and confirm trends:
OANDA:USDCHF ($): Positive correlation with USD/CAD due to USD strength. If USD/CHF is climbing, it could signal more upside for USD/CAD.
OANDA:AUDUSD ($): Negative correlation with USD/CAD. A falling AUD/USD (stronger USD) often aligns with USD/CAD bullish moves.
OANDA:NZDUSD ($): Similar to AUD/USD, this pair’s weakness can support USD/CAD’s bullish case.
Key Point: Watch oil prices (WTI, Brent) since CAD is a commodity currency. If oil weakens, USD/CAD may push higher! 🛢️
⚠️ Risk Management (Thief’s Code) 🛡️
Risk Disclaimer: Trading is a high-stakes game, and this Thief-Style Strategy is for fun and educational purposes. Always manage your risk, set your own SL/TP, and trade responsibly. Don’t chase the market — let it come to you!
Position Sizing: Adjust your lot sizes based on your account and risk tolerance. The Thief OG never risks the whole vault! 💸
✨ “If you find value in my analysis, a 👍 and 🚀 boost is much appreciated — it helps me share more setups with the community!”
Disclaimer: This is a Thief-Style Trading Strategy crafted for fun and educational purposes. Trade at your own risk, and always conduct your own analysis.
#Hashtags: #USDCAD #Forex #SwingTrading #DayTrading #ThiefStrategy #LoonieHeist #Bullish #TradingView
USDCAD Bullish Setup | Wait for Break of Structure ConfirmationUSDCAD continues to trend bullish on the higher timeframe 💪. Recently, we’ve seen a healthy retracement, which could provide the groundwork for a potential trend continuation setup.
🔎 On the 30-minute chart, I’m watching closely for a bullish break of market structure followed by a retest of the current range. If that plays out, it could present a solid buy opportunity aligned with the higher-timeframe trend 📈.
⚖️ However, if price fails to break structure and confirm the setup, there’s no trade — patience is key here. We simply wait for the market to show its hand before acting.
⚠️ Disclaimer: This analysis is for educational purposes only and not financial advice.

USD/CAD Maintains Bullish ConsolidationUSD/CAD Maintains Bullish Consolidation
USD/CAD is showing positive signs and might aim for more gains above 1.3960.
Important Takeaways for USD/CAD Analysis Today
- USD/CAD rallied above 1.3880 and 1.3920 before the bears appeared.
- There is a connecting bullish trend line forming with support at 1.3915 on the hourly chart.
USD/CAD Technical Analysis
On the hourly chart of USD/CAD, the pair formed a strong support base above the 1.3770 level. The US Dollar started a fresh increase above 1.3820 against the Canadian Dollar.
The pair cleared the 50-hour simple moving average and climbed above 1.3900. Finally, it tested the 1.3960 zone before the bears appeared. The pair traded below 1.3940 and the 50-hour simple moving average.
Initial support is near a connecting bullish trend line at 1.3915. It coincides with the 23.6% Fib retracement level of the upward move from the 1.3768 swing low to the 1.3958 high.
A downside break below the trend line might send the pair toward 1.3885. The next major area on the same USD/CAD chart could be the 50% Fib retracement at 1.3865. A close below 1.3865 could push the pair further lower. In the stated case, the bears might aim for a test of 1.3815.
On the upside, initial resistance sits near 1.3930 and the 50-hour simple moving average. The main breakout zone could be 1.3960. A clear upside break above 1.3960 could start another steady increase. The next major stop for the bulls might be 1.4000. Any more gains could open the doors for a test of 1.4050.
This article represents the opinion of the Companies operating under the FXOpen brand only. It is not to be construed as an offer, solicitation, or recommendation with respect to products and services provided by the Companies operating under the FXOpen brand, nor is it to be considered financial advice.

USDCAD Bearish Reversal Setup – Supply Zone + Rising Wedge Break1. Chart Pattern
A rising wedge/channel (highlighted in red) is clearly forming, which is typically a bearish reversal pattern.
The pair has reached the upper boundary of the wedge — a strong resistance area.
2. Supply Zone
Marked around the 1.3945 – 1.3981 area.
This is a potential reversal zone, where selling pressure may overpower buying interest.
The price has just entered this zone, indicating a possible short setup.
3. Trade Setup (Short Position)
Entry Point: 1.39431
Stop Loss: 1.39810 – 1.39815 (just above the supply zone)
Target Point: 1.36328
📉 Risk-to-Reward Ratio (RRR)
Risk: ~38 pips (1.3981 - 1.3943)
Reward: ~310 pips (1.3943 - 1.3632)
RRR: ~8:1 – this is an excellent reward-to-risk ratio, making the trade very attractive if the setup confirms.
4. Trend Context
The prior trend before the wedge was bearish.
The wedge appears to be a corrective move, which aligns with the idea of a continuation to the downside.
5. Bearish Confirmation Needed
Ideally, a bearish candlestick pattern (like a pin bar, engulfing, or evening star) inside the supply zone would provide confirmation before entering the short.
📊 Summary of Strategy
Component Value
Trade Direction Short
Entry Price 1.39431
Stop Loss 1.39810
Take Profit 1.36328
Risk/Reward ~1:8
Setup Type Supply Zone Reversal + Rising Wedge Breakout
✅ Pros
High RRR
Strong supply zone
Rising wedge at resistance
Price action supports reversal
⚠️ Risks
If price breaks above the supply zone, the setup becomes invalid
Wait for confirmation before entering (e.g., bearish candlestick pattern)

Double Blow for the USD/CAD MarketDouble Blow for the USD/CAD Market
Today, the USD/CAD market faces a “double blow” from central banks:
→ At 16:45 GMT+3, the Bank of Canada will announce its decision. The rate is expected to be cut from 2.75% to 2.50%.
→ At 21:00 GMT+3, the Federal Reserve will follow with its own rate announcement.
Both events will be accompanied by statements from the central bank chairmen on future outlooks, and the USD/CAD market is likely to experience heightened volatility today.
Technical Analysis of the USD/CAD Chart
When analysing the USD/CAD chart earlier this month, we noted the formation of a symmetrical narrowing triangle (a sign of balance between supply and demand), bounded by:
→ a long-term descending channel (red), which has been in place since early February;
→ a short-term channel (blue), shaped by price fluctuations since mid-summer.
At that time, we suggested that supply and demand forces would keep USD/CAD in a temporary state of equilibrium until today.
Since then:
→ the price has reversed sharply from the upper boundary of the triangle (marked with an arrow);
→ on the eve of key announcements, the pair is attempting to consolidate below the lower boundary, signalling bearish pressure (in other words, a shift in balance in favour of supply).
Key observations:
→ the aggressive nature of the September support breakout (S);
→ the decline towards the critical 1.3725 level, which has acted as support since August.
Given the above, we could assume that the market is leaning bearish. Today’s announcements could trigger a downward impulse in USD/CAD – in this context, the chart may be interpreted through:
→ a potential breakout of the bearish flag pattern (formed by the blue channel);
→ prospects for the resumption of the broader downtrend within the red channel.
This article represents the opinion of the Companies operating under the FXOpen brand only. It is not to be construed as an offer, solicitation, or recommendation with respect to products and services provided by the Companies operating under the FXOpen brand, nor is it to be considered financial advice.

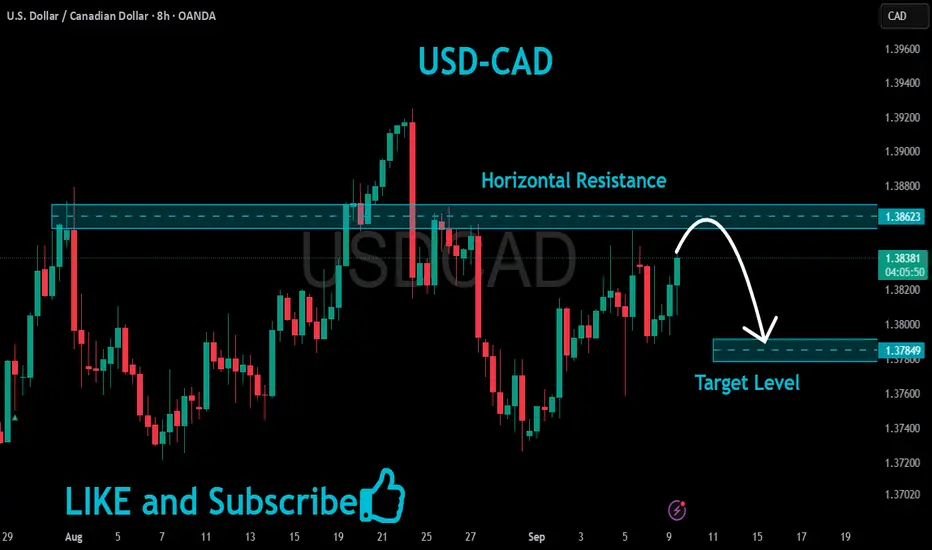
USDCAD Resistance Ahead!
HI,Traders !
#USDCAD is trading in an
Uptrend but the pair is locally
Overbought so after the pair
Hits the horizontal resistance
Level of 1.38623 we will be
Expecting a local bearish
Move down !
Comment and subscribe to help us grow !
USDCAD: Bullish For The Near Term?Welcome back to the Weekly Forex Forecast for the week of Sept 8 - 12th.
In this video, we will analyze the following FX market: USDCAD
Last Week I was looking for weakness in the USDCAD. It traded through the bearish FVG on the Daily, moving higher as the CAD turned out to be even weaker last week.
Look for this to continue for the upcoming week, as there is internal range liquidity (IRL) drawing price higher for a short term gains.
Enjoy!
May profits be upon you.
Leave any questions or comments in the comment section.
I appreciate any feedback from my viewers!
Like and/or subscribe if you want more accurate analysis.
Thank you so much!
Disclaimer:
I do not provide personal investment advice and I am not a qualified licensed investment advisor.
All information found here, including any ideas, opinions, views, predictions, forecasts, commentaries, suggestions, expressed or implied herein, are for informational, entertainment or educational purposes only and should not be construed as personal investment advice. While the information provided is believed to be accurate, it may include errors or inaccuracies.
I will not and cannot be held liable for any actions you take as a result of anything you read here.
Conduct your own due diligence, or consult a licensed financial advisor or broker before making any and all investment decisions. Any investments, trades, speculations, or decisions made on the basis of any information found on this channel, expressed or implied herein, are committed at your own risk, financial or otherwise.

Canadian Dollar Falls After Labour Market Data ReleaseCanadian Dollar Falls After Labour Market Data Release
On Friday, disappointing figures showed that in August the Canadian economy lost 65,500 jobs (the forecast had been for an increase of 10,000), while the unemployment rate rose to 7.1%. This is the highest level of unemployment since May 2016, excluding the pandemic period.
It is believed that:
→ the deterioration in the labour market (primarily in manufacturing) is a consequence of the trade war with the United States;
→ the fall in employment in Canada has increased the likelihood that the Bank of Canada will resume its monetary easing campaign.
As a result, the CAD weakened sharply against other currencies. However, the depreciation against the US dollar was less pronounced, as the USD itself is under pressure from various factors.
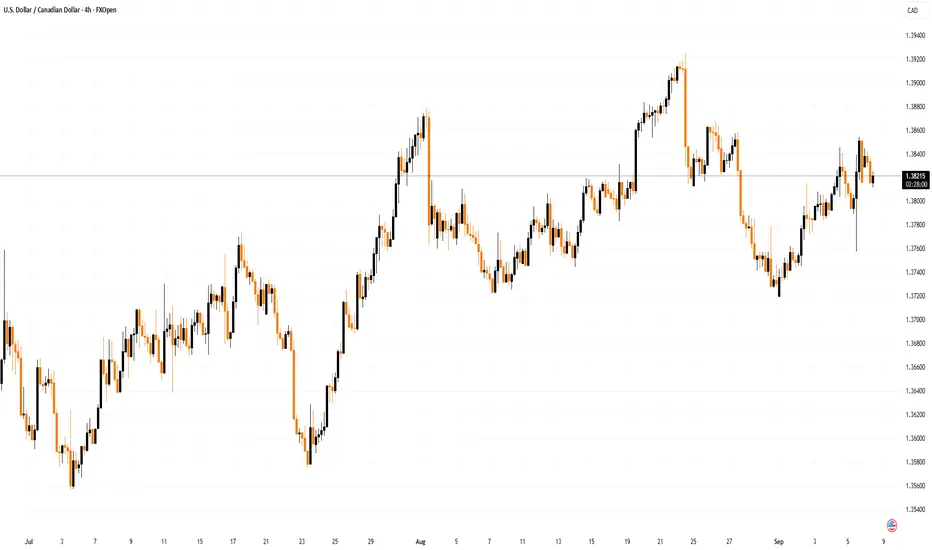
Technical Analysis of USD/CAD
From a long-term perspective, the USD/CAD pair remains within a downward trend, highlighted by a red descending channel.
From a medium-term perspective, since July the rate has risen from the 1.3550–1.3600 support zone, forming an ascending channel (shown in blue).
Price action (indicated by arrows) shows that:
→ sellers are aggressive, pushing the price down from the upper boundary of the red channel;
→ buyers are aggressive, driving the price up from the lower boundary of the blue channel. Its median line acts as resistance.
This is compressing USD/CAD fluctuations into a pattern resembling a symmetrical narrowing triangle (shown in black), with recent overbought (1) and oversold (2) conditions on the RSI marking price reversals back into the triangle from its boundaries.
Thus, we could assume that supply and demand forces will keep USD/CAD in a state of temporary balance while awaiting key news next week:
→ 16 September – Canada CPI report;
→ 17 September – interest rate decisions from both the Bank of Canada and the Federal Reserve.
This article represents the opinion of the Companies operating under the FXOpen brand only. It is not to be construed as an offer, solicitation, or recommendation with respect to products and services provided by the Companies operating under the FXOpen brand, nor is it to be considered financial advice.
USDCAD: Bearish. Buy The Dip?Welcome back to the Weekly Forex Forecast for the week of Sept 1 - 5th.
In this video, we will analyze the following FX market: USDCAD
Points of Interest:
- There are RELs (relative equal lows) at 1.3721 as a draw on liquidity
- Just underneath that, is a +FVG between 1.3716 and 1.3688.
I am looking for the reaction below those liquidity lows and the contact with the +FVG. If price presents a bullish CISD (market shift) only then will I entertain longs.
Shorts are best for now, as the HTFs are bearish.
Enjoy!
May profits be upon you.
Leave any questions or comments in the comment section.
I appreciate any feedback from my viewers!
Like and/or subscribe if you want more accurate analysis.
Thank you so much!
Disclaimer:
I do not provide personal investment advice and I am not a qualified licensed investment advisor.
All information found here, including any ideas, opinions, views, predictions, forecasts, commentaries, suggestions, expressed or implied herein, are for informational, entertainment or educational purposes only and should not be construed as personal investment advice. While the information provided is believed to be accurate, it may include errors or inaccuracies.
I will not and cannot be held liable for any actions you take as a result of anything you read here.
Conduct your own due diligence, or consult a licensed financial advisor or broker before making any and all investment decisions. Any investments, trades, speculations, or decisions made on the basis of any information found on this channel, expressed or implied herein, are committed at your own risk, financial or otherwise.

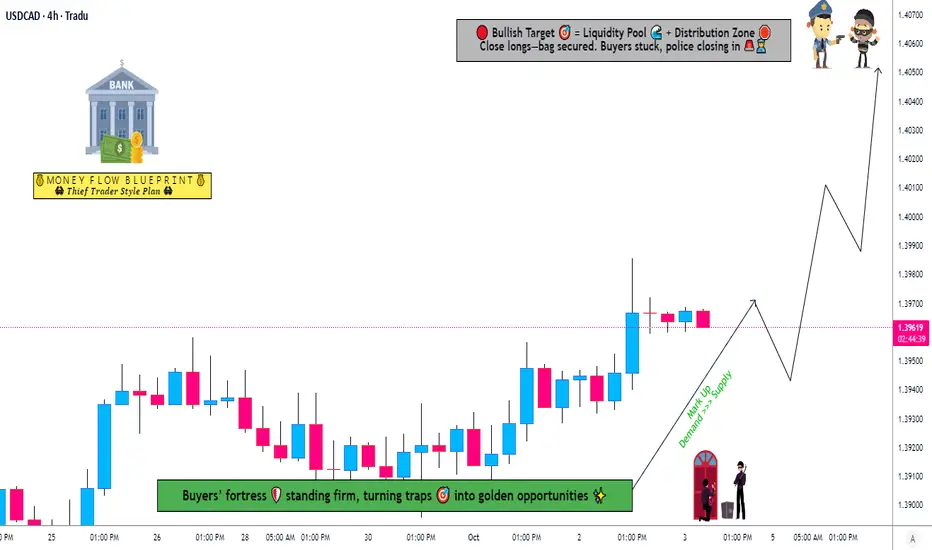
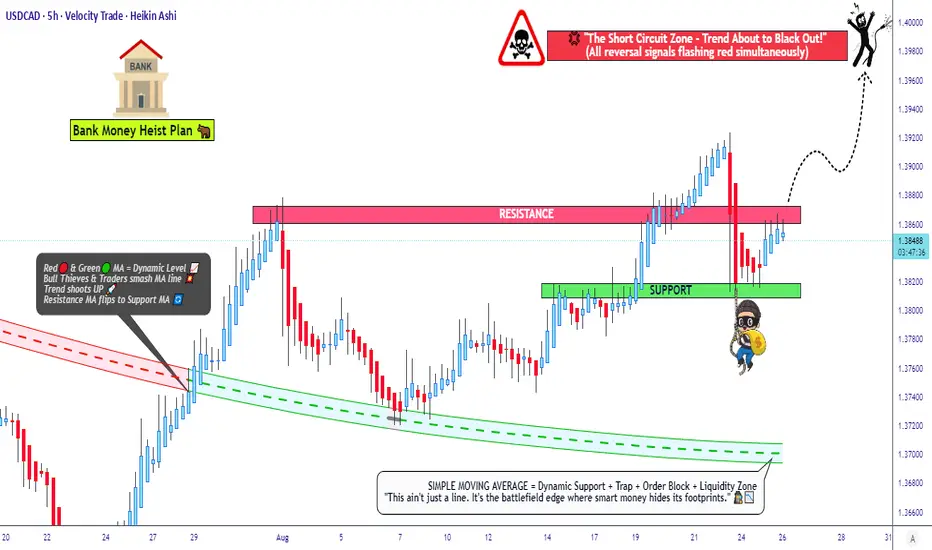
The Loonie Trap! Is USD/CAD About to Explode Higher?💵 USD/CAD "The Loonie" Forex Bank Heist Plan (Swing/Day Trade) 🏦🐱👤
🌟Dear Ladies & Gentlemen – Thief OG’s & Market Robbers!🌟
The vault is loaded, and today’s heist target is none other than USD/CAD "The Loonie". We play it the Thief way – patient, layered, and ready to strike only when the breakout lights the fuse ⚡
📈 Entry (Pending Breakout Plan)
Breakout Level: 1.38700 ⚡ "Wait for the alarm – the heist starts only when the vault door cracks!"
Layered Buy Limit Entries: (Thief Strategy DCA)
1.38600
1.38400
1.38200
(You can add more layers based on your style – Thief never limits the tools of a robbery!)
📌 Pro Tip: Set an Alarm on TradingView so you’ll know exactly when the breakout hits – thieves don’t wait blindly.
🛑 Stop Loss (Thief-Style Safety)
SL only after breakout + pullback confirmation 🚨
My vault lock suggestion: 1.37900
But remember, Thief OG’s – SL is YOUR call. Adjust based on risk, layering size & style. Don’t just follow me blindly – no one tells a thief how to escape 😉
🎯 Take Profit (The Escape Plan)
Electric shock resistance zone ahead – bail out before getting fried ⚡
TP @ 1.39700 💰
But again – you choose when to grab the bag & vanish 🏃💨. Thief rules: steal, escape, disappear!
📰 Thief Notes
Strategy: Layered Buy Orders ✅
Style: Swing/Day Trade 🕰️
Target: Quick smash-and-grab before resistance cops arrive 🚓
Risk: Always manage YOUR loot.
💖 Dear Thief OG’s, if you vibe with this USD/CAD Loonie Bank Heist Plan, hit the Boost Button 🚀. The more we boost, the stronger our robbery crew becomes 🏆💪💵
👉 Stay tuned – next heist drops soon 🤑
Market Analysis: USD/CAD Faces Fresh DeclineMarket Analysis: USD/CAD Faces Fresh Decline
USD/CAD declined and is now consolidating losses below 1.3800.
Important Takeaways for USD/CAD Analysis Today
- USD/CAD started a fresh decline after it failed to stay above 1.3900.
- There is a connecting bearish trend line with resistance at 1.3755 on the hourly chart.
USD/CAD Technical Analysis
On the hourly chart of USD/CAD, the pair climbed toward 1.3900 before the bears appeared. It formed a swing high near 1.3867 and recently declined below 1.3800.
There was also a close below the 50-hour simple moving average and 1.3785. The bulls are now active near 1.3720. If there is an upside correction, the pair could face resistance near 1.3755 and a connecting bearish trend line.
The trend line is near the 23.6% Fib retracement level of the downward move from the 1.3867 swing high to the 1.3718 low. If there is an upside break above the trend line, the pair could rise toward the 1.3785 pivot level.
The next key hurdle on the USD/CAD chart is near the 61.8% Fib retracement at 1.3810. If there is an upside break above 1.3810, the pair could rise toward 1.3865. The next major sell zone is 1.3930, above which it could rise steadily toward the 1.4000 handle.
Immediate support is near the 1.3720 level. The first major support could be 1.3700. A close below the 1.3700 level might trigger a strong decline. In the stated case, USD/CAD might test 1.3600. Any more losses may possibly open the doors for a drop toward 1.3500.
This article represents the opinion of the Companies operating under the FXOpen brand only. It is not to be construed as an offer, solicitation, or recommendation with respect to products and services provided by the Companies operating under the FXOpen brand, nor is it to be considered financial advice.

USDCAD Swing Long!
HI,Traders !
#USDCAD is trading in an
Uptrend and the pair made
A retest of the horizontal
Support of 1.38022 from where
We are already seeing a
Bullish rebound so we will be
Expecting a further
Bullish move up !
Comment and subscribe to help us grow !

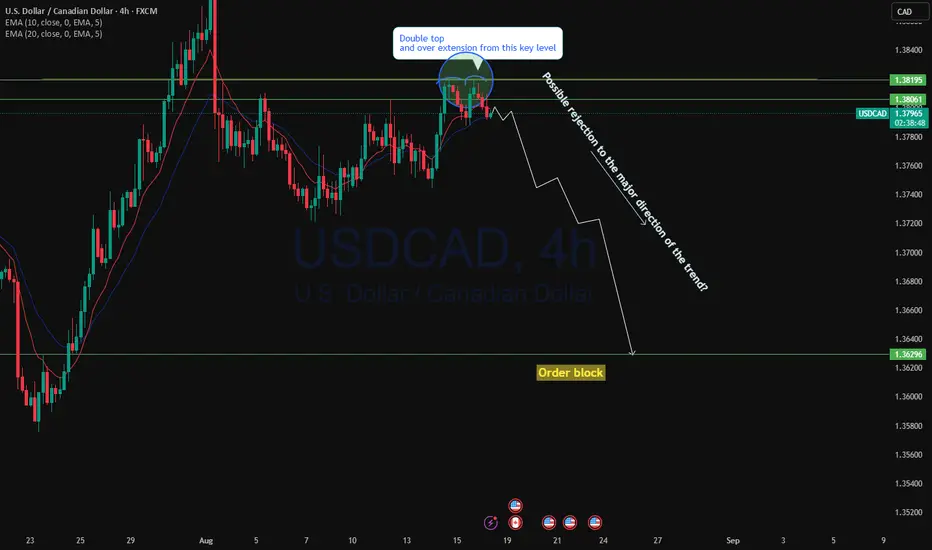
USDCAD set to drop to order block?USDCAD currently showing potential rejection upon testing the resistance 4h timeframe. There is one single move to the upside tested this key level and formed a doble top. The major direction of the trend is down and there is high potential for this market to drop to order block to test that level.
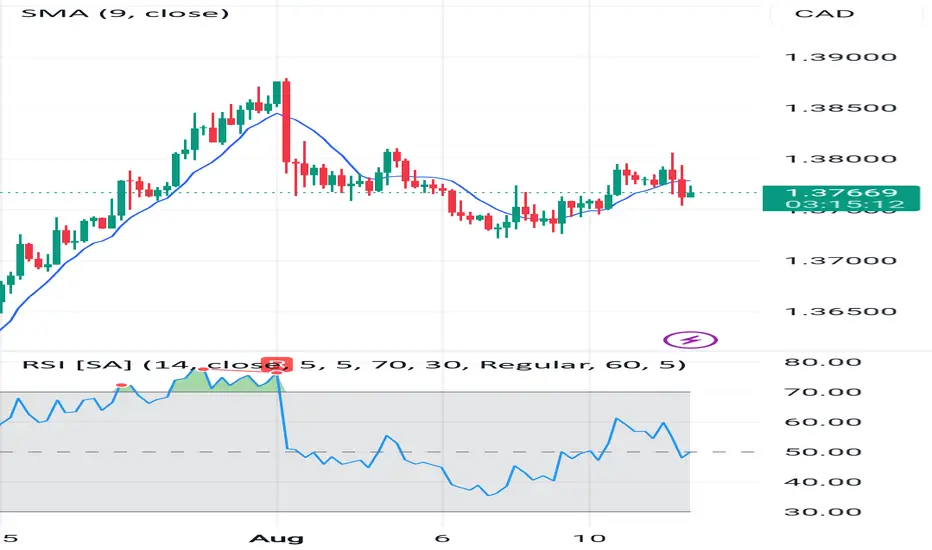
USDCAD 4-Hour Analysis – Bulls and Bears Battle for ControlCurrent Price: 1.37706
Timeframe: 4 Hours
Technical Indicators Overview
SMA (9-period): Price is hovering around the short-term moving average, signaling indecision in momentum.
RSI (14): Currently near the 50 level, showing a neutral momentum—neither overbought nor oversold.
Key Resistance: 1.3800 – A psychological and technical barrier tested multiple times.
Key Support: 1.3700 – A level where buyers previously stepped in to prevent further decline.
Price Action Summary
USDCAD recently saw a strong bullish move towards the 1.3900 area but quickly reversed, pulling back below the 1.3800 mark. Since then, price action has been choppy, suggesting a tug-of-war between buyers and sellers.
On the 4H chart, the SMA 9 is acting as a dynamic pivot, with candles frequently crossing above and below it. This behavior often precedes a breakout, but direction confirmation is still lacking.
RSI Insights
The RSI remains neutral, around 50, indicating a balance between buying and selling pressures. A move above 60 could invite bullish momentum, while a drop below 40 may trigger further selling.
Potential Scenarios
Bullish Breakout:
If price breaks and closes above 1.3800, the next upside target could be 1.3850–1.3900, where previous highs lie.
Bearish Reversal:
Failure to hold above 1.3750 could open the door for a move towards 1.3700, and below that, 1.3650.
Conclusion
USDCAD is in a consolidation phase, awaiting a catalyst for a decisive breakout. Traders should watch the 1.3800 resistance and 1.3750 support for clues on the next directional move.