USDCHF Strong buy opportunity on Channel Down bottom.The USDCHF pair has been trading within a 10-month Channel Down with its 1D MA200 (orange trend-line) as the long-term Resistance. Having bottomed on January 27 2026, the pattern is now on its latest Bullish Leg, given also that it rebounded on an oversold 1D RSI.
This week's pull-back is the Higher Low bottoming process that we've seen on the pattern's previous two bottoms. The rebounds that followed always hit at least their respective 0.618 Fibonacci levels. As a result, this is currently the most efficient level to buy and target 0.78770.
---
** Please LIKE 👍, FOLLOW ✅, SHARE 🙌 and COMMENT ✍ if you enjoy this idea! Also share your ideas and charts in the comments section below! This is best way to keep it relevant, support us, keep the content here free and allow the idea to reach as many people as possible. **
---
💸💸💸💸💸💸
👇 👇 👇 👇 👇 👇
Usdchf!

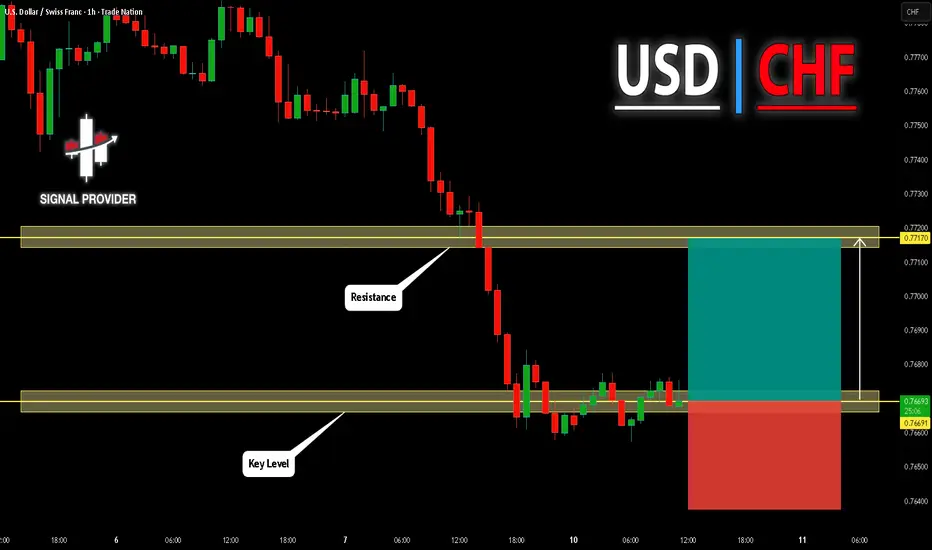
USD/CHF Price Outlook – Trade Setup📊 Technical Structure
OANDA:USDCHF USD/CHF rebounded from the 0.7660–0.7680 demand zone and is now pushing higher toward the 0.7730–0.7748 resistance band.
Price has formed a short-term higher-low sequence and is climbing along a rising trendline, indicating strengthening bullish momentum after the prior selloff.
However, the pair remains inside a broader consolidation range, and the overhead resistance area has repeatedly rejected price earlier this week.
As long as price stays above 0.7680, the short-term bias favors further upside attempts.
🎯 Trade Setup (Bullish Bias)
Entry Zone: 0.7682 – 0.7664
Stop Loss: 0.7660
Take Profit 1: 0.7730
Take Profit 2: 0.7748
Extended Target: 0.7775
Risk–Reward Ratio: Approx. 1:3.06
📌 Invalidation:
A sustained break below 0.7660 would invalidate the bullish structure and expose 0.7630
support.
🌐 Macro Background
USD/CHF is supported after weak Swiss CPI data increased expectations that the SNB may need to ease policy further, pressuring the CHF.
Swiss CPI MoM: −0.1% (below expectations)
Inflation weakness raises risk of negative rates discussion
Risk-off mood supports USD demand
Traders await US CPI for Fed policy guidance
If US CPI prints strong → USD likely strengthens further.
If CPI softens → upside may stall near resistance.
🔑 Key Technical Levels
Resistance Zone: 0.7730 – 0.7748
Support Zone: 0.7660 – 0.7680
Breakdown Level: Below 0.7660
Upside Trigger: Above 0.7748
📌 Trade Summary
USD/CHF is recovering from support with improving momentum.
Preferred strategy: Buy dips above 0.7680 targeting 0.7730–0.7750 resistance, while remaining cautious ahead of US CPI volatility.
⚠️ Disclaimer
This analysis is for reference only and does not constitute trading advice. Financial markets involve significant risk; proper risk and position management are essential.

USDCHF BEARISH BREAKOUT|SHORT|
✅USDCHF clean break below rising trendline with bearish displacement confirms BOS. Price trading under broken structure, expecting retrace into premium FVG before continuation toward sell-side liquidity at target. Time Frame 1H.
SHORT🔥
✅Like and subscribe to never miss a new idea!✅

Bullish bounce for the Swissie?The price has bounced off the support level, which is a pullback support, and could rise from this level to our take profit.
Entry: 0.7680
Why we like it:
There is a pullback support level.
Stop loss: 0.7599
Why we like it:
There is a swing low support level.
Take profit: 0.7795
Why we like it:
There is a pullback resistance level.
Enjoying your TradingView experience? Review us!
Please be advised that the information presented on TradingView is provided to Vantage (‘Vantage Global Limited’, ‘we’) by a third-party provider (‘Everest Fortune Group’). Please be reminded that you are solely responsible for the trading decisions on your account. There is a very high degree of risk involved in trading. Any information and/or content is intended entirely for research, educational and informational purposes only and does not constitute investment or consultation advice or investment strategy. The information is not tailored to the investment needs of any specific person and therefore does not involve a consideration of any of the investment objectives, financial situation or needs of any viewer that may receive it. Kindly also note that past performance is not a reliable indicator of future results. Actual results may differ materially from those anticipated in forward-looking or past performance statements. We assume no liability as to the accuracy or completeness of any of the information and/or content provided herein and the Company cannot be held responsible for any omission, mistake nor for any loss or damage including without limitation to any loss of profit which may arise from reliance on any information supplied by Everest Fortune Group.

USDCHF H4 | Bearish Reaction Off Pullback ResistanceMomentum: Bearish
Price is currently below the ichimoku cloud.
Sell entry: 0.77432
- Pullback resistance
- 78.6% Fib retracement
Stop Loss: 0.77880
- Multi-swing high resistance
Take Profit: 0.76804
- Pullback support
High Risk Investment Warning
Stratos Markets Limited (fxcm.com/uk), Stratos Europe Ltd (fxcm.com/eu):
CFDs are complex instruments and come with a high risk of losing money rapidly due to leverage. 69% of retail investor accounts lose money when trading CFDs with this provider. You should consider whether you understand how CFDs work and whether you can afford to take the high risk of losing your money.
Stratos Global LLC (fxcm.com/en): Losses can exceed deposits.
Please be advised that the information presented on TradingView is provided to FXCM (‘Company’, ‘we’) by a third-party provider (‘TFA Global Pte Ltd’). Please be reminded that you are solely responsible for the trading decisions on your account. Any information and/or content is intended entirely for research, educational and informational purposes only and does not constitute investment or consultation advice or investment strategy. The information is not tailored to the investment needs of any specific person and therefore does not involve a consideration of any of the investment objectives, financial situation or needs of any viewer that may receive it. Past performance is not a reliable indicator of future results. Actual results may differ materially from those anticipated in forward-looking or past performance statements. We assume no liability as to the accuracy or completeness of any of the information and/or content provided herein and the Company cannot be held responsible for any omission, mistake nor for any loss or damage including without limitation to any loss of profit which may arise from reliance on any information supplied by TFA Global Pte Ltd.
Stratos Trading Pty. Limited (fxcm.com/au):
Trading FX/CFDs carries significant risks. FXCM AU (AFSL 309763), please read the Financial Services Guide, Product Disclosure Statement, Target Market Determination and Terms of Business at fxcm.com/au

USDCHF – Demand Zone Bounce & Bullish Continuation SetupUSDCHF – H4 Technical Analysis
USDCHF prices have been moving sideways / range-bound on the H4 timeframe for quite some time. The chart clearly shows an upper Supply zone and a lower Demand zone, with price reacting between these two key areas.
Demand Zone Reaction:
Yesterday’s candlestick showed a strong reaction from the Demand zone. From this area, bullish momentum has developed, confirming the presence of buyers. Price has bounced from demand and started moving upward.
Momentum Outlook:
The current market structure suggests that buyers are gaining control. As long as price holds above the Demand zone, the probability of further upside continuation remains strong.
Expected Move:
If this bullish momentum continues, price is likely to move toward the upper Supply zone.
Confirmation (Lower Timeframe):
If a strong candle closes above the Supply zone on the H1 timeframe, then the probability of price reaching the next higher target increases significantly.

USDCHF Is Going Up! Long!
Please, check our technical outlook for USDCHF.
Time Frame: 4h
Current Trend: Bullish
Sentiment: Oversold (based on 7-period RSI)
Forecast: Bullish
The market is approaching a key horizontal level 0.767.
Considering the today's price action, probabilities will be high to see a movement to 0.776.
P.S
The term oversold refers to a condition where an asset has traded lower in price and has the potential for a price bounce.
Overbought refers to market scenarios where the instrument is traded considerably higher than its fair value. Overvaluation is caused by market sentiments when there is positive news.
Like and subscribe and comment my ideas if you enjoy them!

Bullish bounce off pullback support?Swissie (USD/CHF) is falling towards the pivot, which is a pullback support that is slightly below the 61.8% Fibonacci retracement and could bounce to the 1st resistance, which is also a pullback resistance.
Pivot: 0.7684
1st Support: 0.7654
1st Resistance: 0.7654
Disclaimer:
The opinions given above constitute general market commentary and do not constitute the opinion or advice of IC Markets or any form of personal or investment advice.
Any opinions, news, research, analyses, prices, other information, or links to third-party sites contained on this website are provided on an "as-is" basis, are intended to be informative only, and are not advice, a recommendation, research, a record of our trading prices, an offer of, or solicitation for, a transaction in any financial instrument and thus should not be treated as such. The information provided does not involve any specific investment objectives, financial situation, or needs of any specific person who may receive it. Please be aware that past performance is not a reliable indicator of future performance and/or results. Past performance or forward-looking scenarios based upon the reasonable beliefs of the third-party provider are not a guarantee of future performance. Actual results may differ materially from those anticipated in forward-looking or past performance statements. IC Markets makes no representation or warranty and assumes no liability as to the accuracy or completeness of the information provided, nor any loss arising from any investment based on a recommendation, forecast, or any information supplied by any third party.

USD/CHF H1 | Falling Towards Pullback SupportThe price is falling towards our buy entry level at 0.7684, which is a pullback support that is slightly above the 50% Fibonacci retracement.
Our stop loss is set at 0.7640, which is a multi-swing low support.
Our take profit is set at 0.7743, which is a pullback resistance.
High Risk Investment Warning
Stratos Markets Limited fxcm.com Stratos Europe Ltd fxcm.com
CFDs are complex instruments and come with a high risk of losing money rapidly due to leverage. 69% of retail investor accounts lose money when trading CFDs with this provider. You should consider whether you understand how CFDs work and whether you can afford to take the high risk of losing your money.
Stratos Global LLC fxcm.com Losses can exceed deposits.
Please be advised that the information presented on TradingView is provided to FXCM (‘Company’, ‘we’) by a third-party provider (‘TFA Global Pte Ltd’). Please be reminded that you are solely responsible for the trading decisions on your account. Any information and/or content is intended entirely for research, educational and informational purposes only and does not constitute investment or consultation advice or investment strategy. The information is not tailored to the investment needs of any specific person and therefore does not involve a consideration of any of the investment objectives, financial situation or needs of any viewer that may receive it. Past performance is not a reliable indicator of future results. Actual results may differ materially from those anticipated in forward-looking or past performance statements. We assume no liability as to the accuracy or completeness of any of the information and/or content provided herein and the Company cannot be held responsible for any omission, mistake nor for any loss or damage including without limitation to any loss of profit which may arise from reliance on any information supplied by TFA Global Pte Ltd.
Stratos Trading Pty. Limited fxcm.com
Trading FX/CFDs carries significant risks. FXCM AU (AFSL 309763), please read the Financial Services Guide, Product Disclosure Statement, Target Market Determination and Terms of Business at fxcm.com

USDCHF bearish sideways consolidation The USDCHF currency pair continues to display a bearish outlook, in line with the prevailing downward trend. Recent price action suggests a corrective pullback, potentially setting up for another move lower if resistance holds.
Key Level: 0.7870
This zone, previously a consolidation area, now acts as a significant resistance level.
Bearish Scenario (rejection at 0.7870):
A failed test and rejection at 0.7870 would likely resume the bearish momentum.
Downside targets include:
0.7600 – Initial support
0.7550 – Intermediate support
0.7480 – Longer-term support level
Bullish Scenario (breakout above 0.7870):
A confirmed breakout and daily close above 0.7870 would invalidate the bearish setup.
In that case, potential upside resistance levels are:
0.7890 – First resistance
0.7910 – Further upside target
Conclusion
USDCHF remains under bearish pressure, with the 0.7870 level acting as a key inflection point. As long as price remains below this level, the bias favors further downside. Traders should watch for price confirmation around that level to assess the next move.
This communication is for informational purposes only and should not be viewed as any form of recommendation as to a particular course of action or as investment advice. It is not intended as an offer or solicitation for the purchase or sale of any financial instrument or as an official confirmation of any transaction. Opinions, estimates and assumptions expressed herein are made as of the date of this communication and are subject to change without notice. This communication has been prepared based upon information, including market prices, data and other information, believed to be reliable; however, Trade Nation does not warrant its completeness or accuracy. All market prices and market data contained in or attached to this communication are indicative and subject to change without notice.

Bearish continuation setup?Swissie (USD/CHF) is rising towards the pivot, which acts as a pullback resistance and could reverse to the 1st support.
Pivot: 0.7738
1st Support: 0.7640
1st Resistance: 0.7817
Disclaimer:
The opinions given above constitute general market commentary and do not constitute the opinion or advice of IC Markets or any form of personal or investment advice.
Any opinions, news, research, analyses, prices, other information, or links to third-party sites contained on this website are provided on an "as-is" basis, are intended to be informative only, and are not advice, a recommendation, research, a record of our trading prices, an offer of, or solicitation for, a transaction in any financial instrument and thus should not be treated as such. The information provided does not involve any specific investment objectives, financial situation, or needs of any specific person who may receive it. Please be aware that past performance is not a reliable indicator of future performance and/or results. Past performance or forward-looking scenarios based upon the reasonable beliefs of the third-party provider are not a guarantee of future performance. Actual results may differ materially from those anticipated in forward-looking or past performance statements. IC Markets makes no representation or warranty and assumes no liability as to the accuracy or completeness of the information provided, nor any loss arising from any investment based on a recommendation, forecast, or any information supplied by any third party.

USD/CHF Best Place For Buy Cleared After This Massive Move !Here is my opinion on 4H T.F On USD/CHF Chart , the price Very Near to touch a very strong Support area that forced the price to respect it and go Up for more than 200 pips for 1 time , and if we checked the chart we will see that the price is going Down very hard without any correction so we need a very strong Support area to force the price to go Up at least for 100 pips so i choose this area cuz it`s the Lowest place the price touch it and it respect it very much and go Up very Good , so i`m waiting the price at this area to Buy it and targeting from 100 to 200 pips . if we have a daily closure Below my res area this idea will not be valid anymore .
Entry Reasons :
1- Very Strong Daily & Weekly Support Area .
2- Perfect Bullish Price Action Last Time .
3- Bigger Time Frames Confirmed .

USDCHF Will Go Up From Support! Buy!
Take a look at our analysis for USDCHF.
Time Frame: 1h
Current Trend: Bullish
Sentiment: Oversold (based on 7-period RSI)
Forecast: Bullish
The market is testing a major horizontal structure 0.766.
Taking into consideration the structure & trend analysis, I believe that the market will reach 0.771 level soon.
P.S
Please, note that an oversold/overbought condition can last for a long time, and therefore being oversold/overbought doesn't mean a price rally will come soon, or at all.
Like and subscribe and comment my ideas if you enjoy them!
Potential bullish reversal?Swissie (USD/CHF) is reacting off the pivot, which is a pullback support, and could bounce to the 1st resistance, which acts as a pullback resistance.
Pivot: 0.7669
1st Support: 0.7607
1st Resistance: 0.7744
Disclaimer:
The opinions given above constitute general market commentary and do not constitute the opinion or advice of IC Markets or any form of personal or investment advice.
Any opinions, news, research, analyses, prices, other information, or links to third-party sites contained on this website are provided on an "as-is" basis, are intended to be informative only, and are not advice, a recommendation, research, a record of our trading prices, an offer of, or solicitation for, a transaction in any financial instrument and thus should not be treated as such. The information provided does not involve any specific investment objectives, financial situation, or needs of any specific person who may receive it. Please be aware that past performance is not a reliable indicator of future performance and/or results. Past performance or forward-looking scenarios based upon the reasonable beliefs of the third-party provider are not a guarantee of future performance. Actual results may differ materially from those anticipated in forward-looking or past performance statements. IC Markets makes no representation or warranty and assumes no liability as to the accuracy or completeness of the information provided, nor any loss arising from any investment based on a recommendation, forecast, or any information supplied by any third party

USDCHF: Growth & Bullish Continuation
The analysis of the USDCHF chart clearly shows us that the pair is finally about to go up due to the rising pressure from the buyers.
Disclosure: I am part of Trade Nation's Influencer program and receive a monthly fee for using their TradingView charts in my analysis.
❤️ Please, support our work with like & comment! ❤️

USDCHF Relief Bounce or Just a Pause Before the Next Leg Lower?USDCHF has just delivered a clean structural break on the daily chart, slicing through trend support and accelerating into a fresh low zone. What stands out to me is not just the drop, but the character of the move — sharp, impulsive, and driven by safe-haven CHF demand rather than slow drift. The current bounce looks more like a technical reaction than a confirmed reversal. Unless price can reclaim broken structure, I’m treating rallies as corrective and downside as the path of least resistance for now.
Current Bias
Bearish
The daily structure is broken, trend support gave way, and price is now trading below the prior range base. Momentum favors continuation lower after pullbacks rather than sustained upside recovery.
Key Fundamental Drivers
CHF safe-haven demand: Swiss franc continues to attract flows when geopolitical and macro uncertainty rises.
USD rate path: The Fed is restrictive but increasingly data-dependent. Any cooling in US inflation and jobs data reduces USD yield support at the margin.
SNB stance: Swiss policy is less restrictive than the Fed, but CHF strength is often driven more by capital preservation flows than rate spreads alone.
Risk tone: When equity and credit risk wobbles, CHF tends to outperform against USD.
Macro Context
Interest rate expectations: Fed policy remains tight, but markets are watching for the timing of eventual easing. That caps aggressive USD upside unless data re-accelerates.
Economic growth trends: US growth is slowing but still holding up in services. Europe and Switzerland are softer, but CHF benefits from defensive positioning rather than growth strength.
Commodity and capital flows: In periods of uncertainty, capital rotates toward defensive currencies like CHF rather than commodity FX.
Geopolitical themes: Ongoing geopolitical tension and sanction/trade friction themes support intermittent safe-haven demand, which favors CHF on dips.
Primary Risk to the Trend
The main risk to the bearish view is a hot US inflation or labor report that reprices Fed cuts later and pushes US yields higher again. That would support USD broadly and could trigger a sharp USDCHF short squeeze.
A strong global risk rally is another upside risk for USDCHF if CHF safe-haven demand fades.
Most Critical Upcoming News/Event
US CPI and core inflation data
US labor market releases
Fed speaker guidance on rate timing
Any major geopolitical escalation headlines
These directly affect USD yield expectations and safe-haven flows.
Leader/Lagger Dynamics
USDCHF is typically a lagger pair.
It often follows:
Broader USD direction led by EURUSD and DXY
Risk sentiment shifts seen in equities
Safe-haven flows also visible in gold
It can influence:
CHF crosses like EURCHF and GBPCHF after the move is established.
When CHF is in demand, you will often see confirmation from gold strength and softer equity tone.
Key Levels
Support Levels:
0.7600–0.7620 zone — current reaction low area
0.7430–0.7450 zone — next major downside target band
Resistance Levels:
0.7850 area — broken structure support turned resistance
0.8000–0.8050 — upper range and descending trendline zone
Stop Loss (SL):
Above 0.7850 for bearish continuation setups
Take Profit (TP):
TP1: 0.7600 zone
TP2: 0.7440 zone
Summary: Bias and Watchpoints
USDCHF has shifted into a bearish structural phase after a decisive daily breakdown, and I’m treating the current bounce as corrective unless price can reclaim the 0.7850 region. The move is supported by CHF safe-haven demand and softer forward USD rate expectations. Downside targets sit near 0.7600 first, then the 0.7440 zone if momentum continues. Invalidation for the bearish view sits above the broken structure resistance. The key watchpoint is US inflation and labor data — that’s the catalyst most likely to either extend the drop or force a sharp USD-driven reversal.

USDCHF downtrend continuation capped at 0.7870The USDCHF currency pair continues to display a bearish outlook, in line with the prevailing downward trend. Recent price action suggests a corrective pullback, potentially setting up for another move lower if resistance holds.
Key Level: 0.7870
This zone, previously a consolidation area, now acts as a significant resistance level.
Bearish Scenario (rejection at 0.7870):
A failed test and rejection at 0.7870 would likely resume the bearish momentum.
Downside targets include:
0.7600 – Initial support
0.7550 – Intermediate support
0.7480 – Longer-term support level
Bullish Scenario (breakout above 0.7870):
A confirmed breakout and daily close above 0.7870 would invalidate the bearish setup.
In that case, potential upside resistance levels are:
0.7890 – First resistance
0.7910 – Further upside target
Conclusion
USDCHF remains under bearish pressure, with the 0.7870 level acting as a key inflection point. As long as price remains below this level, the bias favors further downside. Traders should watch for price confirmation around that level to assess the next move.
This communication is for informational purposes only and should not be viewed as any form of recommendation as to a particular course of action or as investment advice. It is not intended as an offer or solicitation for the purchase or sale of any financial instrument or as an official confirmation of any transaction. Opinions, estimates and assumptions expressed herein are made as of the date of this communication and are subject to change without notice. This communication has been prepared based upon information, including market prices, data and other information, believed to be reliable; however, Trade Nation does not warrant its completeness or accuracy. All market prices and market data contained in or attached to this communication are indicative and subject to change without notice.

USDCHF H4 | Heading Towards 61.8% Fib ResistanceBased on the H4 chart analysis, we could see the price rise to our sell entry level at 0.7863, which is a pullback resistance that aligns with the 61.8% Fibonacci retracement.
Our stop loss is set at 0.7960, which is an overlap resistance that is slightly above the 78.6% Fibonacci retracement.
Our take profit is set at 0.7693, whichis a pullback support.
High Risk Investment Warning
Stratos Markets Limited fxcm.com Stratos Europe Ltd fxcm.com
CFDs are complex instruments and come with a high risk of losing money rapidly due to leverage. 69% of retail investor accounts lose money when trading CFDs with this provider. You should consider whether you understand how CFDs work and whether you can afford to take the high risk of losing your money.
Stratos Global LLC fxcm.com Losses can exceed deposits.
Please be advised that the information presented on TradingView is provided to FXCM (‘Company’, ‘we’) by a third-party provider (‘TFA Global Pte Ltd’). Please be reminded that you are solely responsible for the trading decisions on your account. Any information and/or content is intended entirely for research, educational and informational purposes only and does not constitute investment or consultation advice or investment strategy. The information is not tailored to the investment needs of any specific person and therefore does not involve a consideration of any of the investment objectives, financial situation or needs of any viewer that may receive it. Past performance is not a reliable indicator of future results. Actual results may differ materially from those anticipated in forward-looking or past performance statements. We assume no liability as to the accuracy or completeness of any of the information and/or content provided herein and the Company cannot be held responsible for any omission, mistake nor for any loss or damage including without limitation to any loss of profit which may arise from reliance on any information supplied by TFA Global Pte Ltd.
Stratos Trading Pty. Limited fxcm.com
Trading FX/CFDs carries significant risks. FXCM AU (AFSL 309763), please read the Financial Services Guide, Product Disclosure Statement, Target Market Determination and Terms of Business at fxcm.com

Heading towards pullback resistance?Swissie (USD/CHF) is rising towards the pivot, which has been identified as a pullback resistance and could reverse to the 1st support, which is a pullback support.
Pivot: 0.7855
1st Support: 0.7611
1st Resistance: 0.7892
Disclaimer:
The opinions given above constitute general market commentary and do not constitute the opinion or advice of IC Markets or any form of personal or investment advice.
Any opinions, news, research, analyses, prices, other information, or links to third-party sites contained on this website are provided on an "as-is" basis, are intended to be informative only, and are not advice, a recommendation, research, a record of our trading prices, an offer of, or solicitation for, a transaction in any financial instrument and thus should not be treated as such. The information provided does not involve any specific investment objectives, financial situation, or needs of any specific person who may receive it. Please be aware that past performance is not a reliable indicator of future performance and/or results. Past performance or forward-looking scenarios based upon the reasonable beliefs of the third-party provider are not a guarantee of future performance. Actual results may differ materially from those anticipated in forward-looking or past performance statements. IC Markets makes no representation or warranty and assumes no liability as to the accuracy or completeness of the information provided, nor any loss arising from any investment based on a recommendation, forecast, or any information supplied by any third party

USD-CHF Will Go UP! Buy!
Hello,Traders!
USDCHF reacts strongly from a well-defined demand zone after sell-side liquidity sweep. SMC rebound confirmed as buyers defend structure, targeting higher liquidity above recent highs. Time Frame 5H.
Buy!
Comment and subscribe to help us grow!
Check out other forecasts below too!
Disclosure: I am part of Trade Nation's Influencer program and receive a monthly fee for using their TradingView charts in my analysis.

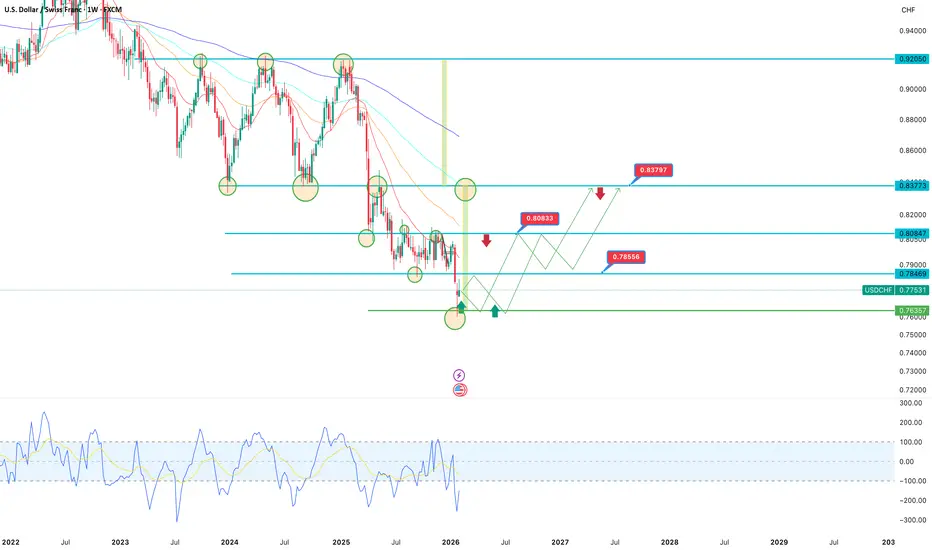
USDCHF: Long-term Bearish Trend Persists Since 2022, the pair has been in a steady downtrend: consistent lower highs and lower lows within a multi-year descending channel from highs near 0.9200-0.9400.
Current price around 0.7753, following a bounce from the multi-year low at 0.76357 (green support zone marked on the chart).
Support:
0.76357 (critical multi-year zone, green line), below - potential extension to 0.7600-0.7550 (channel projection).
Resistance:
0.80833 (intermediate level, 2025 low), higher - 0.83797 and 0.84847 (next Seller Zones).
Long-term downside target: 0.7635-0.7600 (primary buyer zone on weekly), break below opens path toward 0.7400+.
Current structure remains bearish:
after a false upside breakout in 2025, price returned to the channel and is forming lower lows. Volume profile and oscillators indicate fading bullish momentum, with CHF staying strong amid risks and SNB policy.
Primary scenario - continued downside: holding below 0.7850-0.7900 leads to test of
0.7635-0.7600 in the coming months.
Bullish alternative (low probability): strong bounce from 0.7635 with break above 0.80833 targeting 0.83797 - would require sharp CHF weakness or aggressive Fed easing.
Fundamentally, the franc benefits as a safe-haven amid global uncertainty, while the dollar loses ground. Looking for weekly candle close below 0.7700 to confirm stronger bearish conviction.
Your view?
Short from current levels or waiting for a bounce off 0.7635? Share your thoughts in the comments.
USDCHFUSDCHF price is near the support zone of 0.77528-0.77352. If the price fails to break through 0.77352, a rebound is expected.
🔥Trading futures, forex, CFDs and stocks carries a risk of loss.
Please consider carefully whether such trading is suitable for you.
This content is not financial advice. Always conduct your own financial due diligence.
>>GooD Luck 😊
❤️ Like and subscribe to never miss a new idea!

USDCHF is Ready to flyUSDCHF is trading within a corrective consolidation after a strong bearish impulse, with price currently reacting from a clearly defined H4 demand and support zone, signaling potential accumulation and a developing base for a bullish retracement toward the higher supply area. The rejection wicks and compression above support suggest selling pressure is weakening while buyers are gradually absorbing liquidity, aligning with a mean-reversion move within a broader corrective structure. Fundamentally, the pair is influenced by ongoing US dollar softness driven by expectations of Federal Reserve rate cuts later in 2025 following mixed US inflation and labor data, while the Swiss franc remains relatively strong due to its safe-haven status, although downside CHF momentum has eased as risk sentiment stabilizes. With liquidity resting above the recent range, improving short-term momentum, and price respecting institutional demand, this structure favors a technical rebound toward premium levels, offering a favorable risk-to-reward opportunity for bullish continuation plays within the current market context.
