USDCHF resistance retest at 0.7980The USDCHF remains in a bullish trend, with recent price action showing signs of a breakout within the broader uptrend.
Support Zone: 0.7980 – a key level from previous consolidation. Price is currently testing or approaching this level.
A bullish rebound from 0.7980 would confirm ongoing upside momentum, with potential targets at:
0.8060 – initial resistance
0.8070 – psychological and structural level
0.8090 – extended resistance on the longer-term chart
Bearish Scenario:
A confirmed break and daily close below 0.7980 would weaken the bullish outlook and suggest deeper downside risk toward:
0.7960 – minor support
0.7935 – stronger support and potential demand zone
Outlook:
Bullish bias remains intact while the USDCHF holds above 0.7980 A sustained break below this level could shift momentum to the downside in the short term.
This communication is for informational purposes only and should not be viewed as any form of recommendation as to a particular course of action or as investment advice. It is not intended as an offer or solicitation for the purchase or sale of any financial instrument or as an official confirmation of any transaction. Opinions, estimates and assumptions expressed herein are made as of the date of this communication and are subject to change without notice. This communication has been prepared based upon information, including market prices, data and other information, believed to be reliable; however, Trade Nation does not warrant its completeness or accuracy. All market prices and market data contained in or attached to this communication are indicative and subject to change without notice.
Usdchf!

USDCHF: Bears Will Push Lower
It is essential that we apply multitimeframe technical analysis and there is no better example of why that is the case than the current USDCHF chart which, if analyzed properly, clearly points in the downward direction.
Disclosure: I am part of Trade Nation's Influencer program and receive a monthly fee for using their TradingView charts in my analysis.
❤️ Please, support our work with like & comment! ❤️

USDCHF H1 | Bullish Bounce Off Pullback SupportMomentum: Bullish
Price is currently above the ichimoku cloud.
Buy entry: 0.80088
- Pullback support
- 61.8% Fib retracement
Stop Loss: 0.7989
- Swing low support
Take Profit: 0.8038
- Multi-swing high resistance
High Risk Investment Warning
Stratos Markets Limited (tradu.com/uk ), Stratos Europe Ltd (tradu.com/eu ):
CFDs are complex instruments and come with a high risk of losing money rapidly due to leverage. 70% of retail investor accounts lose money when trading CFDs with this provider. You should consider whether you understand how CFDs work and whether you can afford to take the high risk of losing your money.
Stratos Global LLC (tradu.com/en ): Losses can exceed deposits.
Please be advised that the information presented on TradingView is provided to Tradu (‘Company’, ‘we’) by a third-party provider (‘TFA Global Pte Ltd’). Please be reminded that you are solely responsible for the trading decisions on your account. Any information and/or content is intended entirely for research, educational and informational purposes only and does not constitute investment or consultation advice or investment strategy. The information is not tailored to the investment needs of any specific person and therefore does not involve a consideration of any of the investment objectives, financial situation or needs of any viewer that may receive it. Past performance is not a reliable indicator of future results. Actual results may differ materially from those anticipated in forward-looking or past performance statements. We assume no liability as to the accuracy or completeness of any of the information and/or content provided herein and the Company cannot be held responsible for any omission, mistake nor for any loss or damage including without limitation to any loss of profit which may arise from reliance on any information supplied by TFA Global Pte Ltd.

Falling towards major support?Swissie (USD/CHF) is falling towards the pivot and could bounce to the 1st resistance, which is an overlap resistance.
Pivot: 0.7875
1st Support: 0.7739
1st Resistance: 0.8084
Disclaimer:
The opinions given above constitute general market commentary and do not constitute the opinion or advice of IC Markets or any form of personal or investment advice.
Any opinions, news, research, analyses, prices, other information, or links to third-party sites contained on this website are provided on an "as-is" basis, are intended to be informative only, and are not advice, a recommendation, research, a record of our trading prices, an offer of, or solicitation for, a transaction in any financial instrument and thus should not be treated as such. The information provided does not involve any specific investment objectives, financial situation, or needs of any specific person who may receive it. Please be aware that past performance is not a reliable indicator of future performance and/or results. Past performance or forward-looking scenarios based upon the reasonable beliefs of the third-party provider are not a guarantee of future performance. Actual results may differ materially from those anticipated in forward-looking or past performance statements. IC Markets makes no representation or warranty and assumes no liability as to the accuracy or completeness of the information provided, nor any loss arising from any investment based on a recommendation, forecast, or any information supplied by any third party.

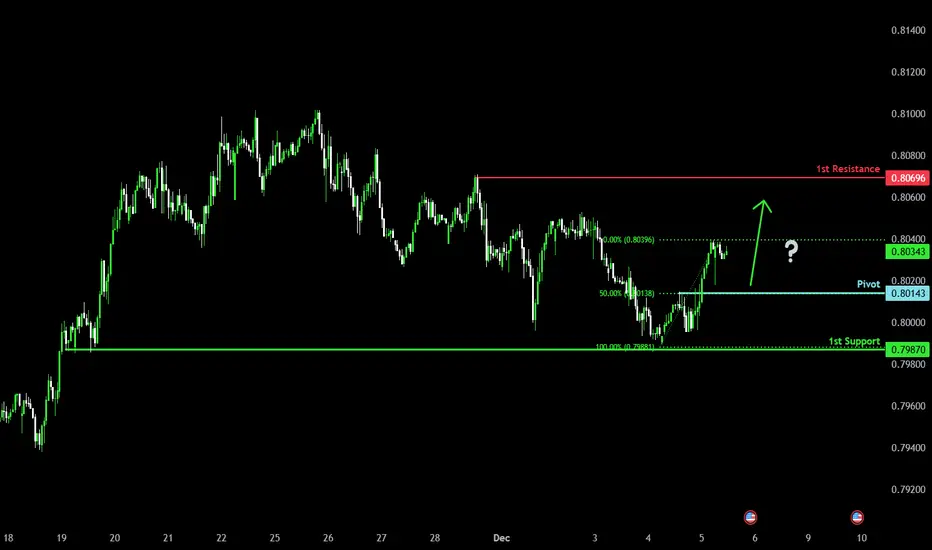
Bullish bounce off pullback support?Swissie (USD/CHF) could fall towards the pivot which acts as a pullback support that aligns witht he 50% Fibonacci retracement and could bounce to the 1st resistance.
Pivot: 0.8014
1st Support: 0.7987
1st Resistance: 0.8069
Disclaimer:
The opinions given above constitute general market commentary and do not constitute the opinion or advice of IC Markets or any form of personal or investment advice.
Any opinions, news, research, analyses, prices, other information, or links to third-party sites contained on this website are provided on an "as-is" basis, are intended to be informative only, and are not advice, a recommendation, research, a record of our trading prices, an offer of, or solicitation for, a transaction in any financial instrument and thus should not be treated as such. The information provided does not involve any specific investment objectives, financial situation, or needs of any specific person who may receive it. Please be aware that past performance is not a reliable indicator of future performance and/or results. Past performance or forward-looking scenarios based upon the reasonable beliefs of the third-party provider are not a guarantee of future performance. Actual results may differ materially from those anticipated in forward-looking or past performance statements. IC Markets makes no representation or warranty and assumes no liability as to the accuracy or completeness of the information provided, nor any loss arising from any investment based on a recommendation, forecast, or any information supplied by any third party.
Potential bullish reversal?USD/CHF has bounced off the support level which is an overlap support, and could rise from this level to our take profit.
USD/CHF has bounced off the support level which is an overlap support, and could rise from this level to our take profit.
Entry: 0.8006
Why we like it:
There is an overlap support level.
Stop loss: 0.7968
Why we like it:
There is a pullback support level that is slightly above the 61.8% Fibonacci retracement.
Take profit: 0.8067
Why we like it:
There is a pullback resistance that is slightly above the 61.85 Fibonacci retracement.
Enjoying your TradingView experience? Review us!
Please be advised that the information presented on TradingView is provided to Vantage (‘Vantage Global Limited’, ‘we’) by a third-party provider (‘Everest Fortune Group’). Please be reminded that you are solely responsible for the trading decisions on your account. There is a very high degree of risk involved in trading. Any information and/or content is intended entirely for research, educational and informational purposes only and does not constitute investment or consultation advice or investment strategy. The information is not tailored to the investment needs of any specific person and therefore does not involve a consideration of any of the investment objectives, financial situation or needs of any viewer that may receive it. Kindly also note that past performance is not a reliable indicator of future results. Actual results may differ materially from those anticipated in forward-looking or past performance statements. We assume no liability as to the accuracy or completeness of any of the information and/or content provided herein and the Company cannot be held responsible for any omission, mistake nor for any loss or damage including without limitation to any loss of profit which may arise from reliance on any information supplied by Everest Fortune Group.

USD/CHF Hints at Swing Low at Round NumberA bullish engulfing candle formed around the 0.80 handle on Thursday, closing back above the monthly pivot point and the 50- and 20-day EMAs. The 4-hour chart shows momentum turning higher after a correction from ~0.81, with the upswing supported by rising volumes — signalling bullish initiation.
Note the high-volume node (HVN) around 0.8050, which may act as near-term resistance and trigger a pullback. Bulls could look for dips within Thursday’s range in anticipation of a move towards 0.81.
Matt Simpson, Market Analyst at City Index.

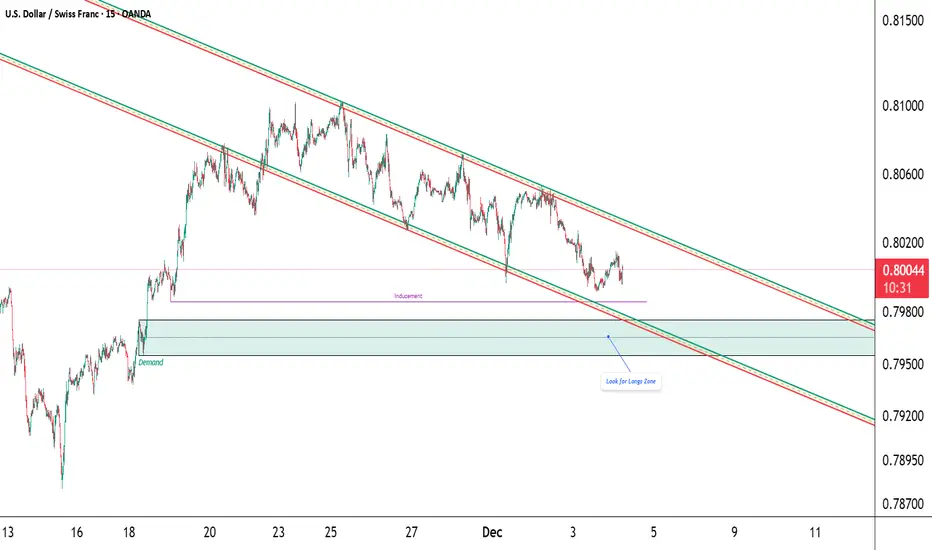
USD/CHF – Watching for liquidity sweep into origin demandPrice is trading inside a clean descending channel.
Below current price sits untouched inducement — a liquidity pool that lines up perfectly with the origin demand zone where the previous impulsive rally started.
If price sweeps that inducement and taps the demand zone, I’ll look for confirmation (MSS + FVG/OB) for a potential move back toward the channel midline or upper boundary.
Bias: Bullish upon sweep + tap
Invalidation: Clean break below demand
Confluence: Channel low + origin demand + resting liquidity
Not financial advice.
USDCHF H1 | Bullish Reversal SetupMomentum: Bullish
The price is falling towards the buy entry, which has been identified as an overlap support.
Buy entry: 0.8004
Overlap support
Stop loss: 0.7974
Pullback support
138.2% Fibonaci extension
Take profit 0.8062
Pullback resistance
High Risk Investment Warning
Stratos Markets Limited (tradu.com ), Stratos Europe Ltd (tradu.com ):
CFDs are complex instruments and come with a high risk of losing money rapidly due to leverage. 70% of retail investor accounts lose money when trading CFDs with this provider. You should consider whether you understand how CFDs work and whether you can afford to take the high risk of losing your money.
Stratos Global LLC (tradu.com ): Losses can exceed deposits.
Please be advised that the information presented on TradingView is provided to Tradu (‘Company’, ‘we’) by a third-party provider (‘TFA Global Pte Ltd’). Please be reminded that you are solely responsible for the trading decisions on your account. Any information and/or content is intended entirely for research, educational and informational purposes only and does not constitute investment or consultation advice or investment strategy. The information is not tailored to the investment needs of any specific person and therefore does not involve a consideration of any of the investment objectives, financial situation or needs of any viewer that may receive it. Past performance is not a reliable indicator of future results. Actual results may differ materially from those anticipated in forward-looking or past performance statements. We assume no liability as to the accuracy or completeness of any of the information and/or content provided herein and the Company cannot be held responsible for any omission, mistake nor for any loss or damage including without limitation to any loss of profit which may arise from reliance on any information supplied by TFA Global Pte Ltd.

USDCHF H4 | Falling Towards Key SupportMomentum: Bullish
Price is pulling back toward the buy entry, aligning with the 78.6% Fibonacci projection while remaining above the Ichimoku cloud.
Buy Entry: 0.8041
Strong overlap support
78.6% Fibonacci projection
Stop Loss: 0.7971
Pullback support
Slightly above the 61.8% Fibonacci retracement
Take Profit: 0.8067
Overlap resistance
High Risk Investment Warning
Stratos Markets Limited (tradu.com ), Stratos Europe Ltd (tradu.com ):
CFDs are complex instruments and come with a high risk of losing money rapidly due to leverage. 70% of retail investor accounts lose money when trading CFDs with this provider. You should consider whether you understand how CFDs work and whether you can afford to take the high risk of losing your money.
Stratos Global LLC (tradu.com ): Losses can exceed deposits.
Please be advised that the information presented on TradingView is provided to Tradu (‘Company’, ‘we’) by a third-party provider (‘TFA Global Pte Ltd’). Please be reminded that you are solely responsible for the trading decisions on your account. Any information and/or content is intended entirely for research, educational and informational purposes only and does not constitute investment or consultation advice or investment strategy. The information is not tailored to the investment needs of any specific person and therefore does not involve a consideration of any of the investment objectives, financial situation or needs of any viewer that may receive it. Past performance is not a reliable indicator of future results. Actual results may differ materially from those anticipated in forward-looking or past performance statements. We assume no liability as to the accuracy or completeness of any of the information and/or content provided herein and the Company cannot be held responsible for any omission, mistake nor for any loss or damage including without limitation to any loss of profit which may arise from reliance on any information supplied by TFA Global Pte Ltd.

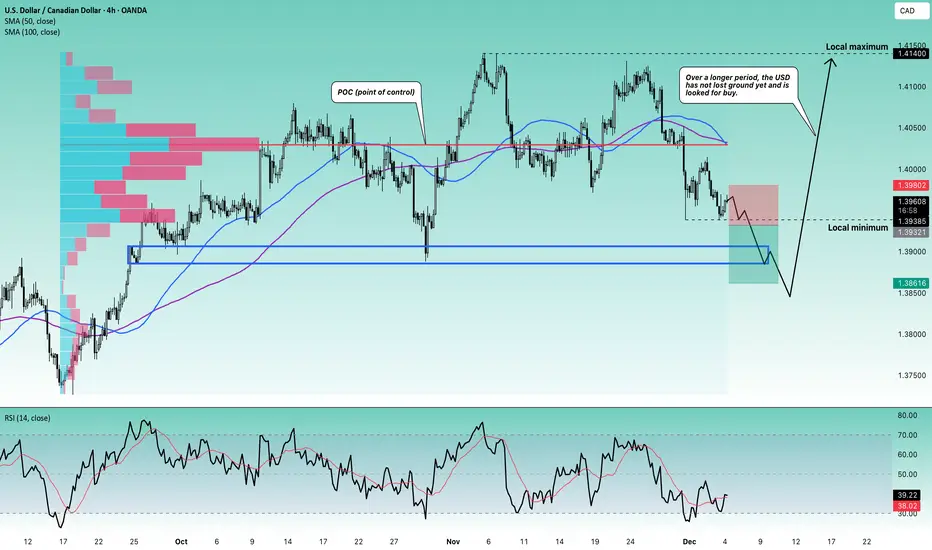
Stop!Loss|Market View: USDCAD🙌 Stop!Loss team welcomes you❗️
In this post, we're going to talk about the near-term outlook for the USDCAD currency pair☝️
Potential trade setup:
🔔Entry level: 1.32468
💰TP: 1.33901
⛔️SL: 1.31035
"Market View" - a brief analysis of trading instruments, covering the most important aspects of the FOREX market.
👇 In the comments 👇 you can type the trading instrument you'd like to analyze, and we'll talk about it in our next posts.
💬 Description: The USD will likely continue to decline in the short term, but the mid-term outlook remains favorable for buyers. For USDCAD, 1.39000 and 1.38500 are likely potential buying opportunities in the mid-term. Currently, given the price accumulation near the support level of 1.39385, a breakout to the levels outlined above is expected.
Thanks for your support 🚀
Profits for all ✅
USDCHF: Swing Trading & Technical Analysis
Our strategy, polished by years of trial and error has helped us identify what seems to be a great trading opportunity and we are here to share it with you as the time is ripe for us to buy USDCHF.
Disclosure: I am part of Trade Nation's Influencer program and receive a monthly fee for using their TradingView charts in my analysis.
❤️ Please, support our work with like & comment! ❤️

USDCHF corrective pullback supported at 0.7980The USDCHF remains in a bullish trend, with recent price action showing signs of a breakout within the broader uptrend.
Support Zone: 0.7980 – a key level from previous consolidation. Price is currently testing or approaching this level.
A bullish rebound from 0.7980 would confirm ongoing upside momentum, with potential targets at:
0.8060 – initial resistance
0.8070 – psychological and structural level
0.8090 – extended resistance on the longer-term chart
Bearish Scenario:
A confirmed break and daily close below 0.7980 would weaken the bullish outlook and suggest deeper downside risk toward:
0.7960 – minor support
0.7935 – stronger support and potential demand zone
Outlook:
Bullish bias remains intact while the USDCHF holds above 0.7980 A sustained break below this level could shift momentum to the downside in the short term.
This communication is for informational purposes only and should not be viewed as any form of recommendation as to a particular course of action or as investment advice. It is not intended as an offer or solicitation for the purchase or sale of any financial instrument or as an official confirmation of any transaction. Opinions, estimates and assumptions expressed herein are made as of the date of this communication and are subject to change without notice. This communication has been prepared based upon information, including market prices, data and other information, believed to be reliable; however, Trade Nation does not warrant its completeness or accuracy. All market prices and market data contained in or attached to this communication are indicative and subject to change without notice.

Bullish bounce of pullback support?Swissie (USD/CHF) is falling towards the pivot, which aligns with the 50% Fibonacci retracement and could bounce to the 1sr resistance.
Pivot: 0.7992
1st Support: 0.8063
1st Resistance: 0.8063
Disclaimer:
The opinions given above constitute general market commentary and do not constitute the opinion or advice of IC Markets or any form of personal or investment advice.
Any opinions, news, research, analyses, prices, other information, or links to third-party sites contained on this website are provided on an "as-is" basis, are intended to be informative only, and are not advice, a recommendation, research, a record of our trading prices, an offer of, or solicitation for, a transaction in any financial instrument and thus should not be treated as such. The information provided does not involve any specific investment objectives, financial situation, or needs of any specific person who may receive it. Please be aware that past performance is not a reliable indicator of future performance and/or results. Past performance or forward-looking scenarios based upon the reasonable beliefs of the third-party provider are not a guarantee of future performance. Actual results may differ materially from those anticipated in forward-looking or past performance statements. IC Markets makes no representation or warranty and assumes no liability as to the accuracy or completeness of the information provided, nor any loss arising from any investment based on a recommendation, forecast, or any information supplied by any third party.

USDCHF Will Go Up! Long!
Take a look at our analysis for USDCHF.
Time Frame: 4h
Current Trend: Bullish
Sentiment: Oversold (based on 7-period RSI)
Forecast: Bullish
The market is approaching a significant support area 0.801.
The underlined horizontal cluster clearly indicates a highly probable bullish movement with target 0.805 level.
P.S
The term oversold refers to a condition where an asset has traded lower in price and has the potential for a price bounce.
Overbought refers to market scenarios where the instrument is traded considerably higher than its fair value. Overvaluation is caused by market sentiments when there is positive news.
Like and subscribe and comment my ideas if you enjoy them!

USDCHF D11️⃣ Market Context
USDCHF on the D1 timeframe continues to respect a long-term sideways range with clear rejection zones.
The pair is repeatedly failing to break above 0.8097 – 0.8130, which is your marked major supply zone.
Right now, price has tapped the zone, formed a lower high, and started to turn down → classic distribution behavior.
2️⃣ Key Levels
🔴 Resistance (Supply Zone)
0.8097 – 0.8130
This region has caused multiple rejections since July.
Sellers consistently dominate here.
🔵 Support Levels
0.7967 → mid-range liquidity zone
0.7828 → your target, major support + range bottom
These are exactly in line with previous swing lows and liquidity pools.
3️⃣ Market Structure
Price failed to break the higher high from early November.
Formed a lower high near resistance → bearish structure shift.
The current candle behavior shows momentum slowing and a likely bearish continuation pattern.
This suggests USDCHF may be entering a down cycle inside the range.
4️⃣ Expected Move (Matches Your Projection)
Your chart suggests:
✔️ Retest & rejection from 0.8090–0.8130
✔️ Downside continuation toward:
First support: 0.7967
Main target: 0.7828 (range floor)
This projection is highly valid based on:
Repeated rejections from supply
Lower high formation
No bullish structure break
Volume drop at resistance
5️⃣ Trading Bias
📌 Bias: Bearish
As long as price stays below 0.8097, bears stay in control.

USDCHFUSDCHF
- Bearish Channel as an corrective pattern in Short Time Frame
- Break of Structure
- RSI - Divergence
- Order Block
- Completed " 12345 " Impulsive Waves and " A " Corrective Wave

USDCHF H4 | Bullish Bounce Off Key SupportMomentum: Bullish
Price is currently within the bullish ichimoku cloud.
Buy entry: 0.79918
- Strong overlap support
- 50% Fib retracement
- 100% Fib projection
Stop Loss: 0.79423
- Overlap support
Take Profit: 0.80445
- Overlap resistance
High Risk Investment Warning
Stratos Markets Limited (tradu.com/uk ), Stratos Europe Ltd (tradu.com/eu ):
CFDs are complex instruments and come with a high risk of losing money rapidly due to leverage. 70% of retail investor accounts lose money when trading CFDs with this provider. You should consider whether you understand how CFDs work and whether you can afford to take the high risk of losing your money.
Stratos Global LLC (tradu.com/en ): Losses can exceed deposits.
Please be advised that the information presented on TradingView is provided to Tradu (‘Company’, ‘we’) by a third-party provider (‘TFA Global Pte Ltd’). Please be reminded that you are solely responsible for the trading decisions on your account. Any information and/or content is intended entirely for research, educational and informational purposes only and does not constitute investment or consultation advice or investment strategy. The information is not tailored to the investment needs of any specific person and therefore does not involve a consideration of any of the investment objectives, financial situation or needs of any viewer that may receive it. Past performance is not a reliable indicator of future results. Actual results may differ materially from those anticipated in forward-looking or past performance statements. We assume no liability as to the accuracy or completeness of any of the information and/or content provided herein and the Company cannot be held responsible for any omission, mistake nor for any loss or damage including without limitation to any loss of profit which may arise from reliance on any information supplied by TFA Global Pte Ltd.

USDCHF corrective pullback supported at 0.7980The USDCHF remains in a bullish trend, with recent price action showing signs of a breakout within the broader uptrend.
Support Zone: 0.7980 – a key level from previous consolidation. Price is currently testing or approaching this level.
A bullish rebound from 0.7980 would confirm ongoing upside momentum, with potential targets at:
0.8060 – initial resistance
0.8070 – psychological and structural level
0.8090 – extended resistance on the longer-term chart
Bearish Scenario:
A confirmed break and daily close below 0.7980 would weaken the bullish outlook and suggest deeper downside risk toward:
0.7960 – minor support
0.7935 – stronger support and potential demand zone
Outlook:
Bullish bias remains intact while the USDCHF holds above 0.7980 A sustained break below this level could shift momentum to the downside in the short term.
This communication is for informational purposes only and should not be viewed as any form of recommendation as to a particular course of action or as investment advice. It is not intended as an offer or solicitation for the purchase or sale of any financial instrument or as an official confirmation of any transaction. Opinions, estimates and assumptions expressed herein are made as of the date of this communication and are subject to change without notice. This communication has been prepared based upon information, including market prices, data and other information, believed to be reliable; however, Trade Nation does not warrant its completeness or accuracy. All market prices and market data contained in or attached to this communication are indicative and subject to change without notice.

Bullish bounce off major support?Swissie (USD/CHF) is falling towards the pivot and could bounce to the pullback resistance.
Pivot: 0.7875
1st Support: 0.7720
1st Resistance: 0.8165
Disclaimer:
The opinions given above constitute general market commentary and do not constitute the opinion or advice of IC Markets or any form of personal or investment advice.
Any opinions, news, research, analyses, prices, other information, or links to third-party sites contained on this website are provided on an "as-is" basis, are intended to be informative only, and are not advice, a recommendation, research, a record of our trading prices, an offer of, or solicitation for, a transaction in any financial instrument and thus should not be treated as such. The information provided does not involve any specific investment objectives, financial situation, or needs of any specific person who may receive it. Please be aware that past performance is not a reliable indicator of future performance and/or results. Past performance or forward-looking scenarios based upon the reasonable beliefs of the third-party provider are not a guarantee of future performance. Actual results may differ materially from those anticipated in forward-looking or past performance statements. IC Markets makes no representation or warranty and assumes no liability as to the accuracy or completeness of the information provided, nor any loss arising from any investment based on a recommendation, forecast, or any information supplied by any third party.

USDCHF: Bullish Continuation & Long Signal
USDCHF
- Classic bullish formation
- Our team expects pullback
SUGGESTED TRADE:
Swing Trade
Long USDCHF
Entry - 0.8041
Sl - 0.8032
Tp - 0.8058
Our Risk - 1%
Start protection of your profits from lower levels
Disclosure: I am part of Trade Nation's Influencer program and receive a monthly fee for using their TradingView charts in my analysis.
❤️ Please, support our work with like & comment! ❤️

USDCHF H4 | Could We See A bounce From Here?Momentum: Bullish
Price is currently pulling back toward the buy entry, which sits slightly above the 38.2% Fibonacci retracement level.
Buy Entry: 0.8023
Pullback support
Slightly above the 38.2% Fibonacci retracement
Stop Loss: 0.7994
Pullback support
Aligned with the 50% Fibonacci retracement
Take Profit: 0.8066
Pullback resistance
High Risk Investment Warning
Stratos Markets Limited (tradu.com ), Stratos Europe Ltd (tradu.com ):
CFDs are complex instruments and come with a high risk of losing money rapidly due to leverage. 70% of retail investor accounts lose money when trading CFDs with this provider. You should consider whether you understand how CFDs work and whether you can afford to take the high risk of losing your money.
Stratos Global LLC (tradu.com ): Losses can exceed deposits.
Please be advised that the information presented on TradingView is provided to Tradu (‘Company’, ‘we’) by a third-party provider (‘TFA Global Pte Ltd’). Please be reminded that you are solely responsible for the trading decisions on your account. Any information and/or content is intended entirely for research, educational and informational purposes only and does not constitute investment or consultation advice or investment strategy. The information is not tailored to the investment needs of any specific person and therefore does not involve a consideration of any of the investment objectives, financial situation or needs of any viewer that may receive it. Past performance is not a reliable indicator of future results. Actual results may differ materially from those anticipated in forward-looking or past performance statements. We assume no liability as to the accuracy or completeness of any of the information and/or content provided herein and the Company cannot be held responsible for any omission, mistake nor for any loss or damage including without limitation to any loss of profit which may arise from reliance on any information supplied by TFA Global Pte Ltd.

Usdchf downUSD CHF is in downtrend as it got rejection from area of interest by this next week news there will be volume in it
