Forex Trading USDCHF BASIC HH‑LL STRATEGY
1. IDENTIFY TREND – Look for a series of HIGHER HIGHS + HIGHER LOWS (up‑trend) or LOWER LOWS + LOWER HIGHS (down‑trend).
2. ENTRY – Enter long when price breaks above the latest HIGH in an up‑trend; enter short when price breaks below the latest LOW in a down‑trend.
3. STOP LOSS – Place it just below the most recent LOW (for longs) or above the most recent HIGH (for shorts).
4. TARGET – Measure the height of the previous swing and project that distance from the entry point, or use a trailing stop to lock profits as the trend continues.
⚠️ Disclaimer:
This setup is shared for educational purposes only. It is not financial advice. Always do your own analysis and apply proper risk management before trading any setup.
Usdchf!

USD/CHF: Looking for BuyUSD/CHF: Looking for Buy Entry Points from Institutional Levels
Current Situation:
On the USD/CHF chart, price has reached a level where it encountered strong resistance to downward movement. The nature of this halt indicates the presence of a limit player — such reversals are rarely random coincidences.
Primary Scenario:
A price reversal upward is expected from current levels with the formation of buying positions. Potential reversal points are marked on the chart — these are high volume zones where large participants previously showed activity.
Trading Plan:
Consider opportunities to open long positions from the high volume zones displayed on the chart
Entry points form in areas where institutional activity was previously recorded

Bullish bounce off key support?USD/CHF is falling towards this the support level which is a pullback support that is slightly below the 38.2% Fibonacci retracement and could bounce to the our take profit.
Entry: 0.8006
Why we like it:|There is a pullback support that is slightly below the 38.2% Fibonacci retracement
Stop loss: 0.7968
Why we like it:
There is a pullback support that lines up with the 61.8% Fibonacci retracement.
Take profit: 0.8067
Why we like it:
There is a pullback resistance level.
Enjoying your TradingView experience? Review us!
Please be advised that the information presented on TradingView is provided to Vantage (‘Vantage Global Limited’, ‘we’) by a third-party provider (‘Everest Fortune Group’). Please be reminded that you are solely responsible for the trading decisions on your account. There is a very high degree of risk involved in trading. Any information and/or content is intended entirely for research, educational and informational purposes only and does not constitute investment or consultation advice or investment strategy. The information is not tailored to the investment needs of any specific person and therefore does not involve a consideration of any of the investment objectives, financial situation or needs of any viewer that may receive it. Kindly also note that past performance is not a reliable indicator of future results. Actual results may differ materially from those anticipated in forward-looking or past performance statements. We assume no liability as to the accuracy or completeness of any of the information and/or content provided herein and the Company cannot be held responsible for any omission, mistake nor for any loss or damage including without limitation to any loss of profit which may arise from reliance on any information supplied by Everest Fortune Group.

USDCHF: Bullish Continuation & Long Trade
USDCHF
- Classic bullish formation
- Our team expects pullback
SUGGESTED TRADE:
Swing Trade
Long USDCHF
Entry - 0.8041
Sl - 0.8030
Tp - 0.8062
Our Risk - 1%
Start protection of your profits from lower levels
Disclosure: I am part of Trade Nation's Influencer program and receive a monthly fee for using their TradingView charts in my analysis.
❤️ Please, support our work with like & comment! ❤️

USDCHF I Retracement and Potential Long from SupportWelcome back! Let me know your thoughts in the comments!
** USDCHF Analysis - Listen to video!
We recommend that you keep this on your watch list and enter when the entry criteria of your strategy is met.
Please support this idea with a LIKE and COMMENT if you find it useful and Click "Follow" on our profile if you'd like these trade ideas delivered straight to your email in the future.
Thanks for your continued support!

USDCHF uptrend continuation support at 0.8040The USDCHF remains in a bullish trend, with recent price action showing signs of a breakout within the broader uptrend.
Support Zone: 0.8040 – a key level from previous consolidation. Price is currently testing or approaching this level.
A bullish rebound from 0.8040 would confirm ongoing upside momentum, with potential targets at:
0.8105 – initial resistance
0.8125 – psychological and structural level
0.8145 – extended resistance on the longer-term chart
Bearish Scenario:
A confirmed break and daily close below 0.8040 would weaken the bullish outlook and suggest deeper downside risk toward:
0.8013 – minor support
0.8000 – stronger support and potential demand zone
Outlook:
Bullish bias remains intact while the USDCHF holds above 0.8040 A sustained break below this level could shift momentum to the downside in the short term.
This communication is for informational purposes only and should not be viewed as any form of recommendation as to a particular course of action or as investment advice. It is not intended as an offer or solicitation for the purchase or sale of any financial instrument or as an official confirmation of any transaction. Opinions, estimates and assumptions expressed herein are made as of the date of this communication and are subject to change without notice. This communication has been prepared based upon information, including market prices, data and other information, believed to be reliable; however, Trade Nation does not warrant its completeness or accuracy. All market prices and market data contained in or attached to this communication are indicative and subject to change without notice.

Market Analysis: USD/CHF Coils for Next MoveMarket Analysis: USD/CHF Coils for Next Move
USD/CHF climbed higher above 0.8050 and might correct some gains.
Important Takeaways for USD/CHF Analysis Today
- USD/CHF climbed higher above 0.8050 and 0.8080 before it faced hurdles.
- There was a break below a bullish trend line with support at 0.8085 on the hourly chart.
USD/CHF Technical Analysis
On the hourly chart of USD/CHF, the pair started a decent increase from 0.7940. The US Dollar climbed above the 0.8000 handle against the Swiss Franc.
The bulls were able to pump the pair above the 50-hour simple moving average and 0.8050. Finally, the pair tested 0.8100. A high was formed near 0.8101 and the pair is now consolidating gains. The pair dipped below the 23.6% Fib retracement level of the upward move from the 0.7937 swing low to the 0.8101 high.
Besides, there was a break below a bullish trend line at 0.8085. On the downside, immediate support on the USD/CHF chart is near 0.8040. The first key area of interest might be near the 50% Fib retracement at 0.8020.
A downside break below 0.8020 might call for a drop to 0.7975. Any more losses may possibly open the doors for a move toward 0.7940.
On the upside, the pair could struggle near 0.8080. The first major barrier for bulls is 0.8100. If there is a clear break above 0.8100 and the RSI climbs above 50, the pair could start another increase. In the stated case, it could test 0.8150.
This article represents the opinion of the Companies operating under the FXOpen brand only. It is not to be construed as an offer, solicitation, or recommendation with respect to products and services provided by the Companies operating under the FXOpen brand, nor is it to be considered financial advice.

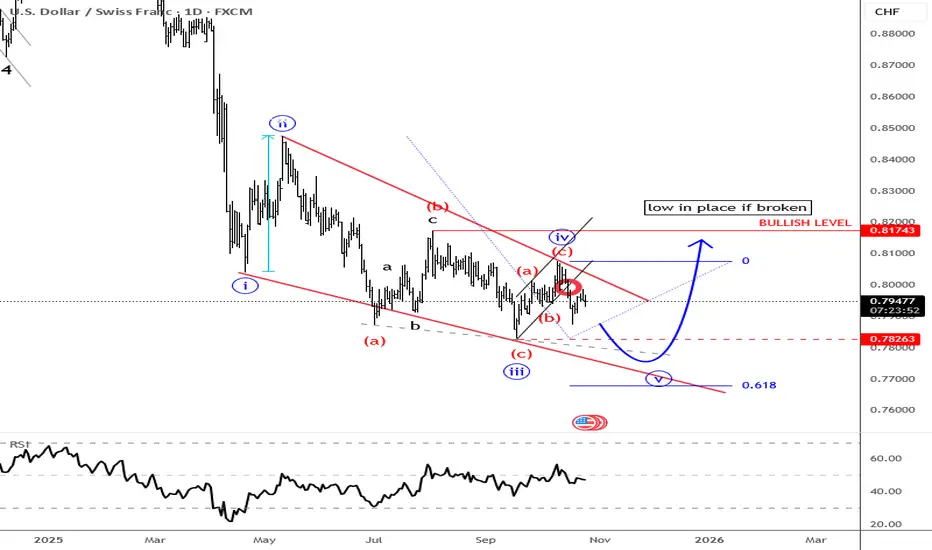
USDCHF Forming An Elliott Wave Ending DiagonalUSDCHF has made a nice and interesting recovery since September, but so far only in three waves, with a recent reversal down from around the 0.8070 area, so recovery might have been just another corrective rally within an incomplete downtrend. As we know, if we don’t see five waves up from the lows, then the bottom is likely not in place yet. In fact, if current prices break the channel support and move through 0.7940, we should be aware of a possible retest of the 2025 lows, which could be the final leg within a higher-degree ending diagonal. Also keep in mind that USDCHF could still move lower even in a risk-off mode, as the Swiss franc tends to act as a safe haven in times of uncertainty. However, if we see a sudden and very strong franc in the weeks ahead, the Swiss National Bank could step in and take action to prevent it from rising too far, as they already expressed some concern about that in recent statements.
Bullish continuation?Swissie (USD/CHF) could make a short-term pullback to the pivot and could bounce to the swing high resistance.
Pivot: 0.8030
1st Support: 0.7987
1st Resistance: 0.8109
Disclaimer:
The opinions given above constitute general market commentary and do not constitute the opinion or advice of IC Markets or any form of personal or investment advice.
Any opinions, news, research, analyses, prices, other information, or links to third-party sites contained on this website are provided on an "as-is" basis, are intended to be informative only, and are not advice, a recommendation, research, a record of our trading prices, an offer of, or solicitation for, a transaction in any financial instrument and thus should not be treated as such. The information provided does not involve any specific investment objectives, financial situation, or needs of any specific person who may receive it. Please be aware that past performance is not a reliable indicator of future performance and/or results. Past performance or forward-looking scenarios based upon the reasonable beliefs of the third-party provider are not a guarantee of future performance. Actual results may differ materially from those anticipated in forward-looking or past performance statements. IC Markets makes no representation or warranty and assumes no liability as to the accuracy or completeness of the information provided, nor any loss arising from any investment based on a recommendation, forecast, or any information supplied by any third party.

Bullish momentum to extend?USD/CHF has bounced off the support level which is a pullback support and could potentially rise from this level to our take profit.
Entry: 0.8065
Why we like it:
There is a pullback support level.
Stop loss: 0.8037
Why we like it:
There is a pullback support level.
Take profit: 0.8123
Why we like it:
There is a swing high resistance level.
Enjoying your TradingView experience? Review us!
Please be advised that the information presented on TradingView is provided to Vantage (‘Vantage Global Limited’, ‘we’) by a third-party provider (‘Everest Fortune Group’). Please be reminded that you are solely responsible for the trading decisions on your account. There is a very high degree of risk involved in trading. Any information and/or content is intended entirely for research, educational and informational purposes only and does not constitute investment or consultation advice or investment strategy. The information is not tailored to the investment needs of any specific person and therefore does not involve a consideration of any of the investment objectives, financial situation or needs of any viewer that may receive it. Kindly also note that past performance is not a reliable indicator of future results. Actual results may differ materially from those anticipated in forward-looking or past performance statements. We assume no liability as to the accuracy or completeness of any of the information and/or content provided herein and the Company cannot be held responsible for any omission, mistake nor for any loss or damage including without limitation to any loss of profit which may arise from reliance on any information supplied by Everest Fortune Group.

USDCHF - Getting OverBought!📈USDCHF remains overall bullish in the medium term , but price is now approaching a major confluence resistance where caution is needed. The upper bound of the wedge pattern lines up perfectly with the red supply zone, an area that has rejected price multiple times in the past.
📉As USDCHF moves into this intersection, we will be looking for sell setups, expecting the bears to step in and defend this zone. A rejection from here could trigger a corrective move back toward the lower trendline and the green support zone.
Only a clean break and hold above the red zone would invalidate the bearish outlook and allow the bullish momentum to continue.
For now, sellers have the upper hand as we approach this key resistance… will they take control again? 🤔
⚠️ Disclaimer: This is not financial advice. Always do your own research and manage risk properly.
📚 Stick to your trading plan regarding entries, risk, and management.
Good luck! 🍀
All Strategies Are Good; If Managed Properly!
~Richard Nasr

USD/CHF Consolidates Within Prolonged RangeUSD/CHF continues to trade within a well-defined horizontal range between approximately 0.7850 and 0.8100, showing limited directional momentum over recent months. The pair’s repeated rejections from both upper and lower boundaries highlight market indecision and equilibrium between buyers and sellers.
The 50-day simple moving average (SMA) near 0.7987 has acted as a median line within the range, while the 200-day SMA around 0.8218 remains well above current price, signaling that the broader trend bias is still neutral to slightly bearish. The MACD is marginally above the signal line, suggesting mild bullish momentum, though not yet sufficient to confirm a breakout. Meanwhile, the RSI hovers around 59, reflecting improving sentiment without reaching overbought conditions.
For now, USD/CHF remains confined within its established consolidation structure. A decisive close above 0.8100 would indicate a potential shift in momentum, while a move below 0.7850 would reaffirm range continuity or open the door to renewed weakness.
-MW

USDCHF breakout reaching resistance at 0.8105The USDCHF remains in a bullish trend, with recent price action showing signs of a breakout within the broader uptrend.
Support Zone: 0.8040 – a key level from previous consolidation. Price is currently testing or approaching this level.
A bullish rebound from 0.8040 would confirm ongoing upside momentum, with potential targets at:
0.8105 – initial resistance
0.8125 – psychological and structural level
0.8145 – extended resistance on the longer-term chart
Bearish Scenario:
A confirmed break and daily close below 0.8040 would weaken the bullish outlook and suggest deeper downside risk toward:
0.8013 – minor support
0.8000 – stronger support and potential demand zone
Outlook:
Bullish bias remains intact while the USDCHF holds above 0.8040 A sustained break below this level could shift momentum to the downside in the short term.
This communication is for informational purposes only and should not be viewed as any form of recommendation as to a particular course of action or as investment advice. It is not intended as an offer or solicitation for the purchase or sale of any financial instrument or as an official confirmation of any transaction. Opinions, estimates and assumptions expressed herein are made as of the date of this communication and are subject to change without notice. This communication has been prepared based upon information, including market prices, data and other information, believed to be reliable; however, Trade Nation does not warrant its completeness or accuracy. All market prices and market data contained in or attached to this communication are indicative and subject to change without notice.

usdchf looking bearishbreaking rising wedge, successful breakout can lead 60 to 70 pips bearish rally soon

USD/CHF BULLS ARE GAINING STRENGTH|LONG
Hello, Friends!
USD/CHF is trending up which is clear from the green colour of the previous weekly candle. However, the price has locally plunged into the oversold territory. Which can be told from its proximity to the BB lower band. Which presents a classical trend following opportunity for a long trade from the support line below towards the supply level of 0.806.
Disclosure: I am part of Trade Nation's Influencer program and receive a monthly fee for using their TradingView charts in my analysis.
✅LIKE AND COMMENT MY IDEAS✅

Weekly FOREX Forecast: USDCAD, USDCHF & USDJPY Are Bullish!Welcome to Part 2 of The Weekly FOREX FORECAST!
Part 1 covered USD, EU, GU, AU, NU in the previous video.
In this video, we will analyze the following FX markets:
USD Index, USDCAD, USDCHF, and USDJPY.
Enjoy!
May profits be upon you.
Leave any questions or comments in the comment section.
I appreciate any feedback from my viewers!
Like and/or subscribe if you want more accurate analysis.
Thank you so much!
Disclaimer:
I do not provide personal investment advice and I am not a qualified licensed investment advisor.
All information found here, including any ideas, opinions, views, predictions, forecasts, commentaries, suggestions, expressed or implied herein, are for informational, entertainment or educational purposes only and should not be construed as personal investment advice. While the information provided is believed to be accurate, it may include errors or inaccuracies.
I will not and cannot be held liable for any actions you take as a result of anything you read here.
Conduct your own due diligence, or consult a licensed financial advisor or broker before making any and all investment decisions. Any investments, trades, speculations, or decisions made on the basis of any information found on this channel, expressed or implied herein, are committed at your own risk, financial or otherwise.

USDCHF: Bullish CRT CycleThe Narrative: The market has completed the accumulation phase at the lows. We have a confirmed CRTL + TS (Turtle Soup) at 0.80417. This sweep of the lows indicates that sell-side liquidity has been harvested, and the "fuel" for the move up has been gathered.
The Technical Setup:
1. The Trap (Turtle Soup): Price stabbed into the Range Low (CRTL) and reversed. In CRT, this "Turtle Soup" creates a false breakdown to trap sellers. "Turtle soup = explosive moves!".
2. The Entry Zone (FVG): After the initial bounce, price created a Bullish Fair Value Gap (FVG). I am waiting for a retracement into this zone (marked in grey). This allows us to enter at a "Discount" price alongside smart money before the expansion continues.
3. The Draw on Liquidity (Target): The market naturally seeks to rotate from range low to range high. Our target is the CRTH (Candle Range Theory High) at the top of the structure.
Execution Plan:
WAIT: For price to dip into the FVG (approx. 0.80600).
TRIGGER: Watch for a Bullish Model #1 confirmation inside the FVG.
TARGET: The unmitigated highs at CRTH.

USDCHF WILL KEEP GROWING|LONG|
✅USDCHF taps the demand block and shows displacement, suggesting bullish order-flow returning after liquidity sweep beneath the short-term low. Expect a corrective pullback into the imbalance before targeting the higher buy-side liquidity. Time Frame 1H.
LONG🚀
✅Like and subscribe to never miss a new idea!✅

USDCHF Idea 23.11For chf, I see two scenarios, one is currently as close as the other, and that is a short position at the level around 0.8, where the daily level is nearby, and the vwap condition can be met even when the price reaches the poc level.the second most distant scenario and at this moment even less probable is a long position at the val level which is at the level of 0.786, whether it will be a beautiful range, we will see

USDCHF - D1✅ Overall Market Structure
The pair is in a broad sideways / corrective structure, with price oscillating between the 0.8130–0.8097 supply zone (red zone) and the 0.7967 demand zone (blue line).
Momentum shows lower highs and lower lows, signaling a macro bearish bias despite the recent short-term bullish corrective leg.

USD/CHF – Short Position📉 USD/CHF – Short Position
Entry: 0.80500
Stop Loss: 0.80800
Take Profit: 0.79000
Explanation:
Price tapped into a strong supply zone after a bullish correction and produced a clear BOS to the downside, confirming bearish order flow. The entry aligns with mitigation of the last bearish OB, with liquidity swept above the previous highs. Targeting the unmitigated demand zone below for a clean RR.

USDCHF H4 | Potential Bullish Bounce OffMomentum: Bullish
The price has already bounced off the buy entry which is swing low support.
Buy entry: 0.7892
Swing low support
Stop loss: 0.7856
Swing low support
Take profit: 0.8007
Pullback resistance
50% Fibonacci retracement
High Risk Investment Warning
Stratos Markets Limited (tradu.com ), Stratos Europe Ltd (tradu.com ):
CFDs are complex instruments and come with a high risk of losing money rapidly due to leverage. 70% of retail investor accounts lose money when trading CFDs with this provider. You should consider whether you understand how CFDs work and whether you can afford to take the high risk of losing your money.
Stratos Global LLC (tradu.com ): Losses can exceed deposits.
Please be advised that the information presented on TradingView is provided to Tradu (‘Company’, ‘we’) by a third-party provider (‘TFA Global Pte Ltd’). Please be reminded that you are solely responsible for the trading decisions on your account. Any information and/or content is intended entirely for research, educational and informational purposes only and does not constitute investment or consultation advice or investment strategy. The information is not tailored to the investment needs of any specific person and therefore does not involve a consideration of any of the investment objectives, financial situation or needs of any viewer that may receive it. Past performance is not a reliable indicator of future results. Actual results may differ materially from those anticipated in forward-looking or past performance statements. We assume no liability as to the accuracy or completeness of any of the information and/or content provided herein and the Company cannot be held responsible for any omission, mistake nor for any loss or damage including without limitation to any loss of profit which may arise from reliance on any information supplied by TFA Global Pte Ltd.

USDCHF H4 | Bearish Reversal Off Pullback ResistanceMomentum: Bearish
Price is pulling back toward the sell entry, which aligns with the 61.8% Fibonacci retracement.
Sell Entry: 0.8043
Pullback resistance
61.8% Fibonacci retracement
Stop Loss: 0.81127
Swing-high resistance
Take Profit: 0.7944
Pullback support
High Risk Investment Warning
Stratos Markets Limited (tradu.com ), Stratos Europe Ltd (tradu.com ):
CFDs are complex instruments and come with a high risk of losing money rapidly due to leverage. 70% of retail investor accounts lose money when trading CFDs with this provider. You should consider whether you understand how CFDs work and whether you can afford to take the high risk of losing your money.
Stratos Global LLC (tradu.com ): Losses can exceed deposits.
Please be advised that the information presented on TradingView is provided to Tradu (‘Company’, ‘we’) by a third-party provider (‘TFA Global Pte Ltd’). Please be reminded that you are solely responsible for the trading decisions on your account. Any information and/or content is intended entirely for research, educational and informational purposes only and does not constitute investment or consultation advice or investment strategy. The information is not tailored to the investment needs of any specific person and therefore does not involve a consideration of any of the investment objectives, financial situation or needs of any viewer that may receive it. Past performance is not a reliable indicator of future results. Actual results may differ materially from those anticipated in forward-looking or past performance statements. We assume no liability as to the accuracy or completeness of any of the information and/or content provided herein and the Company cannot be held responsible for any omission, mistake nor for any loss or damage including without limitation to any loss of profit which may arise from reliance on any information supplied by TFA Global Pte Ltd.
