USDCHF H4 | Bullish ReversalThe price could fall towards our buy entry level at 0.7694, which is a pullback support.
Our stop loss is set at 0.7604, which is a swing low support.
Our take profit is set at 0.7861, which is a pullback resistance that is slightly below the 61.8% Fibonacci retracement.
High Risk Investment Warning
Stratos Markets Limited fxcm.com Stratos Europe Ltd fxcm.com
CFDs are complex instruments and come with a high risk of losing money rapidly due to leverage. 69% of retail investor accounts lose money when trading CFDs with this provider. You should consider whether you understand how CFDs work and whether you can afford to take the high risk of losing your money.
Stratos Global LLC fxcm.com Losses can exceed deposits.
Please be advised that the information presented on TradingView is provided to FXCM (‘Company’, ‘we’) by a third-party provider (‘TFA Global Pte Ltd’). Please be reminded that you are solely responsible for the trading decisions on your account. Any information and/or content is intended entirely for research, educational and informational purposes only and does not constitute investment or consultation advice or investment strategy. The information is not tailored to the investment needs of any specific person and therefore does not involve a consideration of any of the investment objectives, financial situation or needs of any viewer that may receive it. Past performance is not a reliable indicator of future results. Actual results may differ materially from those anticipated in forward-looking or past performance statements. We assume no liability as to the accuracy or completeness of any of the information and/or content provided herein and the Company cannot be held responsible for any omission, mistake nor for any loss or damage including without limitation to any loss of profit which may arise from reliance on any information supplied by TFA Global Pte Ltd.
Stratos Trading Pty. Limited fxcm.com
Trading FX/CFDs carries significant risks. FXCM AU (AFSL 309763), please read the Financial Services Guide, Product Disclosure Statement, Target Market Determination and Terms of Business at fxcm.com
USDCHF

Bearish continuation setup?Swissie (USD/CHF) is rising towards the pivot, which acts as a pullback resistance and could reverse to the 1st support.
Pivot: 0.7899
1st Support: 0.7607
1st Resistance: 0.8145
Disclaimer:
The opinions given above constitute general market commentary and do not constitute the opinion or advice of IC Markets or any form of personal or investment advice.
Any opinions, news, research, analyses, prices, other information, or links to third-party sites contained on this website are provided on an "as-is" basis, are intended to be informative only, and are not advice, a recommendation, research, a record of our trading prices, an offer of, or solicitation for, a transaction in any financial instrument and thus should not be treated as such. The information provided does not involve any specific investment objectives, financial situation, or needs of any specific person who may receive it. Please be aware that past performance is not a reliable indicator of future performance and/or results. Past performance or forward-looking scenarios based upon the reasonable beliefs of the third-party provider are not a guarantee of future performance. Actual results may differ materially from those anticipated in forward-looking or past performance statements. IC Markets makes no representation or warranty and assumes no liability as to the accuracy or completeness of the information provided, nor any loss arising from any investment based on a recommendation, forecast, or any information supplied by any third party

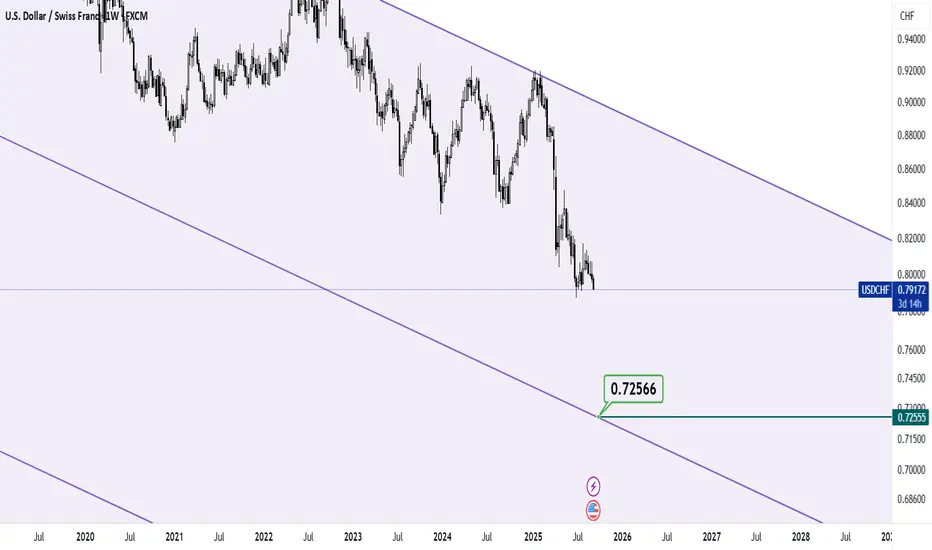
I have an interesting question: Will USDCHF go back to 2011?USDCHF continues to persist in its long-term downward trend since 1970, and any bullish break in this chart has been a good opportunity to sell this symbol, and it seems that the price range formed in 2011 can be considered as a price target in the future.
Potential bullish rise?USD/CHF could fall towards the support level, which is a pullback support, and could bounce from this level to our take profit.
Entry: 0.7696
Why we like it:
There is a pullback support level.
Stop loss: 0.7599
Why we like it:
There is a swing low support level.
Take profit: 0.7828
Why we like it:
There is a pullback resistance level that aligns with the 50% Fibonacci retracement.
Enjoying your TradingView experience? Review us!
Please be advised that the information presented on TradingView is provided to Vantage (‘Vantage Global Limited’, ‘we’) by a third-party provider (‘Everest Fortune Group’). Please be reminded that you are solely responsible for the trading decisions on your account. There is a very high degree of risk involved in trading. Any information and/or content is intended entirely for research, educational and informational purposes only and does not constitute investment or consultation advice or investment strategy. The information is not tailored to the investment needs of any specific person and therefore does not involve a consideration of any of the investment objectives, financial situation or needs of any viewer that may receive it. Kindly also note that past performance is not a reliable indicator of future results. Actual results may differ materially from those anticipated in forward-looking or past performance statements. We assume no liability as to the accuracy or completeness of any of the information and/or content provided herein and the Company cannot be held responsible for any omission, mistake nor for any loss or damage including without limitation to any loss of profit which may arise from reliance on any information supplied by Everest Fortune Group.

USDCHF FREE SIGNAL|SHORT|
✅USDCHF taps premium supply after buy-side liquidity run. Bearish displacement and rejection from the zone suggest mitigation in play, favoring a downside move toward resting sell-side liquidity.
—————————
Entry: 0.7732
Stop Loss: 0.7751
Take Profit: 0.7704
Time Frame: 2H
—————————
SHORT🔥
✅Like and subscribe to never miss a new idea!✅

USDCHF: Short Signal Explained
USDCHF
- Classic bearish pattern
- Our team expects retracement
SUGGESTED TRADE:
Swing Trade
Sell USDCHF
Entry - 0.7730
Stop - 0.7744
Take - 0.7699
Our Risk - 1%
Start protection of your profits from lower levels
Disclosure: I am part of Trade Nation's Influencer program and receive a monthly fee for using their TradingView charts in my analysis.
❤️ Please, support our work with like & comment! ❤️

USD-CHF Local Short! Sell!
Hello,Traders!
USDCHF is tapping into a well-defined supply zone after a corrective pullback. Bearish order flow remains intact, with weak demand below and liquidity resting underneath recent lows. Expect rejection and continuation lower. Time Frame 2H.
Sell!
Comment and subscribe to help us grow!
Check out other forecasts below too!
Disclosure: I am part of Trade Nation's Influencer program and receive a monthly fee for using their TradingView charts in my analysis.

USDCHF M30 | Bullish Bounce Off Pullback SupportMomentum: Bullish
Price is currently above the ichimoku cloud.
Buy entry: 0.76648
- Pullback support
- 61.8% Fib retracement
- 78.6% Fib projection
Stop Loss: 0.76482
- Swing low support
Take Profit: 0.76847
- Swing high resistance
High Risk Investment Warning
Stratos Markets Limited (fxcm.com/uk), Stratos Europe Ltd (fxcm.com/eu):
CFDs are complex instruments and come with a high risk of losing money rapidly due to leverage. 69% of retail investor accounts lose money when trading CFDs with this provider. You should consider whether you understand how CFDs work and whether you can afford to take the high risk of losing your money.
Stratos Global LLC (fxcm.com/en): Losses can exceed deposits.
Please be advised that the information presented on TradingView is provided to FXCM (‘Company’, ‘we’) by a third-party provider (‘TFA Global Pte Ltd’). Please be reminded that you are solely responsible for the trading decisions on your account. Any information and/or content is intended entirely for research, educational and informational purposes only and does not constitute investment or consultation advice or investment strategy. The information is not tailored to the investment needs of any specific person and therefore does not involve a consideration of any of the investment objectives, financial situation or needs of any viewer that may receive it. Past performance is not a reliable indicator of future results. Actual results may differ materially from those anticipated in forward-looking or past performance statements. We assume no liability as to the accuracy or completeness of any of the information and/or content provided herein and the Company cannot be held responsible for any omission, mistake nor for any loss or damage including without limitation to any loss of profit which may arise from reliance on any information supplied by TFA Global Pte Ltd.
Stratos Trading Pty. Limited (fxcm.com/au):
Trading FX/CFDs carries significant risks. FXCM AU (AFSL 309763), please read the Financial Services Guide, Product Disclosure Statement, Target Market Determination and Terms of Business at fxcm.com/au

USDCHF Is Going Down! Short!
Please, check our technical outlook for USDCHF.
Time Frame: 4h
Current Trend: Bearish
Sentiment: Overbought (based on 7-period RSI)
Forecast: Bearish
The market is trading around a solid horizontal structure 0.768.
The above observations make me that the market will inevitably achieve 0.758 level.
P.S
Overbought describes a period of time where there has been a significant and consistent upward move in price over a period of time without much pullback.
Like and subscribe and comment my ideas if you enjoy them!

USDCHF - 4H - LongThe price perfectly fulfilled the initial forecast until reaching the target of BB, which coincides perfectly with the Demand zone and OV. From here we expected a reaction in the upward direction for a correction and the first target is the Supply zone, after which we expect it to be broken and continue in the upward direction until reaching the OTE zone + closing the Gap above the Supply zone.

USDCHF H4 – Bullish Reversal SetupUSDCHF H4 – Buy (Reversal) After a strong fall, price bounced from 0.76080 support.
RSI was previously 19–13 (oversold), now at 37.00 – sign a bullish reversal.
Price is now pushing upwards.
Entry: 0.76830
TP1: 0.77777
TP2: 0.79000
Final TP: 0.80300 (Resistance Zone)
Disclaimer:
This analysis is for educational purposes only. It is not financial advice. Trading involves risk, so always do your own research and manage risk properly before taking any trade.

USDCHFUSDCHF
- Bearish Channel as an corrective pattern in Short Time Frame
- Break of Structure
- RSI - Divergence
- Completed " 123 " Impulsive Waves
- Fibonacci Level - 38.20% / 50.00%

Stop!Loss|Market View: USDJPY🙌 Stop!Loss team welcomes you❗️
In this post, we're going to talk about the near-term outlook for the USDJPY currency pair☝️
Potential trade setup:
🔔Entry level: 153.102
💰TP: 151.009
⛔️SL: 154.358
"Market View" - a brief analysis of trading instruments, covering the most important aspects of the FOREX market.
👇 In the comments 👇 you can type the trading instrument you'd like to analyze, and we'll talk about it in our next posts.
💬 Description: The USD remains susceptible to selling due primarily to geopolitical risks, and yesterday's Federal Reserve results were perceived by the market as unfavorable for the American currency. This trend will likely persist until the end of the week, but special attention should be paid to today's and especially tomorrow's US session. Profit-taking is likely before the weekend.
Thanks for your support 🚀
Profits for all ✅

Could we see a reversal from here?USD/CHF has bounced off the support level, which is a pullback support, and could potentially rise from this level to our take profit.
Entry: 0.7666
Why we like it:
There is a pullback support level.
Stop loss: 0.7599
Why we like it:
There is a pullback support level.
Take profit: 0.7792
Why we like it:
There is a pullback resistance level that aligns with the 50% Fibonacci retracement.
Enjoying your TradingView experience? Review us!
TradingView (www.tradingview.com)
Please be advised that the information presented on TradingView is provided to Vantage (‘Vantage Global Limited’, ‘we’) by a third-party provider (‘Everest Fortune Group’). Please be reminded that you are solely responsible for the trading decisions on your account. There is a very high degree of risk involved in trading. Any information and/or content is intended entirely for research, educational and informational purposes only and does not constitute investment or consultation advice or investment strategy. The information is not tailored to the investment needs of any specific person and therefore does not involve a consideration of any of the investment objectives, financial situation or needs of any viewer that may receive it. Kindly also note that past performance is not a reliable indicator of future results. Actual results may differ materially from those anticipated in forward-looking or past performance statements. We assume no liability as to the accuracy or completeness of any of the information and/or content provided herein and the Company cannot be held responsible for any omission, mistake nor for any loss or damage including without limitation to any loss of profit which may arise from reliance on any information supplied by Everest Fortune Group.

USDCHF previous support = new resistance The USDCHF currency pair continues to display a bearish outlook, in line with the prevailing downward trend. Recent price action suggests a corrective pullback, potentially setting up for another move lower if resistance holds.
Key Level: 0.7800
This zone, previously a consolidation area, now acts as a significant resistance level.
Bearish Scenario (rejection at 0.7800):
A failed test and rejection at 0.7800 would likely resume the bearish momentum.
Downside targets include:
0.7600 – Initial support
0.7550 – Intermediate support
0.7480 – Longer-term support level
Bullish Scenario (breakout above 0.7800):
A confirmed breakout and daily close above 0.7800 would invalidate the bearish setup.
In that case, potential upside resistance levels are:
0.7870 – First resistance
0.7910 – Further upside target
Conclusion
USDCHF remains under bearish pressure, with the 0.7800 level acting as a key inflection point. As long as price remains below this level, the bias favors further downside. Traders should watch for price confirmation around that level to assess the next move.
This communication is for informational purposes only and should not be viewed as any form of recommendation as to a particular course of action or as investment advice. It is not intended as an offer or solicitation for the purchase or sale of any financial instrument or as an official confirmation of any transaction. Opinions, estimates and assumptions expressed herein are made as of the date of this communication and are subject to change without notice. This communication has been prepared based upon information, including market prices, data and other information, believed to be reliable; however, Trade Nation does not warrant its completeness or accuracy. All market prices and market data contained in or attached to this communication are indicative and subject to change without notice.

USD/CHF: How low will it go?The USD/CHF has bounced back today with other major pairs also showing similar moves, ahead of the FOMC rate decision. But there is no denying that the bearish trend has gathered momentum in recent days, with the Swiss franc coming out on top as one of the most attractive currencies out there despite zero interest rate in Switzerland. The currency is providing significant challenges to Switzerland’s central bank. The Swiss National Bank has cut rates to zero already and there is little further it can do to help reduce the chances of deflation. Swiss franc remains in strong demand, both as a hedge against dollar debasement and as a broader fiscal risk premium trade. Investors are increasing becoming convinced that the SNB may be forced to take rates back into negative territory later this year. A potential drop to 0.75 could accelerate that move.
Key levels shown on the chart.
By Fawad Razaqzada, market analyst with FOREX.com

USDCHF Will Go Higher From Support! Buy!
Here is our detailed technical review for USDCHF.
Time Frame: 1h
Current Trend: Bullish
Sentiment: Oversold (based on 7-period RSI)
Forecast: Bullish
The price is testing a key support 0.767.
Current market trend & oversold RSI makes me think that buyers will push the price. I will anticipate a bullish movement at least to 0.775 level.
P.S
We determine oversold/overbought condition with RSI indicator.
When it drops below 30 - the market is considered to be oversold.
When it bounces above 70 - the market is considered to be overbought.
Like and subscribe and comment my ideas if you enjoy them!

Market Analysis: USD/CHF BucklesMarket Analysis: USD/CHF Buckles
USD/CHF declined further and is now struggling below 0.7750.
Important Takeaways for USD/CHF Analysis Today
- USD/CHF declined below the 0.7800 and 0.7750 support levels.
- There is a key bearish trend line forming with resistance near 0.7675 on the hourly chart.
USD/CHF Technical Analysis
On the hourly chart of USD/CHF, the pair started a fresh decline from well above 0.7880. The US Dollar dropped below 0.7800 to move into a negative zone against the Swiss Franc.
The bears pushed the pair below the 50-hour simple moving average and 0.7750. Finally, the bulls appeared near 0.7600. A low was formed near 0.7600, and the pair is now consolidating losses. There was a minor recovery toward the 23.6% Fib retracement level of the downward move from the 0.7914 swing high to the 0.7600 low.
On the upside, the pair could face bears near 0.7675 and a key bearish trend line. The first major resistance sits near the 50-hour simple moving average at 0.7740. The main barrier for an upside break could be near the 61.8% Fib retracement at 0.7795.
A daily close above 0.7795 could start a fresh increase. In the stated case, the pair could rise toward 0.7885. The next stop for the bulls might be 0.7915.
On the downside, immediate support on the USD/CHF chart is 0.7600. The first major breakdown zone could be 0.7565. A close below 0.7565 might send the pair to 0.7730. Any more losses may possibly open the doors for a move toward 0.7700 in the coming days.
This article represents the opinion of the Companies operating under the FXOpen brand only. It is not to be construed as an offer, solicitation, or recommendation with respect to products and services provided by the Companies operating under the FXOpen brand, nor is it to be considered financial advice.

usd chf long swing trade possibleusd chf had massive selling and this is the zone where we can long with small sl this is only analysis not a buy sell advice

USDCHF Oversold and approaching an 11-year Low.The USDCHF pair has been trading within a Channel Down since its November 2022 High rejection on the 1M MA200 (orange trend-line). This month isn't only approaching the bottom of that pattern but also Support 1, which consists of the January 2015 Low (0.74250).
With the 1M RSI almost oversold and similar to December 2020 (every oversold 1M RSI has historically been a massive long-term buy signal), we don't technically believe that this decline has much more room to extend to, beyond at least the -17.86% of the previous Bearish Leg.
Instead, we treat this as an excellent long-term buy opportunity, with a first Target on the 0.5 Fibonacci retracement level (again similar as the previous Channel Down rebound) at 0.83450. Note that this is more suited to long-term investors and not shorter term traders.
---
** Please LIKE 👍, FOLLOW ✅, SHARE 🙌 and COMMENT ✍ if you enjoy this idea! Also share your ideas and charts in the comments section below! This is best way to keep it relevant, support us, keep the content here free and allow the idea to reach as many people as possible. **
---
💸💸💸💸💸💸
👇 👇 👇 👇 👇 👇

USD/CHF Approaching Breakdown from RangeUSD/CHF is moving in a sideways corrective pattern, not a strong trend. The price is forming an A-B-C-D-E structure, which usually happens before the market makes a bigger move. Right now, price is in the last part of this pattern (wave E) and is sitting near a resistance area, where it has failed to move higher and has started to turn down. This behavior often means sellers are becoming stronger. As long as the price stays below 0.795–0.798 , the outlook remains bearish, and the market is expected to move lower toward the 0.782–0.775 support area. If this move happens, it would complete the corrective pattern after a short pause, and then the market can decide its next big direction.
Stay tuned!
@Money_Dictators
Thank you :)

Potential bearish continuation?USD/CHF is rising towards the resistance level, which is a pullback resistance that aligns with the 38.2% Fibonacci retracement and could reverse from this level to our take profit.
Entry: 0.7851
Why we like it:
There is a pullback resistance level that aligns with the 38.2% Fibonacci retracement.
Stop loss: 0.7918
Why we like it:
There is a pullback resistance that aligns with the 61.8% Fibonacci retracement.
Take profit: 0.7733
Why we like it:
There is a pullback support level.
Enjoying your TradingView experience? Review us!
Please be advised that the information presented on TradingView is provided to Vantage (‘Vantage Global Limited’, ‘we’) by a third-party provider (‘Everest Fortune Group’). Please be reminded that you are solely responsible for the trading decisions on your account. There is a very high degree of risk involved in trading. Any information and/or content is intended entirely for research, educational and informational purposes only and does not constitute investment or consultation advice or investment strategy. The information is not tailored to the investment needs of any specific person and therefore does not involve a consideration of any of the investment objectives, financial situation or needs of any viewer that may receive it. Kindly also note that past performance is not a reliable indicator of future results. Actual results may differ materially from those anticipated in forward-looking or past performance statements. We assume no liability as to the accuracy or completeness of any of the information and/or content provided herein and the Company cannot be held responsible for any omission, mistake nor for any loss or damage including without limitation to any loss of profit which may arise from reliance on any information supplied by Everest Fortune Group.

USDCHF bearish continuation below 0.7870 resistanceThe USDCHF pair is currently trading with a bearish bias. Recent price action shows a further pullback and the loss of support within the uptrend.
Key resistance is located at 0.7870, a prior consolidation zone. This level will be critical in determining the next directional move.
A bearish rejection from 0.7870 could confirm the resumption of the downtrend, targeting the next support levels at 0.7720, followed by 0.7680 and 0.7635 over a longer timeframe.
Conversely, a decisive breakout and daily close above 0.7870 would invalidate the current bearish setup, shifting sentiment to bullish and potentially triggering a move towards 0.7910, then 0.7955.
Conclusion:
The short-term outlook remains bearish unless the pair breaks and holds above 0.7870. Traders should watch for price action signals around this key level to confirm direction. A rejection favours fresh downside continuation, while a breakout signals a potential trend reversal or deeper correction.
This communication is for informational purposes only and should not be viewed as any form of recommendation as to a particular course of action or as investment advice. It is not intended as an offer or solicitation for the purchase or sale of any financial instrument or as an official confirmation of any transaction. Opinions, estimates and assumptions expressed herein are made as of the date of this communication and are subject to change without notice. This communication has been prepared based upon information, including market prices, data and other information, believed to be reliable; however, Trade Nation does not warrant its completeness or accuracy. All market prices and market data contained in or attached to this communication are indicative and subject to change without notice.
