Bearish reversal?Swissie (USD/CHF) is rising towards the pivot, which is a pullback resistance and could reverse to the 1st support, which has been identified as a multi-swing low support.
1st Support: 0.7990
1st Support: 0.7855
1st Resistance: 0.81041
Disclaimer:
The opinions given above constitute general market commentary and do not constitute the opinion or advice of IC Markets or any form of personal or investment advice.
Any opinions, news, research, analyses, prices, other information, or links to third-party sites contained on this website are provided on an "as-is" basis, are intended to be informative only, and are not advice, a recommendation, research, a record of our trading prices, an offer of, or solicitation for, a transaction in any financial instrument and thus should not be treated as such. The information provided does not involve any specific investment objectives, financial situation, or needs of any specific person who may receive it. Please be aware that past performance is not a reliable indicator of future performance and/or results. Past performance or forward-looking scenarios based upon the reasonable beliefs of the third-party provider are not a guarantee of future performance. Actual results may differ materially from those anticipated in forward-looking or past performance statements. IC Markets makes no representation or warranty and assumes no liability as to the accuracy or completeness of the information provided, nor any loss arising from any investment based on a recommendation, forecast, or any information supplied by any third party
USDCHF

USD/CHF BEARS ARE STRONG HERE|SHORT
Hello, Friends!
USD/CHF is trending down which is clear from the red colour of the previous weekly candle. However, the price has locally surged into the overbought territory. Which can be told from its proximity to the BB upper band. Which presents a classical trend following opportunity for a short trade from the resistance line above towards the demand level of 0.784.
Disclosure: I am part of Trade Nation's Influencer program and receive a monthly fee for using their TradingView charts in my analysis.
✅LIKE AND COMMENT MY IDEAS✅

USDCHF, H4 - Continuation of downtrendPrice reached daily supply zone + FVG. Breaking below local support at 0.7910 should confirm further decline. Trade carefully!

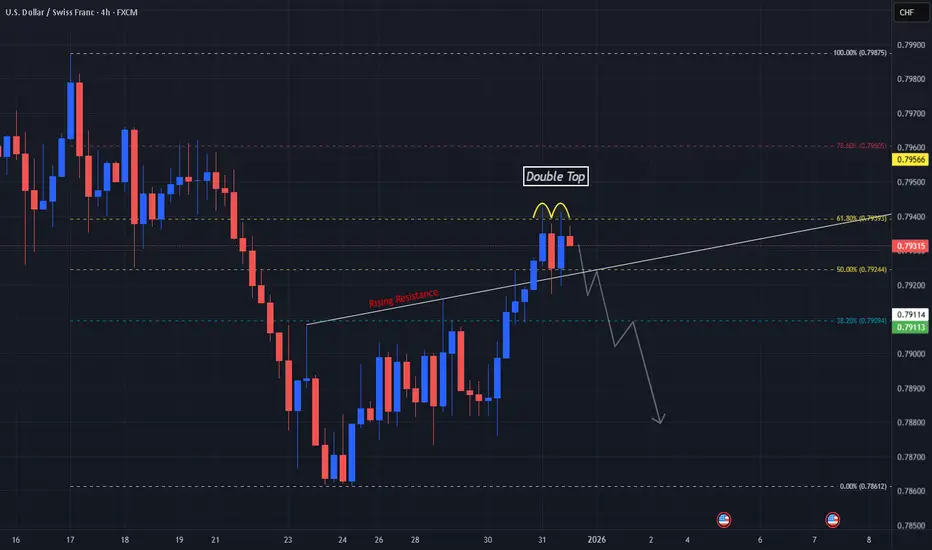
Potential Double Top @ Golden Ratio On USDCHFBefore the New Year, price on OANDA:USDCHF may have formed a strong reversal at a very vital level!
Since the Low @ .78612, price has made a retracement to the High @ .79875 and seems to have found some resistance at the Golden Ratio Level, 61.8% @ .79393.
In prices second attempt to break this level, we see it is again rejected down before markets closed for New Years.
If price breaks back below the 50% level @ .794244 where the Low of the Double Top sits, this will confirm the reversal pattern and generate Short Opportunities!
Bearish reversal off pullback resistance?Swissie (USD/CHF) is rising towards the pivot, which is a pullback resistance that aligns with the 38.2% Fibonacci retracement and could reverse to the 1st support.
Pivot: 0.7945
1st Support: 0.7891
1st Resistance: 0.7979
Disclaimer:
The opinions given above constitute general market commentary and do not constitute the opinion or advice of IC Markets or any form of personal or investment advice.
Any opinions, news, research, analyses, prices, other information, or links to third-party sites contained on this website are provided on an "as-is" basis, are intended to be informative only, and are not advice, a recommendation, research, a record of our trading prices, an offer of, or solicitation for, a transaction in any financial instrument and thus should not be treated as such. The information provided does not involve any specific investment objectives, financial situation, or needs of any specific person who may receive it. Please be aware that past performance is not a reliable indicator of future performance and/or results. Past performance or forward-looking scenarios based upon the reasonable beliefs of the third-party provider are not a guarantee of future performance. Actual results may differ materially from those anticipated in forward-looking or past performance statements. IC Markets makes no representation or warranty and assumes no liability as to the accuracy or completeness of the information provided, nor any loss arising from any investment based on a recommendation, forecast, or any information supplied by any third party

USDCHF H1 | Potential Bullish RiseBased on the H1 chart analysis, we can see that the price has bounced off our buy entry level at 156.31, which is a pullback support.
Our stop loss is set at 155.76, which is a pullback support.
Our take profit is set at 157.27, which is a pullback resistance that is slightly below the 161.8% Fibonacci extension.
High Risk Investment Warning
Stratos Markets Limited (

USDCHF H1 | Bearish Reversal Off Pullback ResistanceThe price is rising towards our sell entry level at 0.7937, which is a pullback resistance that is slightly below the 78.6% Fibonacci retracement.
Our stop loss is set at 0.7958, which is a pullback resistance.
Our take profit is at 0.7906, which is a pullback support.
High Risk Investment Warning
Stratos Markets Limited (

Could we see a bounce from here?The USD/CHF could fall towards the support level, which serves as a pullback support that aligns with the 50% Fibonacci retracement, and then bounce from this level to our take-profit.
Entry: 0.7895
Why we like it:
There is a pullback support level that aligns with ht e 50% Fibonacci retracement
Stop loss: 0.7871
Why we like it:
There is a pullback support level.
Take profit: 0.7933
Why we like it:
There is a pullback resistance level.
Enjoying your TradingView experience? Review us!
Please be advised that the information presented on TradingView is provided to Vantage (‘Vantage Global Limited’, ‘we’) by a third-party provider (‘Everest Fortune Group’). Please be reminded that you are solely responsible for the trading decisions on your account. There is a very high degree of risk involved in trading. Any information and/or content is intended entirely for research, educational and informational purposes only and does not constitute investment or consultation advice or investment strategy. The information is not tailored to the investment needs of any specific person and therefore does not involve a consideration of any of the investment objectives, financial situation or needs of any viewer that may receive it. Kindly also note that past performance is not a reliable indicator of future results. Actual results may differ materially from those anticipated in forward-looking or past performance statements. We assume no liability as to the accuracy or completeness of any of the information and/or content provided herein and the Company cannot be held responsible for any omission, mistake nor for any loss or damage including without limitation to any loss of profit which may arise from reliance on any information supplied by Everest Fortune Group.

Bearish drop off?Swissie (USD/CHF) could rise to the pivot, which is a pullback resistance that aligns with the 50% Fibonacci retracement and could reverse to the pullback support.
Pivot: 0.7922
1st Support: 0.7861
1st Resistance: 0.7968
Disclaimer:
The opinions given above constitute general market commentary and do not constitute the opinion or advice of IC Markets or any form of personal or investment advice.
Any opinions, news, research, analyses, prices, other information, or links to third-party sites contained on this website are provided on an "as-is" basis, are intended to be informative only, and are not advice, a recommendation, research, a record of our trading prices, an offer of, or solicitation for, a transaction in any financial instrument and thus should not be treated as such. The information provided does not involve any specific investment objectives, financial situation, or needs of any specific person who may receive it. Please be aware that past performance is not a reliable indicator of future performance and/or results. Past performance or forward-looking scenarios based upon the reasonable beliefs of the third-party provider are not a guarantee of future performance. Actual results may differ materially from those anticipated in forward-looking or past performance statements. IC Markets makes no representation or warranty and assumes no liability as to the accuracy or completeness of the information provided, nor any loss arising from any investment based on a recommendation, forecast, or any information supplied by any third party

USDCHF sideways consolidation support at 0.7870The USDCHF remains in a bullish trend, with recent price action showing signs of a corrective pullback within the broader sideways consolidation.
Support Zone: 0.7870 – a key level from previous consolidation. Price is currently testing or approaching this level.
A bullish rebound from 0.7870 would confirm ongoing upside momentum, with potential targets at:
0.7950 – initial resistance
0.7970 – psychological and structural level
0.7990 – extended resistance on the longer-term chart
Bearish Scenario:
A confirmed break and daily close below 0.7870 would weaken the bullish outlook and suggest deeper downside risk toward:
0.7860 – minor support
0.7850 – stronger support and potential demand zone
Outlook:
Bullish bias remains intact while the USDCHF holds above 0.7870 A sustained break below this level could shift momentum to the downside in the short term.
This communication is for informational purposes only and should not be viewed as any form of recommendation as to a particular course of action or as investment advice. It is not intended as an offer or solicitation for the purchase or sale of any financial instrument or as an official confirmation of any transaction. Opinions, estimates and assumptions expressed herein are made as of the date of this communication and are subject to change without notice. This communication has been prepared based upon information, including market prices, data and other information, believed to be reliable; however, Trade Nation does not warrant its completeness or accuracy. All market prices and market data contained in or attached to this communication are indicative and subject to change without notice.

USDCHF H1 | Bullish BounceBased on the H1 chart analysis, we can see the price fall to our buy entry level at 0.7880, which is a pullback support.
Our take profit is set at 0.7906, which is a pullback resistance that is slightly below the 50% Fibonacci retracement.
Our stop loss is set at 0.7863, which is a pullback support.
High Risk Investment Warning
Stratos Markets Limited (

USDCHF: Growth & Bullish Continuation
Our strategy, polished by years of trial and error has helped us identify what seems to be a great trading opportunity and we are here to share it with you as the time is ripe for us to buy USDCHF.
Disclosure: I am part of Trade Nation's Influencer program and receive a monthly fee for using their TradingView charts in my analysis.
❤️ Please, support our work with like & comment! ❤️

USDCHF: Wave structure at a trend forkUSDCHF: Wave structure at a trend fork
USDCHF Wave Overview (D1 and H4)
As a trader who has been practicing wave analysis for over ten years, I note that the USDCHF pair is currently demonstrating the completion of an extended corrective formation and is poised to form a new impulse.
Chart D1: The global picture indicates that the market is ending a sideways phase. The wave structure appears to be the end of a corrective sequence, which serves as the foundation for the next trend movement.
Chart H4: Local dynamics confirm the formation of key entry points. Here, the first signs of an impulse are visible, which could mark the beginning of a larger wave.
Main Scenario
After the completion of the corrective phase, a downward impulse sequence is expected to develop. This movement will be accompanied by increased seller activity and a gradual shift in priority to the downside.
Alternative Scenario
If the price holds above recent highs and forms a stable upward impulse structure, the priority will shift to continued growth. In this case, the correction will be considered incomplete, and the pair may experience a further rebound.
Trading Idea
Conservative approach: wait for confirmation of a breakout of key levels and enter with the trend.
Aggressive approach: use local impulses on H4 for earlier entries, but with tight stops.
In both cases, it is important to maintain strict risk management and adjust the plan as new impulses emerge.
Results
USDCHF is at the transition point between a correction and a new impulse. The wave structure on D1 and H4 provides clear guidelines for trading: watch for confirmation of the scenario and act with discipline.

Forex Strategy: USD/CHF & EUR/USD (Trap vs. Failure Setup)The Setup: We are tracking a high-probability "Negative Correlation" setup on USD/CHF and EUR/USD (15m Timeframe), identified by the QuantFlow Algo.
We are strictly following the "Trap Success vs. Trap Failure" rule. We do not guess; we trade the breakout of the Signal Candle.
1. USD/CHF (Left Chart - Yellow Sell Signal):
Scenario A: Trap SUCCESS (Bearish)
Trigger: Break below the Signal Candle Low (0.78939).
Action: SHORT. Institutional selling is confirmed.
Scenario B: Trap FAILURE (Bullish Reversal)
Trigger: If price reverses and breaks the Signal Candle High (0.79032).
Action: SWITCH TO LONG. This indicates the sellers were trapped, and we ride the squeeze up.
2. EUR/USD (Right Chart - Blue Buy Signal):
Scenario A: Trap SUCCESS (Bullish)
Trigger: Break above the Signal Candle High (1.17766).
Action: LONG. Institutional buying is confirmed.
Scenario B: Trap FAILURE (Bearish Reversal)
Trigger: If price reverses and breaks the Signal Candle Low (1.17669).
Action: SWITCH TO SHORT. This indicates the buyers were trapped, and we follow the stop-loss hunt down.
Why this matters: Institutions often set "Traps" to grab liquidity before the real move.
If the Signal Candle holds, we follow the trend.
If the Signal Candle breaks the opposite way, it is often a massive reversal move.
Rule: We are neutral until the High or Low breaks.
Indicator Used: QuantFlow Algo: Institutional Trap & Reversal
Disclaimer: Trading Forex involves risk. These levels are for educational purposes.

Bearish continuation?Swissie (USD/CHF) has rejected off the pivot, which is a pullback resistance, and could drop to the 1st support, which aligns with the 100% Fib projection.
Pivot: 0.7894
1st Support: 0.7828
1st Resistance: 0.7932
Disclaimer:
The opinions given above constitute general market commentary and do not constitute the opinion or advice of IC Markets or any form of personal or investment advice.
Any opinions, news, research, analyses, prices, other information, or links to third-party sites contained on this website are provided on an "as-is" basis, are intended to be informative only, and are not advice, a recommendation, research, a record of our trading prices, an offer of, or solicitation for, a transaction in any financial instrument and thus should not be treated as such. The information provided does not involve any specific investment objectives, financial situation, or needs of any specific person who may receive it. Please be aware that past performance is not a reliable indicator of future performance and/or results. Past performance or forward-looking scenarios based upon the reasonable beliefs of the third-party provider are not a guarantee of future performance. Actual results may differ materially from those anticipated in forward-looking or past performance statements. IC Markets makes no representation or warranty and assumes no liability as to the accuracy or completeness of the information provided, nor any loss arising from any investment based on a recommendation, forecast, or any information supplied by any third party

USDCHF: bearish flag🛠 Technical Analysis: On the 4-hour timeframe, USDCHF remains under heavy bearish pressure. The chart highlights a confirmed "Global bearish signal", where the short-term SMA has crossed below the long-term SMA (100 and 200), validating the downward trend. Currently, the price is consolidating within a bearish flag formation just above the immediate support level of 0.79445. This consolidation is typically a continuation pattern, suggesting that the market is gathering liquidity for another leg lower. The analysis projects a breakdown of this flag, targeting the major support zone at 0.78776.
———————————————
❗️ Trade Parameters (SELL)
———————————————
➡️ Entry Point: Sell on the breakdown of the flag support (approx. 0.7940 – 0.79445)
🎯 Take Profit: 0.78776 (Support)
🔴 Stop Loss: Above the recent consolidation structure (approx. 0.79889 – 0.8000)
⚠️ Disclaimer: This is a potential trade idea based on current chart patterns; market conditions can change rapidly, especially with upcoming central bank news.

USDCHF: Growth & Bullish Forecast
Remember that we can not, and should not impose our will on the market but rather listen to its whims and make profit by following it. And thus shall be done today on the USDCHF pair which is likely to be pushed up by the bulls so we will buy!
Disclosure: I am part of Trade Nation's Influencer program and receive a monthly fee for using their TradingView charts in my analysis.
❤️ Please, support our work with like & comment! ❤️

XAUUSD: potential year-end correction🛠 Technical Analysis: On the 4-hour (H4) timeframe, Gold (XAUUSD) continues its aggressive bullish cycle, supported by a "Global bullish signal" that originated earlier in December. The price is currently trading at historic highs, oscillating around the 4,500.00 psychological handle.
While the long-term moving averages (SMA 100 and 200) are far below the current market price—indicating a strong underlying trend—the immediate price action is testing a steep "Resistance line". A failure to break decisively above this diagonal resistance suggests a high-probability mean-reversion move toward the nearest liquidity pool and horizontal support zone at 4,347.07.
———————————————
❗️ Trade Parameters (SELL)
———————————————
➡️ Entry Point: Potential short position after a slight update of the current high (approximately 4499.96).
🎯 Take Profit: 4,347.07 (Support).
🔴 Stop Loss: 4,602.73 (Above the recent peak).
⚠️ Disclaimer: This is a potential trade idea based on current analysis; market conditions and price direction are subject to change based on news factors and volatility.

USD/CHF Falls to a Three-Month LowUSD/CHF Falls to a Three-Month Low
As shown on today’s USD/CHF chart, the US dollar has dropped against the Swiss franc to its lowest level in three months.
In December, the pair has declined by around 1.9%. This move reflects not only US dollar weakness—driven by expectations of further Federal Reserve rate cuts in 2026—but also the strength of the franc, whose appeal has been reinforced by recent news:
→ In December, the Swiss National Bank left its key interest rate unchanged at zero and commented that the reduction in US tariffs on Swiss goods has improved Switzerland’s economic outlook.
→ Rising geopolitical tensions, including developments near the Venezuelan coast.
Technical Analysis of USD/CHF
During November and December, price fluctuations formed a descending channel, with central bank decisions acting as the main catalyst for the decline.
Today’s setup is notable in that:
→ the price is trading close to the lower boundary of the channel;
→ the RSI indicator is showing a bullish divergence.
It is worth noting that the 0.7880 level acted as support in October and November. The current dip may therefore turn out to be a bear trap, referred to in Smart Money Concepts terminology as a liquidity grab.
From this perspective, USD/CHF could stage a corrective rebound towards the channel’s median, in which case a retest of former support around 0.7925 cannot be ruled out.
This article represents the opinion of the Companies operating under the FXOpen brand only. It is not to be construed as an offer, solicitation, or recommendation with respect to products and services provided by the Companies operating under the FXOpen brand, nor is it to be considered financial advice.

Market Analysis: USD/CHF Slips Further Under PressureMarket Analysis: USD/CHF Slips Further Under Pressure
USD/CHF declined further and is now struggling below 0.7900.
Important Takeaways for USD/CHF Analysis Today
- USD/CHF declined below the 0.7920 and 0.7900 support levels.
- There is a key bearish trend line forming with resistance near 0.7905 on the hourly chart.
USD/CHF Technical Analysis
On the hourly chart of USD/CHF, the pair started a fresh decline from well above 0.7950. The US Dollar dropped below 0.7900 to move into a negative zone against the Swiss Franc.
The bears pushed the pair below the 50-hour simple moving average and 0.7880. Finally, the bulls appeared near 0.7860. A low was formed near 0.7861, and the pair is now consolidating losses below the 23.6% Fib retracement level of the downward move from the 0.7987 swing high to the 0.7861 low.
On the upside, the pair could face bears near 0.7890. The first major resistance sits near the 50-hour simple moving average at 0.7905. The main barrier for an upside break could be near a bearish trend line at 0.7925 and the 50% Fib retracement.
A daily close above 0.7925 could start a fresh increase. In the stated case, the pair could rise toward 0.7955. The next stop for the bulls might be 0.7985.
On the downside, immediate support on the USD/CHF chart is 0.7860. The first major breakdown zone could be 0.7840. A close below 0.7840 might send the pair to 0.7800. Any more losses may possibly open the doors for a move toward 0.7760 in the coming days.
This article represents the opinion of the Companies operating under the FXOpen brand only. It is not to be construed as an offer, solicitation, or recommendation with respect to products and services provided by the Companies operating under the FXOpen brand, nor is it to be considered financial advice.

Stop!Loss|Market View: GOLD🙌 Stop!Loss team welcomes you❗️
In this post, we're going to talk about the near-term outlook for GOLD ☝️
Potential trade setup:
🔔Entry level: 4471.202
💰TP: 4334.376
⛔️SL: 4539.615
"Market View" - a brief analysis of trading instruments, covering the most important aspects of the FOREX market.
👇 In the comments 👇 you can type the trading instrument you'd like to analyze, and we'll talk about it in our next posts.
💬 Description: Gold is fulfilling the previously outlined scenario, and given the current market situation for this metal, a potential reversal is likely. Specifically, a false breakout has formed, and if it is confirmed (with the price not moving above 4493), we can expect a decline toward key supports near 4380. Trend support and the latest price accumulation can also be targeted. All of this is located near the 4300 area.
Thanks for your support 🚀
Profits for all ✅

USDCHF H4 | Bearish Reversal Off Pullback ResistanceMomentum: Bearish
Price is reacting off the SSL, which is acting as pullback resistance.
Sell Entry: 0.7962
Pullback resistance
Stop Loss: 0.7991
Above pullback resistance
Take Profit: 0.7879
Swing low support
61.8% Fibonacci projection
High Risk Investment Warning
Stratos Markets Limited (tradu.com ), Stratos Europe Ltd (tradu.com ):
CFDs are complex instruments and come with a high risk of losing money rapidly due to leverage. 70% of retail investor accounts lose money when trading CFDs with this provider. You should consider whether you understand how CFDs work and whether you can afford to take the high risk of losing your money.
Stratos Global LLC (tradu.com ): Losses can exceed deposits.
Please be advised that the information presented on TradingView is provided to Tradu (‘Company’, ‘we’) by a third-party provider (‘TFA Global Pte Ltd’). Please be reminded that you are solely responsible for the trading decisions on your account. Any information and/or content is intended entirely for research, educational and informational purposes only and does not constitute investment or consultation advice or investment strategy. The information is not tailored to the investment needs of any specific person and therefore does not involve a consideration of any of the investment objectives, financial situation or needs of any viewer that may receive it. Past performance is not a reliable indicator of future results. Actual results may differ materially from those anticipated in forward-looking or past performance statements. We assume no liability as to the accuracy or completeness of any of the information and/or content provided herein and the Company cannot be held responsible for any omission, mistake nor for any loss or damage including without limitation to any loss of profit which may arise from reliance on any information supplied by TFA Global Pte Ltd.

Bullish reversal setup?USD/CHF has bounced off the support level which is a pullback support that is slightly above the 78.6% Fibonacci projections and could rise from this level to our take profit.
Entry: 0.7873
Why we like it:
There is a pullback support level, which is slightly above the 78.6% Fibonacci projection.
Stop loss: 0.7831
Why we like it:
There is a support level at the 100% Fibonacci projection.
Take profit: 0.7935
Why we like it:
There is a pullback resistance level.
Enjoying your TradingView experience? Review us!
Please be advised that the information presented on TradingView is provided to Vantage (‘Vantage Global Limited’, ‘we’) by a third-party provider (‘Everest Fortune Group’). Please be reminded that you are solely responsible for the trading decisions on your account. There is a very high degree of risk involved in trading. Any information and/or content is intended entirely for research, educational and informational purposes only and does not constitute investment or consultation advice or investment strategy. The information is not tailored to the investment needs of any specific person and therefore does not involve a consideration of any of the investment objectives, financial situation or needs of any viewer that may receive it. Kindly also note that past performance is not a reliable indicator of future results. Actual results may differ materially from those anticipated in forward-looking or past performance statements. We assume no liability as to the accuracy or completeness of any of the information and/or content provided herein and the Company cannot be held responsible for any omission, mistake nor for any loss or damage including without limitation to any loss of profit which may arise from reliance on any information supplied by Everest Fortune Group.
