USD/JPY: Sideways within 146.80–148.00Hi everyone, let’s do a quick analysis of USD/JPY today.
At the moment, the pair is moving sideways quite clearly within the 146.80 – 148.00 range. The 148.00 level is still acting as a solid resistance, repeatedly pushing price back down. Meanwhile, the support around 146.80 – 147.00 has been holding firm several times, showing that buyers are not giving up easily either.
What I’m paying attention to are the Fair Value Gap (FVG) areas on the chart – price tends to retrace and fill these gaps, so short-term traders may want to keep an eye on that. In addition, trading volume spiked at the end of August but has since cooled off, suggesting momentum isn’t strong enough yet for a decisive breakout.
On the news front, signals are mixed: US CPI and PPI have eased, leading the market to expect Fed rate cuts → bearish for USD, bullish for JPY. On the other hand, Japan’s economic data hasn’t been very positive, which weakens confidence in the Yen. As a result, the pair remains stuck in this sideways range for now.
In the short term, I lean toward the sideways scenario, unless strong news from the Fed or BOJ triggers a clear breakout. If price keeps ranging, there’s a good chance it will revisit and fill the gap near the closest support.
What do you think – will USD/JPY break above 148.00 first, or dip below 146.80? Drop your thoughts in the comments so we can discuss!
USDJPY

USDJPY BreakoutPrice has been consolidating since early August and has formed a clear 4-hour horizontal channel.
This week's news may cause a USDJPY breakout:
Tuesday, 16th September, US Retail Sales
Wednesday, 17th September, 🚨 FOMC, Fed Interest Rate Decision, Fed Press Conference 🚨
Friday, 19th September, Inflation for Japan, BOJ Interest Rate Decision

USDJPY Is Bearish! Sell!
Here is our detailed technical review for USDJPY.
Time Frame: 1D
Current Trend: Bearish
Sentiment: Overbought (based on 7-period RSI)
Forecast: Bearish
The market is on a crucial zone of supply 146.990.
The above-mentioned technicals clearly indicate the dominance of sellers on the market. I recommend shorting the instrument, aiming at 144.781 level.
P.S
Overbought describes a period of time where there has been a significant and consistent upward move in price over a period of time without much pullback.
Like and subscribe and comment my ideas if you enjoy them!

Bearish reversal off major resistance?USD/JPY has rejected off the pivot and could potentially drop to the 1st support.
Pivot: 147.86
1st Support: 146.41
1st Resistance: 148.85
Oil markets on September 16, 2025, are caught between conflicting forces. While immediate supply disruption risks from Ukrainian attacks on Russian infrastructure and anticipated Federal Reserve rate cuts are providing near-term price support, fundamental market conditions point to significant oversupply ahead. The EIA's projection of massive inventory builds and OPEC+'s continued production increases suggest substantial downward price pressure through 2026, with Brent potentially falling to $50 per barrel despite current geopolitical tensions. The market is essentially pricing in short-term disruption risks while bracing for longer-term oversupply challenges.

USDJPY Trading Plan Ahead of USD Funds Rate Welcome back! Let me know your thoughts in the comments!
** USDJPY Analysis - Listen to video!
We recommend that you keep this on your watch list and enter when the entry criteria of your strategy is met.
Please support this idea with a LIKE and COMMENT if you find it useful and Click "Follow" on our profile if you'd like these trade ideas delivered straight to your email in the future.
Thanks for your continued support!

USDJPY and DXY, Is FOMC affecting the both currency?Hello traders, this is a complete multiple timeframe analysis of this pair. We see could find significant trading opportunities as per analysis upon price action confirmation we may take this trade. Smash the like button if you find value in this analysis and drop a comment if you have any questions or let me know which pair to cover in my next analysis.

USDJPY Long Technical Analysis🔎 Technical Analysis – USDJPY (4H)
Currently, USDJPY is trading around 147.30, consolidating within a wide range. The market has been sideways, but signs of a bullish breakout are building.
• Support Zone: 146.30 → strong base tested multiple times. Buyers are stepping in aggressively here.
• Resistance Zone: 149.10 → the immediate ceiling. A breakout above this can fuel continuation.
• Trend Context: Although the pair has been choppy, the repeated higher lows near 146.20–146.30 suggest accumulation and potential upward pressure.
• Indicators (from chart levels): Previous “Buy” signals were accurate near demand zones, giving weight to the bullish bias.
________________________________________
📊 Trade Setup (Bullish Bias 🚀)
• ✅ Entry: 147.30
• 🛑 Stop-Loss: 146.30
• 🎯 Take Profit 1: 148.00
• 🎯 Take Profit 2: 149.10 (major resistance)
• 🎯 Extended Target: 150.90 if momentum sustains above 149.10
• ⚖️ Risk/Reward: ~1:2
________________________________________
⚡ Risk Handling & Profit Booking
• 💰 Partial Profit Booking: Close 40% at 148.00 → locks in profit while staying in position.
• 🏹 Trailing Stop: After 148.00 is hit, move SL to entry (147.30) → risk-free trade. As price pushes toward 149+, trail stop to 148.20–148.50.
• 📉 Capital Allocation: Keep exposure limited so a full SL hit at 146.30 risks 1–2% equity only.
________________________________________
✨ Summary: USDJPY is preparing for a bullish leg 📈. A break above 148.00 could accelerate toward 149.10, and if momentum is strong, even 150.90 is on the table 🚀. Smart risk handling with partial profits + trailing stop ensures both safety and upside capture.
________________________________________

USDJPY — Signed by Tilki: Precision, Emotion, Discipline!Hey traders,
Here’s my USDJPY setup based on the 30-minute chart:
🟢 Buy Entry: 147.402
🔴 Stop Loss: 146.987
🎯 TP1: 147.567
🎯 TP2: 147.788
🎯 TP3: 148.239
Risk/Reward Ratio: 2.00
Every single like you drop is fuel for me to keep sharing these setups.
Big thanks to everyone standing by and supporting the journey.

Fundamental Market Analysis for September 15, 2025 USDJPYThe pair trades around 147.4. Last week the yen firmed after political headlines from Tokyo: the prime minister’s resignation increased uncertainty and supported safe-haven demand for JPY. At the same time, US yields pulled back on softer labor data and a mild PPI, narrowing the rate differential in the dollar’s favor.
On Japan’s side, debate has revived about further BoJ normalization as wages rise and inflation stabilizes. Even if the BoJ leaves settings unchanged at the next meeting, the risk balance is shifting from one-sidedly dovish toward more neutral, which limits USD/JPY upside as a Fed cut appears likely.
The combination of a prospective Fed cut on Wednesday and elevated political noise in Japan makes further downside drift plausible. We prefer selling at 147.500 with a 146.000 target and a 148.500 stop. A “hawkish” Fed reaction and/or an ultra-cautious BoJ could push the pair back toward 148+.
Trading recommendation: SELL 147.500, SL 148.500, TP 146.000

USDJPY | Bears in control: Momentum points to further declineUSD/JPY has rejected off the sell entry which is a multi swing high resistance and could potentially drop from this level to the downside.
Sell entry is at 147.96, which is a multi-swing high resistance.
Stop loss is at 148.44, which is a swing high resistance that aligns with the 127.2% Fibonacci extension.
Take profit is at 146.78, which is a pullback support that is slightly above the 127.2% Fibonacci extension.
High Risk Investment Warning
Trading Forex/CFDs on margin carries a high level of risk and may not be suitable for all investors. Leverage can work against you.
Stratos Markets Limited (tradu.com ):
CFDs are complex instruments and come with a high risk of losing money rapidly due to leverage. 65% of retail investor accounts lose money when trading CFDs with this provider. You should consider whether you understand how CFDs work and whether you can afford to take the high risk of losing your money.
Stratos Europe Ltd (tradu.com ):
CFDs are complex instruments and come with a high risk of losing money rapidly due to leverage. 66% of retail investor accounts lose money when trading CFDs with this provider. You should consider whether you understand how CFDs work and whether you can afford to take the high risk of losing your money.
Stratos Global LLC (tradu.com ):
Losses can exceed deposits.
Please be advised that the information presented on TradingView is provided to Tradu (‘Company’, ‘we’) by a third-party provider (‘TFA Global Pte Ltd’). Please be reminded that you are solely responsible for the trading decisions on your account. There is a very high degree of risk involved in trading. Any information and/or content is intended entirely for research, educational and informational purposes only and does not constitute investment or consultation advice or investment strategy. The information is not tailored to the investment needs of any specific person and therefore does not involve a consideration of any of the investment objectives, financial situation or needs of any viewer that may receive it. Kindly also note that past performance is not a reliable indicator of future results. Actual results may differ materially from those anticipated in forward-looking or past performance statements. We assume no liability as to the accuracy or completeness of any of the information and/or content provided herein and the Company cannot be held responsible for any omission, mistake nor for any loss or damage including without limitation to any loss of profit which may arise from reliance on any information supplied by TFA Global Pte Ltd.
The speaker(s) is neither an employee, agent nor representative of Tradu and is therefore acting independently. The opinions given are their own, constitute general market commentary, and do not constitute the opinion or advice of Tradu or any form of personal or investment advice. Tradu neither endorses nor guarantees offerings of third-party speakers, nor is Tradu responsible for the content, veracity or opinions of third-party speakers, presenters or participants.

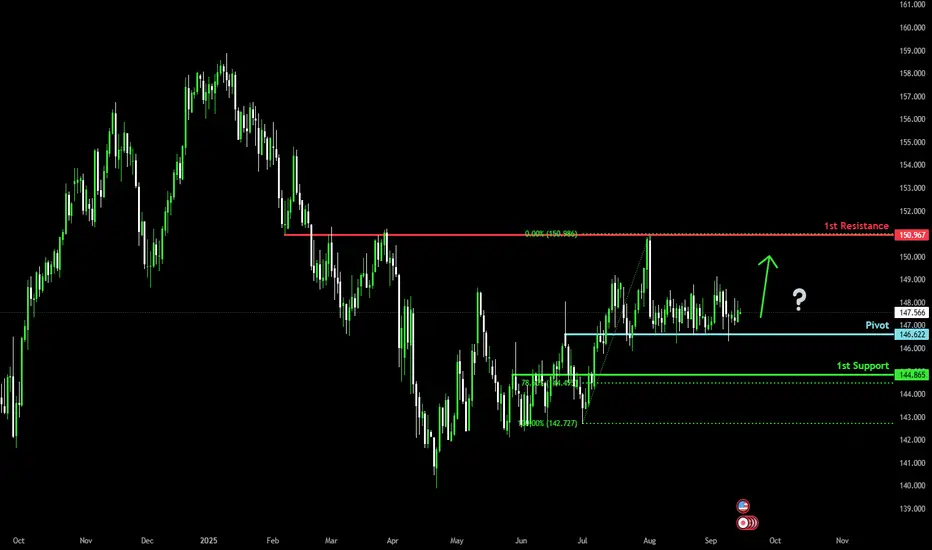
Could price be setting up for a bullish reversal?USD/JPY is falling towards the pivot, which is an overlap support and could bounce to the 1st resistance.
Pivot: 146.62
1st Support: 144.86
1st Resistance: 150.96
Disclaimer:
The above opinions given constitute general market commentary, and do not constitute the opinion or advice of IC Markets or any form of personal or investment advice.
Any opinions, news, research, analyses, prices, other information, or links to third-party sites contained on this website are provided on an "as-is" basis, are intended only to be informative, is not an advice nor a recommendation, nor research, or a record of our trading prices, or an offer of, or solicitation for a transaction in any financial instrument and thus should not be treated as such. The information provided does not involve any specific investment objectives, financial situation and needs of any specific person who may receive it. Please be aware, that past performance is not a reliable indicator of future performance and/or results. Past Performance or Forward-looking scenarios based upon the reasonable beliefs of the third-party provider are not a guarantee of future performance. Actual results may differ materially from those anticipated in forward-looking or past performance statements. IC Markets makes no representation or warranty and assumes no liability as to the accuracy or completeness of the information provided, nor any loss arising from any investment based on a recommendation, forecast or any information supplied by any third-party.
DXY FRGNT WEEKLY CHART ANALYSIS - DXY Q3 W38 Y25🌍FRGNT WEEKLY CHART ANALYSIS - DXY Q3 W38 Y25
📊 DXY FRGNT Breakdown + Impact on GBP, EUR, and Cross Pairs
1. Higher Timeframe Context (Weekly)
Trend: Bearish → clear lower highs & lower lows since mid-summer.
Unmitigated Imbalance (IMB): 99–101 zone above current price → acts as a long-term liquidity magnet but not yet tested.
Bias: Weakness dominates until price proves otherwise.
2. Daily Timeframe
Supply Zone: 98.200–98.500 (aligns with Daily 50 EMA).
Demand Zone: 96.800–97.000 (next liquidity draw).
Expectation: Retrace into 98.2 supply, then continuation lower toward 97.0 demand.
3. Intraday (4H)
Supply Overlap: 97.800–98.200 (Daily + 4H confluence).
Structure: Still bearish, repeated rejections from the 50 EMA.
Projection: Price likely taps 98.0 area, then drives into 97.0 demand.
Summary
Bias: Bearish.
Watch for liquidity sweep above 98.0 → rejection → sell setups toward 97.0 demand.
🌍 Impact on GBP, EUR, and Cross Pairs
GBPUSD
Effect: Dollar weakness supports bullish setups.
Expect retrace into 1.2670–1.2720 demand before price extends higher.
Targets: 1.2800–1.2850, with potential stretch toward 1.2950.
Narrative: As long as DXY stays capped under 98.2, GBPUSD should continue higher.
EURUSD
Effect: Also benefits from USD weakness, though less aggressively than GBP.
Look for longs around 1.0850–1.0880 demand.
Targets: 1.0950–1.1000.
Narrative: Similar structure to GBPUSD, but GBP is likely to outperform EUR.
EURGBP
Effect: GBP stronger than EUR → bearish bias.
Shorts valid below 0.8520, aiming for liquidity under 0.8430–0.8450.
Narrative: Even if both EUR and GBP rise against USD, GBP is leading.
Other USD Cross Pairs
USDJPY: Likely to weaken, targeting 144.50–145.00 liquidity.
USDCAD: Bearish pressure, could reach 1.3600 demand.
USDCHF: Lower toward 0.8850–0.8900 demand.
✅ Overall Picture
DXY Bearish = Favor longs on GBPUSD & EURUSD.
GBP stronger than EUR = EURGBP shorts are attractive.
JPY & CHF weak = Pairs like GBPJPY and EURJPY can push higher.
👉 In short: DXY’s weakness is the engine, driving GBPUSD and EURUSD higher. The Pound has the edge, making EURGBP a sell candidate while GBPJPY becomes a standout buy.
TVC:DXY
FRGNT

Bearish reversal off?USD/JPY has rejected the resistance level, which serves as a pullback resistance and could potentially drop from this level to our take-profit.
Entry: 147.95
Why we like it:
There is a pullback resistance level.
Stop loss: 148.44
Why we like it:
There is a swing high resistance that aligns with the 127.2% Fibonacci extension.
Take profit: 146.79
Why we like it:
There is a pullback support that is slightly above the 127.2% Fibonacci extension.
Enjoying your TradingView experience? Review us!
Please be advised that the information presented on TradingView is provided to Vantage (‘Vantage Global Limited’, ‘we’) by a third-party provider (‘Everest Fortune Group’). Please be reminded that you are solely responsible for the trading decisions on your account. There is a very high degree of risk involved in trading. Any information and/or content is intended entirely for research, educational and informational purposes only and does not constitute investment or consultation advice or investment strategy. The information is not tailored to the investment needs of any specific person and therefore does not involve a consideration of any of the investment objectives, financial situation or needs of any viewer that may receive it. Kindly also note that past performance is not a reliable indicator of future results. Actual results may differ materially from those anticipated in forward-looking or past performance statements. We assume no liability as to the accuracy or completeness of any of the information and/or content provided herein and the Company cannot be held responsible for any omission, mistake nor for any loss or damage including without limitation to any loss of profit which may arise from reliance on any information supplied by Everest Fortune Group.

GU, UJ & Gold: Calm Before the Storm | Fed, BoJ, BoE AheadThe markets have been stuck in ranges for weeks, GBPUSD, USDJPY, and Gold all moving sideways. In this video, I share a clear perspective on why that’s happening and what could finally trigger a breakout.
Here’s what you’ll gain:
✅A simple breakdown of the range structures on GBPUSD, USDJPY, and Gold.
✅The key economic events next week that could shake the market (Fed, BoJ, BoE, UK CPI & labour data).
✅Likely breakout scenarios and the triggers to watch.
✅How to avoid getting trapped while the price is still consolidating.
This is the “calm before the storm” phase, and knowing how to position yourself ahead of it could make all the difference.
👉 Drop a comment with the pair you’re watching most closely.
Trade smart, trade consciously.
Disclaimer:
Based on experience and what I see on the charts, this is my take. It’s not financial advice, always do your research and consult a licensed advisor before trading.

USDJPYas i live in japan but not much as i trade on this pair, here is what i see potentional move aftre brinking the resistent or support, can catch up the trend follow.
the line may make youu clear image, this analysis is base on weekly frame to 4H
weekly low.
weekly high
leave your comment or any qustion in the comment.

USD/JPY SELLERS WILL DOMINATE THE MARKET|SHORT
Hello, Friends!
USD/JPY pair is in the uptrend because previous week’s candle is green, while the price is clearly rising on the 4H timeframe. And after the retest of the resistance line above I believe we will see a move down towards the target below at 146.564 because the pair overbought due to its proximity to the upper BB band and a bearish correction is likely.
Disclosure: I am part of Trade Nation's Influencer program and receive a monthly fee for using their TradingView charts in my analysis.
✅LIKE AND COMMENT MY IDEAS✅

Trading balanceTrading balance The price of the asset has rebounded from the balance zone. With the prospect of growth into the resistance zone.

GBP/USD | Pound at 1.3535 – Watching for Deeper Drop! (READ)By analyzing the GBP/USD chart on the 4-hour timeframe, we can see that the price is trading around 1.3535. If it closes and holds below 1.3553, we can expect more downside.
The possible bearish targets are 1.3513, 1.3480, and 1.3473. The key demand zones are 1.3480–1.3500 and 1.3448–1.3460.
Please support me with your likes and comments to motivate me to share more analysis with you and share your opinion about the possible trend of this chart with me !
Best Regards , Arman Shaban

USDJPY Under Pressure! SELL!
My dear subscribers,
This is my opinion on the USDJPY next move:
The instrument tests an important psychological level 147.89
Bias - Bearish
Technical Indicators: Supper Trend gives a precise Bearish signal, while Pivot Point HL predicts price changes and potential reversals in the market.
Target - 147.36
About Used Indicators:
On the subsequent day, trading above the pivot point is thought to indicate ongoing bullish sentiment, while trading below the pivot point indicates bearish sentiment.
Disclosure: I am part of Trade Nation's Influencer program and receive a monthly fee for using their TradingView charts in my analysis.
———————————
WISH YOU ALL LUCK

Bearish reversal off major resistance?USD/JPY is rising towards the pivot and could reverse to the 1st support, which is a multi-swing low support.
Pivot: 147.86
1st Support: 146.41
1st Resistance: 148.85
Disclaimer:
The above opinions given constitute general market commentary, and do not constitute the opinion or advice of IC Markets or any form of personal or investment advice.
Any opinions, news, research, analyses, prices, other information, or links to third-party sites contained on this website are provided on an "as-is" basis, are intended only to be informative, is not an advice nor a recommendation, nor research, or a record of our trading prices, or an offer of, or solicitation for a transaction in any financial instrument and thus should not be treated as such. The information provided does not involve any specific investment objectives, financial situation and needs of any specific person who may receive it. Please be aware, that past performance is not a reliable indicator of future performance and/or results. Past Performance or Forward-looking scenarios based upon the reasonable beliefs of the third-party provider are not a guarantee of future performance. Actual results may differ materially from those anticipated in forward-looking or past performance statements. IC Markets makes no representation or warranty and assumes no liability as to the accuracy or completeness of the information provided, nor any loss arising from any investment based on a recommendation, forecast or any information supplied by any third-party.

USDJPY H1 | Bearish drop headBased on the H1 chart analysis, we could see the price rise to the sell entry, which acts as a pullback resistance, and could drop from this level to the downside.
Sell entry is 147.29, which is a pullback resistance.
Stop loss is at 147.97, which is a swing high resistance.
Take profit is at 146.35, which is a swing low support that lines up with the 78.6% Fibonacci projection.
High Risk Investment Warning
Trading Forex/CFDs on margin carries a high level of risk and may not be suitable for all investors. Leverage can work against you.
Stratos Markets Limited (tradu.com ):
CFDs are complex instruments and come with a high risk of losing money rapidly due to leverage. 65% of retail investor accounts lose money when trading CFDs with this provider. You should consider whether you understand how CFDs work and whether you can afford to take the high risk of losing your money.
Stratos Europe Ltd (tradu.com ):
CFDs are complex instruments and come with a high risk of losing money rapidly due to leverage. 66% of retail investor accounts lose money when trading CFDs with this provider. You should consider whether you understand how CFDs work and whether you can afford to take the high risk of losing your money.
Stratos Global LLC (tradu.com):
Losses can exceed deposits.
Please be advised that the information presented on TradingView is provided to Tradu (‘Company’, ‘we’) by a third-party provider (‘TFA Global Pte Ltd’). Please be reminded that you are solely responsible for the trading decisions on your account. There is a very high degree of risk involved in trading. Any information and/or content is intended entirely for research, educational and informational purposes only and does not constitute investment or consultation advice or investment strategy. The information is not tailored to the investment needs of any specific person and therefore does not involve a consideration of any of the investment objectives, financial situation or needs of any viewer that may receive it. Kindly also note that past performance is not a reliable indicator of future results. Actual results may differ materially from those anticipated in forward-looking or past performance statements. We assume no liability as to the accuracy or completeness of any of the information and/or content provided herein and the Company cannot be held responsible for any omission, mistake nor for any loss or damage including without limitation to any loss of profit which may arise from reliance on any information supplied by TFA Global Pte Ltd.
The speaker(s) is neither an employee, agent nor representative of Tradu and is therefore acting independently. The opinions given are their own, constitute general market commentary, and do not constitute the opinion or advice of Tradu or any form of personal or investment advice. Tradu neither endorses nor guarantees offerings of third-party speakers, nor is Tradu responsible for the content, veracity or opinions of third-party speakers, presenters or participants.

Bullish reversal off pullback support?USD/JPY is falling towards the support level, which is a pullback support and could bounce from this level to our take profit.
Entry: 146.37
Why we like it:
There is a pullback support.
Stop loss: 145.84
Why we like it:
There is an overlap support that aligns with the 127.2% Fibonacci extension.
Take profit: 147.84
Why we like it:
There is a pullback resistance.
Enjoying your TradingView experience? Review us!
Please be advised that the information presented on TradingView is provided to Vantage (‘Vantage Global Limited’, ‘we’) by a third-party provider (‘Everest Fortune Group’). Please be reminded that you are solely responsible for the trading decisions on your account. There is a very high degree of risk involved in trading. Any information and/or content is intended entirely for research, educational and informational purposes only and does not constitute investment or consultation advice or investment strategy. The information is not tailored to the investment needs of any specific person and therefore does not involve a consideration of any of the investment objectives, financial situation or needs of any viewer that may receive it. Kindly also note that past performance is not a reliable indicator of future results. Actual results may differ materially from those anticipated in forward-looking or past performance statements. We assume no liability as to the accuracy or completeness of any of the information and/or content provided herein and the Company cannot be held responsible for any omission, mistake nor for any loss or damage including without limitation to any loss of profit which may arise from reliance on any information supplied by Everest Fortune Group.

USDJPY exactly dropped from the liquidity zone!As our previous prediction on USDJPY for the potential down trend upon liquidity sweep price in fact started to move in the major direction of the trend. There was few pip over extension which may drive the price now well below the support level. Multiple timeframe trend on USDJPY is bearish, price may continue to drop to the long term monthly supprt 144.81
