USDJPY 30Min Engaged ( Bearish Reversal Detected )Time Frame: 30-Minute Warfare
Entry Protocol: Only after volume-verified breakout
🩸Bearish Reversal From : 147.700
➗ Hanzo Protocol: Volume-Tiered Entry Authority
➕ Zone Activated: Dynamic market pressure detected.
The level isn’t just price — it’s a memory of where they moved size.
Volume is rising beneath the surface — not noise, but preparation.
🔥 Tactical Note:
We wait for the energy signature — when volume betrays intention.
The trap gets set. The weak follow. We execute.
USDJPY

Bullish bounce off 61.8% Fibonacci support?USD/JPY is falling towards the pivot that aligns with the 61.8% Fibonacci retracement and could bounce to the 1st resistance, which acts as a multi-swing high resistance.
Pivot: 145.96
1st Support: 142.37
1st Resistance: 150.98
Risk Warning:
Trading Forex and CFDs carries a high level of risk to your capital and you should only trade with money you can afford to lose. Trading Forex and CFDs may not be suitable for all investors, so please ensure that you fully understand the risks involved and seek independent advice if necessary.
Disclaimer:
The above opinions given constitute general market commentary, and do not constitute the opinion or advice of IC Markets or any form of personal or investment advice.
Any opinions, news, research, analyses, prices, other information, or links to third-party sites contained on this website are provided on an "as-is" basis, are intended only to be informative, is not an advice nor a recommendation, nor research, or a record of our trading prices, or an offer of, or solicitation for a transaction in any financial instrument and thus should not be treated as such. The information provided does not involve any specific investment objectives, financial situation and needs of any specific person who may receive it. Please be aware, that past performance is not a reliable indicator of future performance and/or results. Past Performance or Forward-looking scenarios based upon the reasonable beliefs of the third-party provider are not a guarantee of future performance. Actual results may differ materially from those anticipated in forward-looking or past performance statements. IC Markets makes no representation or warranty and assumes no liability as to the accuracy or completeness of the information provided, nor any loss arising from any investment based on a recommendation, forecast or any information supplied by any third-party.

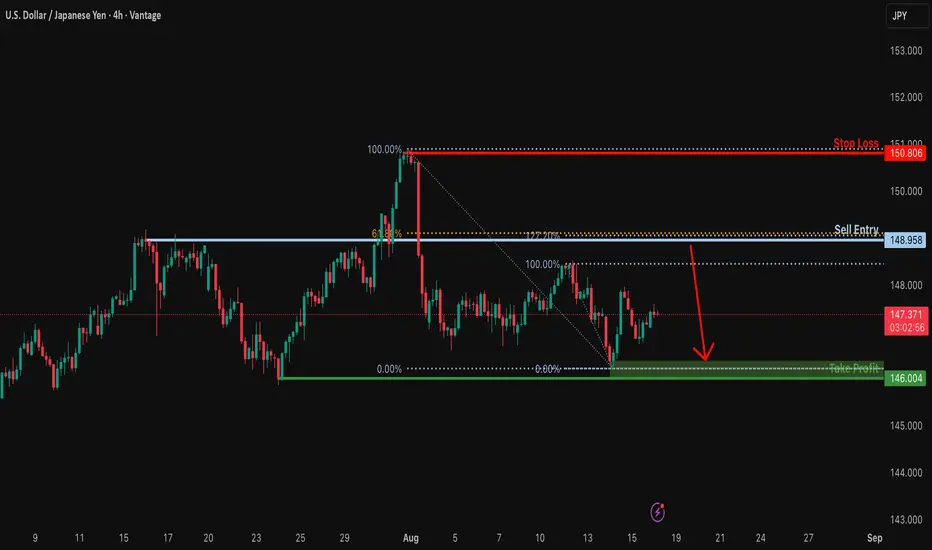
Could the price reverse from here?USD/JPY is rising towards the resistance level, which is an overlap resistance that aligns with the 127.2% Fibonacci extension and the 61.8% Fibonacci retracement. A rejection from this level could lead the price to drop towards our take-profit target.
Entry: 148.95
Why we like it:
There is an overlap resistance that aligns with the 127.2% Fibonacci extension and the 61.8% FIbonacci retracemet.
Stop loss: 150.80
Why we like it:
There is a swing high resistance.
Take profit: 146.00
Why we like it:
There is a swin low support.
Enjoying your TradingView experience? Review us!
Please be advised that the information presented on TradingView is provided to Vantage (‘Vantage Global Limited’, ‘we’) by a third-party provider (‘Everest Fortune Group’). Please be reminded that you are solely responsible for the trading decisions on your account. There is a very high degree of risk involved in trading. Any information and/or content is intended entirely for research, educational and informational purposes only and does not constitute investment or consultation advice or investment strategy. The information is not tailored to the investment needs of any specific person and therefore does not involve a consideration of any of the investment objectives, financial situation or needs of any viewer that may receive it. Kindly also note that past performance is not a reliable indicator of future results. Actual results may differ materially from those anticipated in forward-looking or past performance statements. We assume no liability as to the accuracy or completeness of any of the information and/or content provided herein and the Company cannot be held responsible for any omission, mistake nor for any loss or damage including without limitation to any loss of profit which may arise from reliance on any information supplied by Everest Fortune Group.
USDJPY Sell Setup – Watching 147.600 Key Zone Next WeekHey Traders,
In the coming week, I’m monitoring USDJPY for a potential sell opportunity near 147.600.
Trend: Still in a clear downtrend.
Current move: Price is correcting upward into resistance.
Key level: 147.600 – a major support-turned-resistance area.
If price rejects this zone with confirmation, it could resume the bearish move. I’ll be looking for signs of weakness (candlestick rejection, momentum shift) before entering.
What do you think? Will USDJPY hold below 147.600 or push higher first?
Trade safe,
Joe

USDJPY - ShortUSDJPY Analysis - SELL 👆
In this Chart USDJPY H4 Timeframe: By Nii_Billions.
❤️This Chart is for USDJPY market analysis.
❤️Entry, SL, and Target is based off our Strategy.
This chart analysis uses multiple timeframes to analyze the market and to help see the bigger picture on the charts.
The strategy uses technical and fundamental factors, and market sentiment to predict a BEARISH trend in USDJPY, with well-defined entry, stop loss, and take profit levels for risk management.
🟢This idea is purely for educational purposes.🟢
❤️Please, support our work with like & comment!❤️

USDJPY Will Collapse! SELL!
My dear friends,
My technical analysis for USDJPY is below:
The market is trading on 147.84 pivot level.
Bias - Bearish
Technical Indicators: Both Super Trend & Pivot HL indicate a highly probable Bearish continuation.
Target - 147.33
Recommended Stop Loss - 148.06
About Used Indicators:
A pivot point is a technical analysis indicator, or calculations, used to determine the overall trend of the market over different time frames.
Disclosure: I am part of Trade Nation's Influencer program and receive a monthly fee for using their TradingView charts in my analysis.
———————————
WISH YOU ALL LUCK


SCENARIO STUDY: Bullish or Bearish?Hello fellow traders! Here’s a fresh, USD/JPY plan that blends 4-hour technicals with today’s macro/news flow, plus the most recent trader and bank sentiment. Time to get happy!
USD/JPY for Aug 15, 2025, U.S. morning/afternoon
4H structure: After a slide that tested ~146.2–146.4 support, the USD/JPY keeps running into 147.8 and 148.5 as notable 4H hurdles.
Macro/news today: U.S. PPI (July) surprised hotter, cooling talk of a 50 bp Fed cut (market leans 25 bp for Sep 17); Japan Q2 GDP beat aided the yen and BoJ-hike chatter.
BoJ backdrop: July meeting opinions/outlook show a cautious tightening bias and discussion of resuming hikes; 10-yr JGB around ~1.5%.
Positioning & sentiment (latest):
CFTC JPY (non-commercial) net longs have fallen from mid-July peaks to ~82k (Aug 8). Retail (spot) sits near 54% long / 46% short.
Banks’ bias (based on recent published views):
UBS CIO guides for USD/JPY drifting lower through year-end (~140 by Dec 2025) as BoJ tightens gradually, and J.P. Morgan Research also expects weaker USD into late-2025 (USD/JPY ~141 Sep, 140 Dec).
4-hour levels to mark
Support: 146.20–146.40, then ~146.00 (deeper swing shelf).
Resistance: 147.80, 148.50 (recent 4H/spot pivot and swing high).
Scenario A — Bullish (rebound off support / corrective pop)
Why it could play out: Hotter U.S. PPI trimmed aggressive-cut bets; if incoming U.S. data/fedspeak doesn’t further dent yields, a corrective USD bounce can lift price from support toward overhead supply! Go Bulls? :D
Bullish Plan (4H execution):
Entry: 146.40–146.70 on a 4H bullish candle or RSI divergence near S1. (Structure band per the 4H map.)
Stop: 145.95 (clean break of the lower shelf).
Take Profit 1: 147.80 (first supply).
Take Profit 2: 148.50 (recent high / strong supply).
Respect Supports: 146.40–146.20, then 146.00.
Resistances to fade/scale: 147.80, 148.50.
Indicative R:R: from 146.60 risk ~65 pips to stop for ~+120 pips to TP2 (≈1:1.8), +120–190 pips if extension through 148.5.
Scenario B — Bearish (trend continuation from resistance)
Why it could play out: 4H downswing remains intact below 147.8/148.5; BoJ tone leans cautious-hawkish, Japan data firmed (GDP), while CFTC shows less crowded JPY longs (reduced squeeze risk). UBS/JPM public pieces lean medium-term lower USD/JPY.
Bearish Plan (4H execution):
Entry: 147.80–148.00 on a 4H rejection wick / failure swing at R1.
Stop: 148.60 (invalidate above R2 swing high).
TP1: 147.00 (recent intraday base).
TP2: 146.20–146.40 (key 4H demand).
Resistances to lean on: 147.80, 148.50.
Supports to target: 147.00, 146.20–146.40, then ~146.00 if momentum accelerates. Go Bears? :D
BUT WAIT..... Which is more probable now?
As for the team here at How To (dot) Forex, we are collectively leaning bearish (Scenario B) over the next few sessions. And, here is why....
Structure: Price remains capped beneath 147.8/148.5 on the 4H map.
Macro skew: Hot PPI pared back “big cut” bets but markets still favor a 25 bp cut; meanwhile Japan GDP beat + BoJ talk of possible resuming hikes is JPY-supportive.
Sentiment: Retail near 50/50 (slight long) and CFTC net JPY longs off the highs → fewer asymmetric squeeze dynamics for upside USD.
What are the banks saying?
Recent UBS and JPM predictions point to lower USD/JPY into year-end, aligning with fade-rallies bias unless price reclaims R2 decisively.
_________________________________________________
OPINION AND COMMENTARY:
we prefer fade-rally shorts into 147.8–148.0 unless a 4H close above 148.5 flips bias. If you see a strong 4H basing signal at 146.2–146.4, the bullish corrective setup is valid — just keep targets conservative at 147.8/148.5.
If you have questions, or want to see a specific type of analysis not presented here, leave us a comment below. Thank you for reading. We appreciate your support. Happy trading!
_________________________________________________
DISCLAIMER: This analysis was conducted by our in-house team of multi-level traders. We are not responsible for any losses you may incur. Always do you own research before trading. If you are new to trading, consider practicing with a free paper trading account. Ask your broker for details.

USDJPY ready to drop another 100 pip?USDJPY has done a fake out with retest of the daily high price started to move back to the major direction of the trend with second step liquidity grab 147.27 level with a price action confirmation to reject further back below. As the last day of trading week price may continue to drop to long term support 145.90 with further possibility to reject back below.

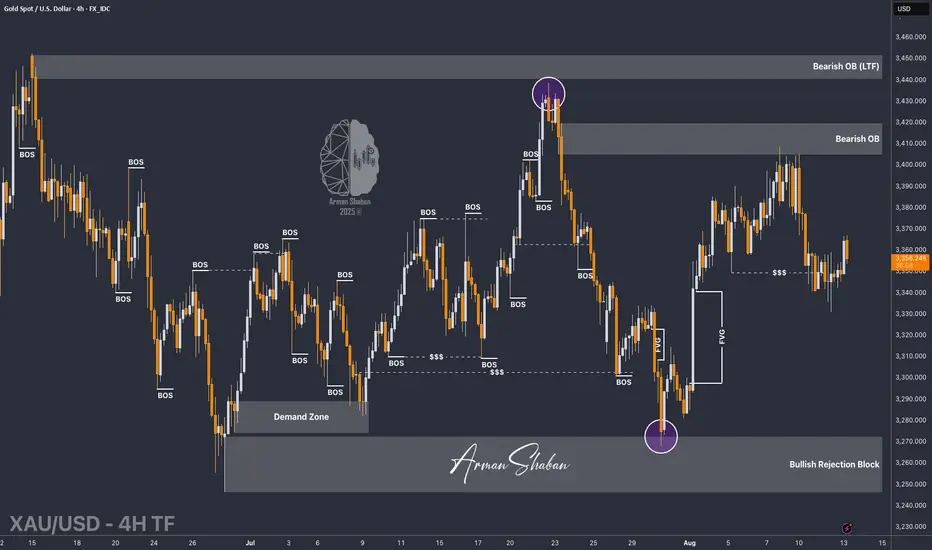
XAU/USD | Bull or Bear? Let's See! (READ THE CAPTION)By analyzing the #Gold chart on the 4-hour timeframe, we can see that after correcting down to the $3331 demand zone, price faced strong buying pressure and is now trading around $3357.
If gold manages to hold below $3367, we could expect a stronger drop, with downside targets at $3342, $3331, and $3323. This scenario will only fail if price holds above $3350, pushes past $3367, and closes above it — in that case, gold may rally back toward levels above $3390.
This analysis will be updated soon — don’t forget to show some support, friends!
Please support me with your likes and comments to motivate me to share more analysis with you and share your opinion about the possible trend of this chart with me !
Best Regards , Arman Shaban
USDJPY – DAILY FORECAST Q3 | W33 | D15 | Y25📊 USDJPY – DAILY FORECAST
Q3 | W33 | D15 | Y25
Daily Forecast 🔍📅
Here’s a short diagnosis of the current chart setup 🧠📈
Higher time frame order blocks have been identified — these are our patient points of interest 🎯🧭.
It’s crucial to wait for a confirmed break of structure 🧱✅ before forming a directional bias.
This keeps us disciplined and aligned with what price action is truly telling us.
📈 Risk Management Protocols
🔑 Core principles:
Max 1% risk per trade
Only execute at pre-identified levels
Use alerts, not emotion
Stick to your RR plan — minimum 1:2
🧠 You’re not paid for how many trades you take, you’re paid for how well you manage risk.
🧠 Weekly FRGNT Insight
"Trade what the market gives, not what your ego wants."
Stay mechanical. Stay focused. Let the probabilities work.
FX:USDJPY

USDJPY – DAILY FORECAST Q3 | W33 | D14 | Y25📊 USDJPY – DAILY FORECAST
Q3 | W33 | D14 | Y25
Daily Forecast 🔍📅
Here’s a short diagnosis of the current chart setup 🧠📈
Higher time frame order blocks have been identified — these are our patient points of interest 🎯🧭.
It’s crucial to wait for a confirmed break of structure 🧱✅ before forming a directional bias.
This keeps us disciplined and aligned with what price action is truly telling us.
📈 Risk Management Protocols
🔑 Core principles:
Max 1% risk per trade
Only execute at pre-identified levels
Use alerts, not emotion
Stick to your RR plan — minimum 1:2
🧠 You’re not paid for how many trades you take, you’re paid for how well you manage risk.
🧠 Weekly FRGNT Insight
"Trade what the market gives, not what your ego wants."
Stay mechanical. Stay focused. Let the probabilities work.
FX:USDJPY

Fundamental Market Analysis for August 15, 2025 USDJPYDespite some profit-taking after the rise toward 148.0, the pair remains supported by monetary policy divergence. The 10-year U.S. Treasury yield is approaching 4.46%, while comparable JGBs remain around 0.82% even after the summer expansion of the YCC band.
Weak momentum in the Japanese economy increases the likelihood that the Bank of Japan will postpone further tightening: real wages have fallen for the sixth consecutive month, and core CPI has eased to 2.4% y/y, reducing the pressure on the regulator to normalize policy. At the same time, Japan’s Ministry of Finance refrains from verbal interventions, being comfortable above the 145.0 level, which reduces the risk of aggressive dollar selling.
Global risk appetite remains moderate after strong U.S. PPI data, which traditionally channels capital into U.S. assets and supports USD against JPY.
Trade recommendation: BUY 147.300, SL 147.100, TP 148.400

Event horizon forming for USD/JPY? U.S. Treasury Secretary Scott Bessent told Bloomberg TV that the BOJ is behind the curve and will likely raise rates. This contrasts with BOJ Governor Kazuo Ueda, who sees no urgency despite rising wages and service-sector inflation.
Bessent also called for a more dovish U.S. Federal Reserve, suggesting a total of 150 basis points in cuts, starting with a 50 bp reduction in September.
On the weekly chart, USD/JPY is trading near 147.75, holding just above mid-channel support in an uptrend from early 2024. With Japanese and U.S. rate paths potentially diverging, traders are watching for sustained downward pressure on the dollar. A key inflection zone for a potential pivot lies between 150.90 and 154.27.

USDJPY 30Min Engaged ( Bullish Movement Detected )Time Frame: 30-Minute Warfare
Entry Protocol: Only after volume-verified breakout
🩸Bullish Movement From : 146.550
➗ Hanzo Protocol: Volume-Tiered Entry Authority
➕ Zone Activated: Dynamic market pressure detected.
The level isn’t just price — it’s a memory of where they moved size.
Volume is rising beneath the surface — not noise, but preparation.
🔥 Tactical Note:
We wait for the energy signature — when volume betrays intention.
The trap gets set. The weak follow. We execute.

USDJPY Long Setup – Liquidity Sweep + Manipulation Zone EntryUSDJPY created a clean opportunity after sweeping liquidity below a major support zone. Price briefly broke lower, collecting stops and breakout entries, before rejecting strongly from a manipulation area. This rejection signals smart money involvement and provides a solid long entry.
The stop is placed just beneath the manipulation zone for clear invalidation. The upside targets are mapped at key resistance and imbalance areas above, where the market is likely to rebalance. By scaling out at multiple levels, the trade secures profit while leaving room to capture the larger move.
This setup works because liquidity is predictable. Retail traders place stops in obvious spots, and once that liquidity is taken, institutions move the market the other way. By waiting for the sweep and entering on rejection, we align with that flow instead of being trapped.
Risk-to-reward is favorable, and management is simple: cut losses if price breaks the manipulation zone, and ride the move toward imbalance levels if momentum continues.
If you enjoy trade breakdowns like this, please like this post and follow for more setups, insights, and price action strategies.
#USDJPY #forex #priceaction #smartmoneyconcepts #liquiditysweep #daytrading #tradingviewideas

USDJPY: Will Start Growing! Here is Why:
The charts are full of distraction, disturbance and are a graveyard of fear and greed which shall not cloud our judgement on the current state of affairs in the USDJPY pair price action which suggests a high likelihood of a coming move up.
Disclosure: I am part of Trade Nation's Influencer program and receive a monthly fee for using their TradingView charts in my analysis.
❤️ Please, support our work with like & comment! ❤️

USDJPY H4 | Falling towards major supportUSD/JPY is falling towards the buy entry which is an overlap support that aligns with the 138.2% Fibonacci extension and tjhe 61.8% Fibonacci projection and could bounce from this level to the take profit.
Buy entry is at 145.89, which is an overlap support that lines up with the 138.2% Fibonacci extension and the 61.8% Fibonacci projection.
Stop loss is at 145.09, which is a pullback support that aligns with the 78.6% Fibonacci projection.
Take profit is at 147.09, which is a pullback resistance.
High Risk Investment Warning
Trading Forex/CFDs on margin carries a high level of risk and may not be suitable for all investors. Leverage can work against you.
Stratos Markets Limited (tradu.com ):
CFDs are complex instruments and come with a high risk of losing money rapidly due to leverage. 65% of retail investor accounts lose money when trading CFDs with this provider. You should consider whether you understand how CFDs work and whether you can afford to take the high risk of losing your money.
Stratos Europe Ltd (tradu.com ):
CFDs are complex instruments and come with a high risk of losing money rapidly due to leverage. 66% of retail investor accounts lose money when trading CFDs with this provider. You should consider whether you understand how CFDs work and whether you can afford to take the high risk of losing your money.
Stratos Global LLC (tradu.com ):
Losses can exceed deposits.
Please be advised that the information presented on TradingView is provided to Tradu (‘Company’, ‘we’) by a third-party provider (‘TFA Global Pte Ltd’). Please be reminded that you are solely responsible for the trading decisions on your account. There is a very high degree of risk involved in trading. Any information and/or content is intended entirely for research, educational and informational purposes only and does not constitute investment or consultation advice or investment strategy. The information is not tailored to the investment needs of any specific person and therefore does not involve a consideration of any of the investment objectives, financial situation or needs of any viewer that may receive it. Kindly also note that past performance is not a reliable indicator of future results. Actual results may differ materially from those anticipated in forward-looking or past performance statements. We assume no liability as to the accuracy or completeness of any of the information and/or content provided herein and the Company cannot be held responsible for any omission, mistake nor for any loss or damage including without limitation to any loss of profit which may arise from reliance on any information supplied by TFA Global Pte Ltd.
The speaker(s) is neither an employee, agent nor representative of Tradu and is therefore acting independently. The opinions given are their own, constitute general market commentary, and do not constitute the opinion or advice of Tradu or any form of personal or investment advice. Tradu neither endorses nor guarantees offerings of third-party speakers, nor is Tradu responsible for the content, veracity or opinions of third-party speakers, presenters or participants.

USDJPY — Bulls on Standby for a Big Comeback!USDJPY is approaching a key confluence zone where the 🟧 daily support aligns with the long-term bullish trendline.
Price has been in a medium-term correction, but now it’s knocking on the door of a potential bullish reversal.
As long as the highlighted support holds , I’ll be looking for trend-following longs targeting a continuation of the long-term bullish structure.✅
A clear break above the short-term 🔴 channel will confirm the shift in momentum and open the door for the next 📈 impulse move.
📚 Always follow your trading plan regarding entry, risk management, and trade management.
Good luck!
All Strategies Are Good; If Managed Properly!
~Richard Nasr
Disclosure: I am part of Trade Nation's Influencer program and receive a monthly fee for using their TradingView charts in my analysis.

Expectation of Fed rate cut and BoJ rate hike dampen the USDJPYDue to the recent softer US CPI print and weakening labor market data since the start of the month, market expectations for a Fed rate cut have increased. According to the CME FedWatch Tool, markets are pricing in three rate cuts for this year, with the earliest likely to occur in September.
Meanwhile, in Japan, inflation has also eased, while concerns about US demand have diminished. Japan's 2Q GDP is expected to rebound to 0.4%, avoiding a technical recession. As a result, markets anticipate the BoJ may hike rates further, which would lend additional support to the yen against the US dollar.
Technically, USDJPY has formed a downtrend, characterized by lower swing low and a bearish extension of its EMAs. If USDJPY falls below the 146 support level, the currency pair could test the next support at 145. Conversely, if USD/JPY recovers above both the 21 and 78 EMAs, the price may surge toward the resistance at 149.00.
By Van Ha Trinh - Financial Market Analyst at Exness.

USDJPY 30Min Engaged ( Buy and sell Reversal Entry Detected )Time Frame: 30-Minute Warfare
Entry Protocol: Only after volume-verified breakout
🩸Bullish Reversal : 147.400
🩸Bearish Reversal : 147.950
➗ Hanzo Protocol: Volume-Tiered Entry Authority
➕ Zone Activated: Dynamic market pressure detected.
The level isn’t just price — it’s a memory of where they moved size.
Volume is rising beneath the surface — not noise, but preparation.
🔥 Tactical Note:
We wait for the energy signature — when volume betrays intention.
The trap gets set. The weak follow. We execute.

USDJPY – Bullish Trend Continues StronglyThe USDJPY pair is currently trading within an upward channel, with solid support at 146.500 JPY, and there is potential for further gains towards the next resistance level at 148.400 JPY.
The chart shows that the price continues to form higher lows, reinforcing the bullish trend. The strength of the US dollar, supported by the Fed's tightening policies, further drives this trend.
Impact from News:
Strong US labor market data and decisive monetary policy from the Fed continue to support the USD. If USDJPY breaks through the resistance at 148.400, the bullish trend may continue toward the 150.000 JPY level.
However, if the support at 146.500 is broken, a pullback to 145.000 could occur.
In summary, the bullish trend remains strong, with the next target being the resistance at 148.400 JPY.

USD/JPY, CAD/JPY, CHF/JPY Technical UpdateA notable boost to Japanese yen strength since my last yen video has seen momentum turn in my favour for USD/JPY, CAD/JPY and CHF/JPY. Today is a quick update to the levels.
Matt Simpson, Market Analyst and City Index and Forex.com.
