USDJPY: Continue to increase in the uptrend channel!USD/JPY's next hurdle is 142.60-142.65. A break above could trigger short-covering, pushing the pair to 143.00, then 143.40-143.45. Sustained buying above 144.00 would confirm a near-term bottom and open the door for a significant rally.
Usdjpy_long

USDJPY: Analysis daily with me!USD/JPY is rebounding towards 142.50 in Tuesday's Asian session. Improved risk sentiment weakens the safe-haven Yen and supports the US Dollar. However, a Japanese holiday is limiting further upside.

USDJPY Next possible moveWe are waiting for our asset to reach our action zone, and based on the reaction, we’ll decide on our next moves.ALWAYS WAIT FOR A CONFIRMATION TO SEE IF THE PRICE VALIDATES THE ZONE.

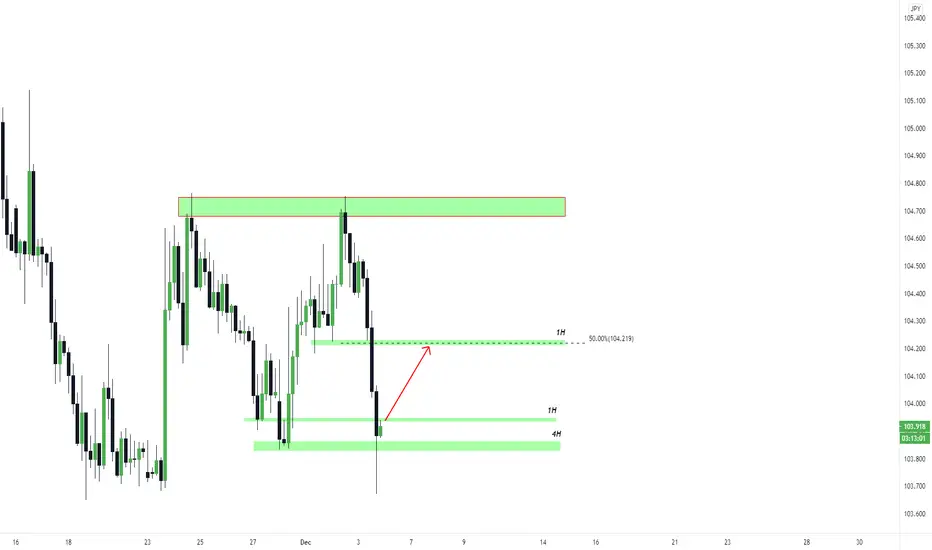
USDJPY R:R 1:4This is for short term
Marked Possible Buy zone
Once Reached Entry zone Look for Liquidity sweep and BOS in LTF then Enter
And this is risky too.
Please DYOR before entering the trade.

USDJPY going up on continuation After a hammer candle stick, this was a reversal sign that we might be going up. since we got a morning star candle stick formation coming up, we anticipate a completion of a pattern going up as a continuation to approaching level of resistance at 142.00 .
Buys should be active as soon as the bullish candle closes above the candle previous to the doji , and break the bullish pattern seen .

USDJPY long Sell We looking for selling opportunities, as most impulses will be bearish.
From the break of our structure we have a clear impulse with consecutive continuation flags. The purple Arcs show reversal (triple top), shows strong resistance and more confirmation that we taking bearish movement. The recent ascending channel have completed multi- touch confirmation ( 3 touches to complete a structure) showing that we have more probability of going down!

Possible Long shot on USDJPYI am considering taking a long on USDJPY with a big SL cluster that appears the last hours within 136.15-135.85 area.
I need a catalyst that will provide with Upside potential on USD and take a Long on the pair by tracking it's order flows and news catalysts.
Possible Catalysts for Friday 9th December.
US PPI's more positive than expectations
US Michigan data more positive than expectations
In case USDJPY isn't close to the lowest SL cluster I will play on this pair by trying to trip SL's along with the news by tomorrow.
If you want to trade like a proven funded prop trader take a look at my coaching sessions below
Learn Order Flow Trading
www.fiverr.com
Learn Fundamental News Trading
www.fiverr.com
Trading Psychology & Risk Management plus all my tools on this session
www.fiverr.com
Learn Market Sentiment and implement to your trading
www.fiverr.com
Learn by Watching over my Shoulders
www.fiverr.com

USD/JPY is in bullish swing ...According to volume and technical analysis , USD/JPY is in uptrend .
put your buy limit orders and relax .
Entery points are the 3 levels of Fibo ( 1 , 0.5 , 0 )
SL @ red Fibo level
TP @ green Fibo level
Good Luck guys ;) ...

USDJPY LongLong strategy of USDJPY. This pair is currently in uptrend in 4H TF. This is idle buy limit of this retracement and expect the price to reach the target.


USDJPY Daily UpdateWe are Expecting long Buy in USDJPY, but market is still stuck in Daily TF. We have to wait till the market break the Supply Level 115.870, then market will hit the Daily Supply 117.211, as this Supply is Retested we think that market will also break this Supply 117.211 as it is weak. After the breakout of Supply, we can buy till the Weekly Supply 120.848. Stay Connected for more Updates.

USD/JYP (US DOLLOR VS JAPANESE YEN) MAKING TRIANGLEUSD/JPY (WEEKLY) making a contracting triangle on a Primary degree B of Cycle degree 4th. We are currently on an E wave of an Intermediate degree of a triangle. we are most likely to come down for A of E of a triangle. We can see 3 waves down as an A-B-C pattern on the E wave of the triangle. Most probably we are just finished D of the triangle and we are likely to push down for E as my preferred count (projected by the black line) and if we have not finished D of the triangle so we can go to break recent high as an alternative count (projected by the red line) and after that, we will come down for triangle continuation.
DISCLOSURE - Please be informed that the information I provide is not a trading recommendation or investment advice. All of my work is for educational purposes only. All labeling and wave count have been done by me manually and I will keep changing according to the LIVE MARKET PRICE ACTION. So don't bias, hope on my trade plans. Try to learn Elliott Wave or other strategies and make your own strategy. Following is not that much easy. I am not responsible for any losses if u took the trade according to my trade plans.

USD/JPY BUY NOW...
Hello Traders, here is the full analysis for this pair,
let me know in the comment section below if you have any questions,
the entry will be taken only if all rules of the strategies will be
satisfied. I suggest you keep this pair on your watch list and see if
the rules of your strategy are satisfied.
PLZ! LIKE COMMAND AND SUBSCRIBE

USDJPY, Break out Daily Resistance, longUSDJPY, Break out Daily Resistance and price action tell further more!

UsdJpy could go to 106Since March 2020, UsdJpy is in a downtrend. I think things are about to change and the pair could go to 106 soon.
After the most recent low Usd has recovered losses and the last days of last week found the pair in a tight consolidation just under trend line support.
I expect a break of this downtrend line and a clear daily close above 104 would expose 106 resistance.

UsdJpy- 107 is my first targetAfter dropping to 103 zone, UsdJpy reversed with a HUGE bullish engulfing... candle that engulfs literally a month of trading.
I'm very bullish on this pair for this reason and I'm looking to buy dips.
My first target is 107

USDJPY Making Trend for high MoveUSDJPY chart, here its clear that it'll be bearish, but when it will be bearish?4
So, in this chart i've clear that all it is about to go up & then move long down to complete its bearish pattern as well in the case of breakout then we will take it from the upper resistance.
I hope you like this analysis & have get some idea about USDJPY Trade Area.
Friends, push the like button, write a comment and share with your mates - that would be the best. THANK YOU!
P. S. I personally open a Trade when i find entry point according to my strategy, Always make your analysis before a trade.

USDJPY (BUY) - Pay attention to some opportunities.Wait for confirmations and go for it, we have strong supports.


USD/JPY, price should make a Re-HighPrice struggled around the area of 107.00 where it found strong support exactly at 0.50 Fibonacci retracement level. After that, we expect re-high of the price as it changed the trend from bearish to bullish.
