USDJPY: 1500+ Pips Selling Opportunity, Comment Your Views?Dear Traders,
We hope you’re doing well. We’ve identified a fantastic selling opportunity in the USDJPY pair. We anticipate a drop in the DXY and increased influence for the JPY in the market. We need confirmation within a shorter timeframe. The intraday timeframe is ideal for entering or executing any potential trades. Set a stop loss above the recent daily high and target a profit of 1500+ pips from your entry point.
If you like our idea, please like and comment below. Also, follow us to receive the latest updates.
Team Setupsfx_
Usdjpyanalysis

USDJPYUSDJPY
- Bullish Channel as an corrective pattern in Short Time Frame
- Demand Zone
- RSI - Divergence
- Fibonacci Level - 50.00% / 61.80%
- Completed " 12345 " Impulsive Waves

USDJPY: +1500 Pips Possible Swing Sell In Making?Dear Traders,
I hope you’re doing well. We have a fantastic selling opportunity that we believe could drop as much as 1500 pips. In our view, the US dollar is likely to continue plummeting while the Japanese yen might finally turn bullish after nearly a year of selling. This follows the US invasion of Venezuela and potential strict tariff changes in the coming days, all of which will significantly impact the USD. Furthermore, we have some important news this week that will likely shape our chart analysis.
If you enjoy our work, please like and comment. Follow us to receive notifications when we post analysis.
Team Setupsfx_
USD/JPY target by February 12, 2026As per my Market Timing Analysis, I expect USD/JPY to trade at 153.709 and if breaks then the next target will be 151.371 by February 12, 2026.
This is my view only. Traders are suggested to conduct own technical analysis before entering into the trade with proper risk management.
www.markettiming.in

USD/JPY Price Outlook – Trade Setup (Bullish)📊 Technical Structure
FX:USDJPY USD/JPY rebounded strongly after defending the 155.70–155.90 support zone, forming a clear base and a sequence of higher lows. Price has reclaimed the 156.40 area and is now consolidating above former demand, suggesting a bullish continuation structure rather than a reversal.
As long as price holds above the key support, the technical bias remains tilted to the upside, with the next objective aligned toward the 157.40–157.60 resistance zone.
🎯 Trade Setup (Long)
Entry (Buy Zone): 155.70 – 155.90
Stop Loss: 155.55
Take Profit 1: 157.40
Take Profit 2: 157.60
Risk–Reward Ratio: ~1 : 3.37
📌 Invalidation:
A sustained break and close below 155.55 would invalidate the bullish setup.
🌍 Macro Background
Despite broader US Dollar softness driven by expectations of further Fed easing, the Japanese Yen continues to underperform. Fiscal concerns, political uncertainty, and limited near-term policy tightening from the Bank of Japan keep the JPY vulnerable.
In the short term, these factors support USD/JPY stabilization and upside follow-through, especially while technical momentum remains constructive.
🔑 Key Technical Levels
Resistance Zone: 157.40 – 157.60
Support Zone: 155.70 – 155.90
Structure Invalidation: 155.55
📝 Trade Summary
USD/JPY has completed a technical rebound from a major support area and is consolidating above it. The structure favours a buy-on-dip strategy, targeting a continuation move toward the upper resistance zone, provided price remains supported above 155.70.
⚠️ Disclaimer
This analysis is for reference only and does not constitute trading advice. Financial markets involve significant risk; proper risk and position management are essential.

USDJPY Trading Strategy – February 4, 2026USDJPY has posted three consecutive strong bullish days after rebounding from a short-term support zone on the H1 timeframe. Today’s strategy is to continue maintaining a long bias, looking to buy on a pullback toward the H1 EMA zone at 155.65–155.75.
Take-profit and stop-loss levels are set at ±30 pips from the entry price. The pending order is valid until 2:00 PM (Vietnam time).
If triggered, the position will be held until no later than 5:00 PM (Vietnam time), regardless of the outcome.

USDJPY Risky Short!
HI,Traders !
#USDJPY is surging up again
But is about to enter a wide
Supply area around 157.568
From where a local bearish
Correction is likely to take place !
Comment and subscribe to help us grow !

USDJPY (dollarYen) BUYI expect long trade on USDJPY after price broke demand zone and retest and start to rally,it gave us confidence and confluences to take buy position.

TheGrove | USDJPY Buy | Idea Trading AnalysisUSDJPY is moving in an ascending channel.. Price is trading inside a bullish ascending channel after a strong break of structure.
Previous resistance has flipped into demand, confirming bullish continuation.
We expect a decline in the channel after testing the current level which suggests that the price will continue to rise..
Hello Traders, here is the full analysis.
I think we can soon see more fall from this range! GOOD LUCK! Great BUY opportunity USDJPY
I still did my best and this is the most likely count for me at the moment.
-------------------
Traders, if you liked this idea or if you have your own opinion about it, write in the comments. I will be glad 🤝

Time To BUY USDJPY now...USDJPY has been in a clear uptrend for the last few weeks but recently dropped a slight bit in the last 24 hours down to a powerful support level! It is currently held by strong support levels which means it is extremely likely to keep heading to the upside for much longer. The next target will be the fibonacci extension zone which is shown on the chart. USDJPY has struggled to break below support but has constantly been breaking through resistance levels. time to BUY USDJPY.

USDJPY – 4H | Bullish Divergence | Japan Fundamental OutlookUSDJPY has undergone a clear structural shift on the 4H timeframe, transitioning from a corrective downtrend into a bullish market structure. Price is now forming higher highs (HH) and higher lows (HL), confirming a change in trend according to Dow Theory.
The recent impulse higher followed by a shallow pullback has allowed price to establish a new higher low, keeping structure intact. At the same time, a clean bullish divergence is visible, signaling strengthening momentum and supporting the idea that the current price zone represents a valid continuation area rather than exhaustion.
From a technical perspective:
Market structure has flipped bullish with HH–HL formation.
Bullish divergence confirms underlying strength after the pullback.
Price is holding above key structure support, keeping the continuation scenario valid.
Key Scenarios
As long as price holds above the current higher-low structure, the bias favors continuation toward 156.500, followed by 157.300.
A decisive 4H close back below the Lower-low support would weaken the bullish case and signal a deeper corrective move.
Fundamental Confluence (Japan-Side Analysis)
Fundamentals add clear directional confluence to the bullish USDJPY setup, driven primarily by persistent JPY weakness.
Monetary Policy – Bank of Japan:
The BoJ has kept rates unchanged, pausing to assess the impact of its previous hike rather than signaling a shift toward easing. While guidance remains cautiously worded, the bank has upgraded growth and inflation projections and continues to signal that further rate hikes are likely over time. However, concerns that inflation may dip below 2% in early 2026, along with political and fiscal uncertainty, argue for gradual normalization rather than aggressive tightening. This keeps real yields suppressed and limits near-term JPY strength.
Global Risk Environment:
Rising uncertainty around U.S. Federal Reserve leadership has triggered broader risk-averse sentiment across markets. Safe-haven flows have favored currencies such as the Swiss franc, while the yen has failed to attract sustained demand. Additional concerns around U.S. dollar dominance flagged by European regulators have contributed to volatility, but overall price action continues to favor JPY underperformance rather than sustained strength.
Positioning & Flow (CFTC):
CFTC data shows net positioning improving, supported by COT RSI readings, signaling sustained bullish momentum in current positioning trends. This suggests that flows remain aligned with upside continuation rather than exhaustion.
Upcoming Data Risks:
Final manufacturing PMI and monetary base data will be closely monitored. Any signs of further softness in manufacturing or accommodative monetary conditions would reinforce JPY weakness, while unexpected strength could temporarily slow upside momentum.
Domestic (Endogenous) Japanese Indicators
Japan’s internal economic data remains mixed to weak, reinforcing the broader fundamental bias:
Services activity, building permits, and employment trends show softening momentum.
Inflation indicators remain mixed, limiting urgency for tighter policy.
Rising interest rates have yet to translate into sustained currency strength.
Fiscal and balance-sheet metrics continue to weigh on longer-term confidence.
Overall, domestic conditions do not support a strong or sustained JPY recovery at this stage.
USDJPY has confirmed a bullish structural shift on the 4H timeframe, supported by momentum divergence and higher-low formation. Fundamentally, persistent JPY weakness and cautious BoJ policy continue to favor upside continuation.
Watching price action for confirmation.
Bias remains bullish while Lower-low structure holds.

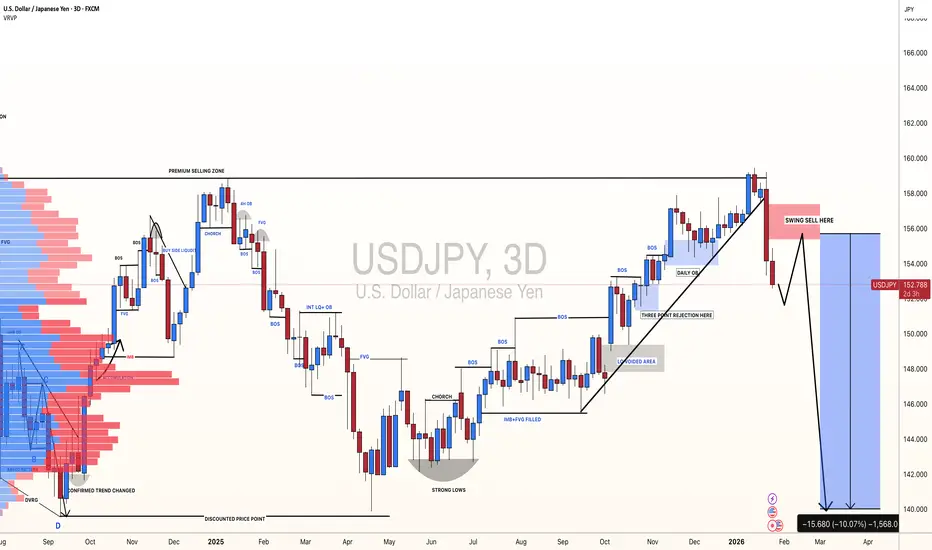
USDJPY: Two areas to sell, which one has more potential? Dear traders,
This week has been incredibly volatile and uncertainty has likely led many traders to lose their entire capital. Here’s our view on the USDJPY in a smaller timeframe. There are two promising areas for sellers. The first shows strong price resistance, while the second suggests a potential move towards the second entry point. This could happen if the price fills the liquidity void, leading to a drop from that point. Consider setting a target at 150 or 148 and a stop-loss that aligns with your risk management.
Good luck and trade safely. If you enjoy our work, please like and comment for more. Also, follow us for regular updates.
Team Setupsfx_

USDJPY Sell Trading Opportunity SpottedH4 - Strong bearish pressure.
No opposite signs.
Expecting the price to drop further from the marked resistance zones.
👉 If you enjoy this analysis, please Like, Follow, and Support the profile! Your engagement motivates us to share more quality setups.

USDJPY Short Term Sell IdeaH4 - Strong bearish momentum.
No opposite signs.
Currently it looks like a pullback is happening.
Expecting bearish continuation until the two Fibonacci resistance zones hold.
If you enjoy this idea, don’t forget to LIKE 👍, FOLLOW ✅, SHARE 🙌, and COMMENT ✍! Drop your thoughts and charts below to keep the discussion going. Your support helps keep this content free and reach more people! 🚀
--------------------------------------------------------------------------------------------------------

USDJPY Weekly planOn JPY, I expect a move to the downside following this logic: 1M FP ➡️ 1W OB ➡️➡️➡️ 1M FVG. I will consider trades if price tests the 1W OB and forms confirmation on the 1D timeframe.

USDJPY Weekly planThe plan is based on continuation of the bullish 1W OF — a retest of the 1W FVG and then a move higher toward the next target at the 1W FP. I will consider trades only if daily timeframe confirmation forms after the test of this weekly zone.

DeGRAM | USDJPY pullback from the resistance line📊 Technical Analysis
● USD/JPY has reached the upper boundary of a long-term rising channel near 159–160, where price faced repeated rejections from a horizontal resistance line, signaling trend exhaustion.
● The latest sharp bearish impulse broke the short-term rising structure, with price now projecting a corrective move toward former support zones at 152.8 and 151.2.
💡 Fundamental Analysis
● Growing expectations of tighter BoJ policy and periodic intervention risks contrast with fading US yield momentum, increasing downside pressure on USD/JPY.
✨ Summary
● Price is capped at major channel resistance.
● A medium-term pullback toward 152.8–151.2 is favored while below 159–160.
-------------------
Share your opinion in the comments and support the idea with a like. Thanks for your support!

BUY USDJPY now...USDJPY has been in a very clear uptrend for the last few weeks but recently dropped a slight bit in the last 24 hours down to a powerful support level! It is currently held by strong support levels which means it is extremely likely to keep heading to the upside for much longer. The next target will be the fibonacci extension zone which is shown on the chart. USDJPY has struggled to break below support but has constantly been breaking through resistance levels. time to BUY USDJPY.

USDJPY – Daily Trading OutlookBased on recent price action, USDJPY continues to maintain a short-term bearish trend, as the pair is currently testing the major weekly support zone around 153. As a result, most lower timeframes from the daily chart downward are showing clear sell signals, particularly when price retraces toward key resistance levels.
Today’s outlook remains consistent with this bearish scenario. Specifically, the EMA resistance zone on the H1 timeframe at 154.4 – 154.6 is considered a critical area to initiate short positions.
Sell zone: 154.4 – 154.6
Stop loss (SL)/Take profit (TP): ±30 pips from entry
If any H1 candle closes above 154.6, the current trading setup will be considered invalid. In that case, all open positions should be closed immediately, and traders should stand aside and wait for a new opportunity.

Japanese Yen Strengthens Sharply Amid Intervention ExpectationsJapanese Yen Strengthens Sharply Amid Intervention Expectations
As the USD/JPY chart shows, the exchange rate fell sharply, reaching its lowest level since early November 2025.
The sudden strengthening of the yen has been driven both by expectations ahead of the upcoming Bank of Japan meeting and by growing speculation about a possible currency intervention, which could be carried out jointly by the Japanese authorities and the US Federal Reserve.
According to media reports:
→ on Friday, the New York Fed took specific actions that were interpreted as potential precursors to an actual intervention, providing the first bearish impulse;
→ on Sunday, Japanese Prime Minister Sanae Takaichi stated that the government would take “necessary steps” against speculative market movements — reinforcing the initial momentum at the market open on Monday.
Technical Analysis of the USD/JPY Chart
Last week, when analysing movements in the dollar–yen exchange rate, we identified a long-term ascending channel and also:
→ highlighted a number of bearish signals;
→ suggested that the lower boundary of the channel was at risk of a bearish break.
Notably, after that analysis, another bearish signal emerged on the USD/JPY chart — a bull trap (marked by the arrow) above the 159 level — followed by a break below the channel’s lower boundary.
At the same time, if a parallel channel of equal width is projected lower, its bottom boundary appears to be providing some support, slowing the pace of the decline.
It cannot be ruled out that emotions will subside and the market may attempt a rebound — for example, towards the bearish gap area around 155.5. However, the aggressive nature of the USD/JPY sell-off suggests that sellers are taking control after many months of sustained upward movement.
This article represents the opinion of the Companies operating under the FXOpen brand only. It is not to be construed as an offer, solicitation, or recommendation with respect to products and services provided by the Companies operating under the FXOpen brand, nor is it to be considered financial advice.

USD/JPY Outlook: Identifying Lower High FormationThe overall market structure for USD/JPY on the 15-minute timeframe has shifted to bearish. Following the recent breakdown, the current upward move is being viewed as a corrective rally to form a lower high.
Support Turned Resistance: The green box represents a broken support level that may now act as resistance during this retracement.
Projected Path: Expecting price to struggle around the 157.50 - 158.00 region before resuming its downward trajectory.
Levels to Watch: * Resistance: 158.30
Support: 155.70
Note: This setup focuses on "Sell the Rally" logic, aligning with the dominant short-term bearish momentum.

USD/JPY: Analyzing Potential Resistance at Supply ZoneAfter a sharp bearish impulse, USD/JPY is currently in a recovery phase. The price is approaching a significant supply zone (purple box) where institutional selling pressure was previously observed.
Key Resistance: The area between 158.00 - 158.50 is acting as a strong ceiling.
Analysis: We are looking for a liquidity grab or a bearish rejection candle near the supply zone to confirm the next leg down.
Target: The primary objective is a retest of the recent lows near the 156.00 handle.
Risk Management: The bearish bias would be invalidated if the price clears and stabilizes above the 158.50 resistance zone.

USDJPY Water fall?With gap open early USDJPY has managed to create significant trend change and we may see continued drop in this market. More in depth analysis here in the video
