USDJPYUSDJPY
- Exp FIAT as an corrective pattern in Short Time Frame
- Impulse and " ABC " Correction
- Fibonacci Level - 50.00% / 61.80%
- Symmetrical Triangle in Long Time Frame
- Change of Characteristics
- Break of Structure
Usdjpyidea

USD/JPY: The Yen Regains Strength At present, USD/JPY has posted a streak of three consecutive bearish sessions, recording a short-term decline of more than 1.3%, as a consistent selling bias has begun to dominate year-end price action. For now, selling pressure has remained firm, as markets are increasingly pricing in expectations that the Bank of Japan could continue with a series of interest rate hikes heading into 2026. This outlook has helped keep Japanese bond yields at attractive levels, supporting steady demand for the yen in the short term. As long as confidence around higher rates in Japan during the first part of 2026 remains in place, selling pressure in USD/JPY is likely to continue shaping price movements over the coming trading sessions.
The Aggressive Trend Begins to Weaken
Since the early days of October, USD/JPY had managed to sustain an aggressive bullish trend. However, recent price action has started to reflect growing weakness, in line with the yen’s short-term strengthening. This has prevented the trendline from posting new highs consistently, highlighting an emerging neutral tone in price behavior. If this dynamic persists, it could place the prevailing bullish trendline—still the most relevant technical structure on the chart—at risk. Should buying pressure fail to hold, price action could give way to a short-term consolidation range, marked by persistent indecision.
Indicators
At the moment, both the RSI and the MACD are oscillating close to their respective neutral levels of 50 and 0. This suggests that indecision is building both in the average momentum of the past 14 sessions and in short-term moving average strength. If this behavior continues across both indicators, it could reinforce a more pronounced neutral phase, favoring the development of a short-term sideways range in USD/JPY price action.
Key Levels to Watch:
158.89 – Key resistance: This level corresponds to the 2025 highs and stands out as the most relevant bullish barrier to monitor. Bullish moves that manage to break above this zone could revive a stronger buying bias and open the door to an extension of the aggressive uptrend.
157.48 – Nearby barrier: A level aligned with recent highs that could act as a short-term equilibrium point. Price action holding around this area may amplify market indecision and support the formation of a more defined sideways range.
154.51 – Major support: This level aligns with the 50-period simple moving average. Bearish moves that break below this zone could put the aggressive bullish trendline at risk and open the door to a dominant bearish bias toward the close of 2025 for USD/JPY.
Written by Julian Pineda, CFA, CMT – Market Analyst

USDJPY – Pullback Into Reversal Zone | Waiting for ConfirmationUSDJPY – Pullback Into Reversal Zone | Waiting for Confirmation
Technical Analysis
USDJPY recently completed a strong bullish impulse, breaking previous structure and printing a new swing high near the top of the chart. This impulsive leg confirms that buyers were firmly in control during that phase.
After reaching the high, price shifted into a healthy corrective move, forming a sequence of lower highs and lower lows, which is typical behavior after an aggressive expansion. This correction does not yet invalidate the bullish structure; instead, it suggests profit-taking and rebalancing.
Key Level – Reversal / Demand Zone
The chart highlights a well-defined Reversal Zone (demand area), marked by:
Origin of the last impulsive bullish move
Strong bullish candles with minimal retracement
Previous imbalance and unfilled orders
Price has now returned into this zone, which is a critical area where buyers are expected to step in again.
This is not an automatic buy zone — it is a reaction zone.
Current Price Behavior – Decision Area
USDJPY is currently:
Trading inside the reversal zone
Showing reduced momentum
Printing small-bodied candles, signaling indecision
This behavior tells us the market is waiting for participation, either from buyers defending the zone or sellers breaking through it.
As clearly marked on the chart:
➡️ “Need Pattern Here”
What Confirmation to Look For
For bullish continuation, traders should wait for:
Bullish engulfing candle on 2H
Strong rejection wicks from the demand zone
Break and hold above minor structure highs
Increase in bullish volume
Without confirmation, entering early increases risk.
Projected Scenarios
Scenario 1 – Bullish Continuation (Primary Bias)
Price respects the reversal zone
Bullish pattern forms
Market moves back toward recent highs
Potential continuation toward higher resistance levels
Scenario 2 – Deeper Correction (Alternative)
Demand zone fails
Clean 2H close below the zone
Price seeks lower support levels before finding balance
Market Psychology
This setup reflects a classic “strong move → correction → decision” phase:
Late buyers are trapped at the highs
Smart money watches the reaction at demand
Patience separates professionals from emotional traders
The edge here is waiting, not guessing.
Conclusion
USDJPY is currently sitting at a high-probability reaction zone, but confirmation is mandatory. The broader structure remains bullish unless the reversal zone fails. Traders should let price reveal intent before committing capital.

USDJPY Retests Broken Resistance — Next Leg Up?The USDJPY ( FX:USDJPY ) has indeed performed as I expected in the previous idea , breaking through the falling wedge pattern and surpassing the anticipated targets, even reaching above the resistance zone(156.960 JPY-156.130 JPY).
Currently, it seems that USDJPY is undergoing a pullback towards the broken resistance zone(156.960 JPY-156.130 JPY) and is potentially entering the Potential Reversal Zone(PRZ) .
From the Elliott Wave perspective, it appears that USDJPY is completing the microwave 4 of the main wave 5. This microwave 4 may find its completion in the Potential Reversal Zone(PRZ) or near key support lines.
I expect that once USDJPY enters the Potential Reversal Zone(PRZ) , it will resume its upward movement, potentially climbing up to around 157.730 JPY. And if the bullish momentum remains strong, we could look forward to even higher targets for USDJPY.
First Target: 157.729 JPY.
Second Target: 158.24 JPY.
Stop Loss(SL): 154.82 JPY.
Points may shift as the market evolves
Please respect each other's ideas and express them politely if you agree or disagree.
📌 U.S. Dollar/Japanese Yen Analyze (USDJPY), 1-hour time frame.
🛑 Always set a Stop Loss(SL) for every position you open.
✅ This is just my idea; I’d love to see your thoughts too!
🔥 If you find it helpful, please BOOST this post and share it with your friends.

USD/JPY )Bullish trend analysis Read the captionSMC Trading point update
Technical analysis of USDJPY – 1H chart using SMC + Fibonacci + trend continuation logic.
⸻
Market Context
• Higher-timeframe bias: Bullish
• Price is still trading inside an ascending channel
• Structure remains higher highs / higher lows
• Recent move down is a pullback, not a reversal
⸻
Pullback Analysis (Why Price Dropped)
• Strong impulsive rally → liquidity taken at highs
• Price retraced back into:
• EMA 50 & EMA 200 confluence
• Previous demand zone
• Fibonacci OTE area (0.705 – 0.79)
This tells us the move down is corrective.
⸻
Key Buy Zone (Blue Area)
~155.90 – 156.20
Confluence:
• SMC demand / order block
• Fib 0.705–0.79 (OTE)
• EMA 200 support
• Channel mid-support
• Marked reaction candle + green arrow → buyers stepping in
This is the highest-probability long zone.
⸻
Fibonacci Logic
Measured from impulse low → swing high:
• 0.5 / 0.62 → shallow pullback (failed)
• 0.705 – 0.79 → institutional rebalance zone
→ Market reacted exactly where it should in a bullish trend
⸻
Trade Idea (Example Plan)
Buy on confirmation inside demand
• Entry: 155.95 – 156.15
• Stop Loss: Below demand (~155.50)
• Targets:
• TP1: 156.55 (EMA 50 / mid-range)
• TP2: 157.30
• Final TP: 157.65 (marked target point / range high)
RR potential: 1:3+
⸻
Confirmation Triggers (Important)
Enter only after:
• Bullish engulfing / pin bar (1H or 15m)
• Lower-TF CHoCH
• Strong rejection wick from demand
⸻
Invalidation
• 1H close below 155.50
• Clean break & acceptance below EMA 200 + demand
If that happens → bullish idea is invalid.
⸻ Mr SMC Trading point
Summary
This setup is a textbook bullish continuation:
• Trend intact
• OTE + demand confluence
• Mean reversion → expansion toward highs
Best execution = wait for confirmation, don’t chase.
If you want, I can:
• Refine this into a 5m / 15m sniper entry
• Or help you build a repeatable SMC trading model
Please support boost this analysis

USD/JPY | Market Structure Signals Upside Continuation🔥 USD/JPY “THE NINJA” — Breakout Play Above 157.800 | Smart Momentum Setup
📌 Asset
USD/JPY – “THE NINJA”
Forex Market Trade Opportunity Guide (Swing / Day Trade)
🧠 Trade Plan
📈 Bias: Bullish (Pending Order Strategy)
🧩 Market Logic: Compression → Resistance Break → Retest → Continuation
🎯 Entry Strategy
🚀 BUY ONLY AFTER CONFIRMED BREAKOUT
🔑 Key Level: 157.800
✅ Enter after resistance breakout + retest confirmation
⚠️ Avoid early entries before structure confirms
🛑 Stop Loss (Risk Control)
⛔ Thief SL Reference: 156.000
📌 Place SL only after breakout & retest is validated
⚖️ Adjust SL as per:
Your timeframe
Risk-to-reward model
Position sizing rules
📝 This SL is a reference, not a recommendation. Trade responsibly.
🎯 Target / Exit Logic
🚨 Target Zone: 160.500
👮♂️ Police Force Zone =
Strong historical resistance
Overbought conditions
Liquidity trap probability
Correction risk increases
💰 Book profits smartly — do not marry the trade
📝 TP is a reference, not a fixed rule. Manage exits based on market behavior.
🔗 Related Pairs to Watch (Correlation Map)
💵 JPY Strength / Weakness Confirmation
OANDA:EURJPY 📊
➝ Confirms broad JPY weakness if pushing higher
OANDA:GBPJPY ⚡
➝ High beta pair, leads momentum moves in JPY
OANDA:CHFJPY 🧱
➝ Risk sentiment gauge (safe-haven vs carry trade)
💲 USD Strength Confirmation
TVC:DXY 📈
➝ USD strength above key levels supports USD/JPY upside
OANDA:USDCHF 🔄
➝ Confirms dollar demand vs safe havens
👉 If JPY weakens across crosses + USD holds firm, USD/JPY continuation probability increases.
🌍 Fundamental & Economic Factors to Monitor
🏦 Bank of Japan (BoJ)
Policy remains accommodative
Yield control stance keeps JPY structurally weak
Any verbal intervention = short-term volatility only
🏛 Federal Reserve (USD Side)
Higher-for-longer rate narrative supports USD
Strong US data → USD bid → USD/JPY bullish pressure
📊 Key Upcoming Data (High Impact)
🇺🇸 US CPI / Core CPI
🇺🇸 NFP & Unemployment Rate
🇺🇸 Retail Sales
🇯🇵 BoJ statements / inflation data
📌 Strong US data + neutral BoJ = bullish continuation fuel
⚠️ Risk Notes
Avoid entries during high-impact news spikes
Wait for close above resistance, not just wicks
Liquidity hunts are common near psychological levels
🧭 Final Trader Reminder
📌 This is a structure-based breakout plan, not financial advice.
🧠 Trade with discipline.
📊 Let price confirm.
💼 Protect capital first — profits follow.
👍 If this breakdown adds value, support with a like & follow.
📢 Share with traders who respect structure, patience, and risk control.

1217 USDJPY 4H TRADING PLANHello traders,
Current Price: 155.547
1. Key Technical Levels (Based on the Chart)
Support: 154.666 (Point A), 155.00 (shortterm EMA support)
Resistance: 156.164 (tp1), 156.945 (tp2/Point X)
2. Fundamental Context (Today’s Core Drivers)
BoJ Meeting Preview: The Bank of Japan is widely expected to hike rates by 25bps on Dec 1819, so JPY strength is priced in premeeting, weighing on USD/JPY.
Fed Policy: U.S. Dec PMI weakness + inflation rebound have cooled Fed ratecut bets, but the USD lacks sustained upside momentum.
Market Sentiment: Carry trade unwinding and mild risk aversion add downward pressure to USD/JPY.
3. Long Strategy (Focused Today)
Entry Condition: Price pulls back to 155.00 (EMA support) + RSI bounces from 40 level, confirmed by a bullish candlestick.
Entry Price: 155.00155.10
Stop Loss: 154.60 (below Point A support)
Take Profits:
1. First target: 156.16 (tp1 resistance)
2. Second target: 156.95 (tp2/Point X resistance)
4. Today’s Action Plan
Prioritize the long setup: Wait for price to stabilize around 155.00 with a bullish signal before entering. Avoid forced entries if no clear confirmation.
GOOD LUCK!
LESS IS MORE!

Short opportunity On usd jpyAccording to Bollinger bands strategy
Accroding Breakout of Uptrendline
According to Fibo retracement
According to Gap (147.800-149.100)
According To CCI
We expect an Big Short Move to

USDJPY Swing Opportunity | Buyers Defend SMA📌 USD/JPY — “THE NINJA”
💱 Forex Market Trade Opportunity Guide (Swing / Day Trade)
🔍 Market Bias
🟢 Bullish Structure Confirmed
Price is respecting the Simple Moving Average (SMA) pullback, signaling continuation strength after corrective moves.
📈 Trading Plan
✅ Bullish Plan: Active
📊 Strategy Type: Trend Continuation + Pullback Execution
🎯 Entry Strategy (Layered Method)
🧩 Flexible Entry: Any price level using layering strategy
This approach helps reduce timing risk and improves average entry price.
🔹 Buy Limit Layers
156.000
156.500
157.000
➡️ (You may increase or adjust layers based on your risk model)
🛑 Stop Loss (Risk Control)
🔻 SL Level: 155.500
⚠️ Dear Ladies & Gentlemen, SL shared is not mandatory.
➡️ Adjust your stop loss according to your own strategy & risk appetite.
🎯 Profit Objective
🚔 POLICE FORCE Zone acting as strong resistance
📉 Market is showing overbought conditions + potential trap, suggesting profit-booking pressure.
✅ Target: 159.500
⚠️ TP shared is not mandatory.
➡️ Manage profits based on your own trading plan & discipline.
🧠 Key Technical Insights
📌 SMA acting as dynamic support
📌 Higher-timeframe trend remains bullish
📌 Layered entries improve R:R during pullbacks
📌 Resistance zone historically triggers corrections
🔗 Related Pairs to Watch (USD Correlation Focus)
💵 USD Index (DXY)
📈 Strength in DXY = Bullish confirmation for USD/JPY
📉 Weak DXY = Watch for pullback or consolidation
🇯🇵 JPY Crosses
EUR/JPY – Confirms yen weakness if bullish
GBP/JPY – High volatility, confirms momentum
CHF/JPY – Safe-haven comparison for risk sentiment
➡️ If JPY is weak across crosses, USD/JPY bullish bias stays valid
💲 USD Major Pairs
USD/CHF – Positive USD correlation
USD/CAD – Dollar strength confirmation
EUR/USD – Inverse relationship (EUR/USD down = USD strong)
🌍 Macro Sentiment Watch
📊 Risk-ON environment favors JPY weakness
🏦 Yield-driven USD demand supports upside continuation
⚠️ Watch for sharp corrections near resistance zones
⭐ If this analysis adds value
👍 Like | 💬 Comment | ⭐ Save | 🔁 Share
Your engagement helps this idea reach more traders.

USDJPY Breaks Falling Wedge Pattern, Ready to pump!USDJPY ( FX:USDJPY ) has started to climb from its Support lines and Support zone(155.100 JPY-154.120 JPY), showing good momentum in its upward movement.
From a classical technical analysis perspective, it seems that USDJPY has successfully broken the upper lines of the falling wedge pattern on the 1-hour timeframe, which is a positive sign for the continuation of the bullish trend.
From an Elliott Wave perspective, it appears that USDJPY has completed main wave 4 using a Double Three Correction(WXY) within the Support zone(155.100 JPY-154.120 JPY).
Looking ahead, I expect USDJPY to resume its upward movement following a pullback to its Fibonacci levels, potentially rising at least to the 155.94 JPY.
First Target: 155.94 JPY.
Second Target: 156.27 JPY.
Stop Loss(SL): 154.82 JPY.
Please respect each other's ideas and express them politely if you agree or disagree.
📌 U.S. Dollar/Japanese Yen Analyze (USDJPY), 1-hour time frame.
🛑 Always set a Stop Loss(SL) for every position you open.
✅ This is just my idea; I’d love to see your thoughts too!
🔥 If you find it helpful, please BOOST this post and share it with your friends.

USDJPY - Buy Right nowUSDJPY has been in a very clear uptrend for the last few weeks and has been for a while! It is currently inside an upward channel and has recently broken the last major resistance zone which means it is extremely likely to keep heading to the upside for much longer (just a very minor resistance level which is causing slight delays for its bullish movements). The next target will be the fibonacci extension zone which is shown on the chart. USDJPY has struggled to break below support but has constantly been breaking through resistance levels. Time to BUY USDJPY

USD/JPY Trading Below SMA Signals Downside RiskUSD/JPY "THE NINJA" - BEARISH PROFIT PATHWAY SETUP 📉💰
📊 MARKET STATUS (REAL-TIME VERIFIED)
Current Price: ~154.79 - 155.14 ✅
Timeframe: 4H Chart Analysis
Market Sentiment: BEARISH with Strong Technical Confirmation
🎯 TRADE SETUP BREAKDOWN
🔴 ENTRY STRATEGY
Wait for Confirmation: Simple Moving Average BREAKOUT & RETEST
Entry Zone: Near @154.700
⚠️ IMPORTANT: Do NOT enter blindly! Wait for proper SMA breakout and retest confirmation in 4H timeframe.
🛑 STOP LOSS MANAGEMENT
Recommended SL: @155.500 (Thief's SL)
⚡ CRITICAL NOTES FOR OG TRADERS:
Place your SL AFTER breakout & retest confirmation
Adjust based on YOUR strategy and risk tolerance
This is NOT financial advice - trade at your own risk
Ladies & Gentlemen (Thief OG's): YOU control your risk management!
🎯 PROFIT TARGET
Primary TP: @153.500
Why This Target? 🔍
✅ Strong Support Zone
✅ Oversold Conditions
✅ Liquidity Trap Area
✅ Multi-pair Correlation Confluence
💎 SMART EXIT STRATEGY:
Scale out profits at psychological levels
Trail your SL as price moves in your favor
Ladies & Gentlemen (Thief OG's): Take money at YOUR discretion!
NOT a recommendation - YOUR money, YOUR rules!
💹 CORRELATED PAIRS TO WATCH (USD DOLLAR PAIRS)
🔗 POSITIVE CORRELATION (Move Together with USD/JPY)
USD/CHF - Swiss Franc pair (Strong USD correlation)
USD/CAD - Canadian Dollar pair (Commodity-linked)
🔄 NEGATIVE CORRELATION (Move Opposite to USD/JPY)
EUR/USD (~-1.1765) - Euro inverse relationship
GBP/USD (~1.3387) - Pound inverse movement
AUD/USD (~0.6650) - Aussie inverse correlation
YEN CROSS PAIRS TO MONITOR
EUR/JPY (~182.05) - Euro-Yen correlation check
GBP/JPY (~207.39) - Pound-Yen higher volatility
AUD/JPY (~102.77) - Commodity currency correlation
🧠 KEY TECHNICAL POINTS & CORRELATION INSIGHTS
📌 WHY THIS SETUP WORKS:
1. USD Strength Dynamics
When USD/JPY moves down, we typically see:
EUR/USD and GBP/USD move UP (negative correlation)
JPY strength across all yen crosses (EUR/JPY, GBP/JPY, AUD/JPY decline)
2. Multi-Pair Confirmation
Watch these for bearish confirmation:
If EUR/JPY and GBP/JPY show weakness = Strong JPY buying
If AUD/JPY breaks support = Risk-off sentiment (JPY gains)
If USD/CHF weakens = General USD weakness
3. Risk Sentiment Indicator
JPY is a SAFE-HAVEN currency:
Risk-off = JPY strengthens (USD/JPY drops)
Risk-on = JPY weakens (USD/JPY rises)
4. Central Bank Watch 🏦
Federal Reserve: Rate decisions impact USD strength
Bank of Japan: Potential policy shifts affect JPY direction
Interest rate differential = KEY driver for this pair
⚠️ RISK DISCLAIMER
🚨 READ CAREFULLY:
This is a trade idea, NOT financial advice
Past performance ≠ future results
Forex trading carries significant risk
Only risk capital you can afford to lose
Always use proper risk management (1-2% per trade max)
Adjust position sizing based on YOUR account size
NO guarantees of profit - markets are unpredictable
👥 Dear Ladies & Gentlemen (Thief OG's):
I am NOT recommending you blindly follow this setup. This is MY analysis based on technical confluence. YOU make your own decisions. YOU manage your own risk. YOU take responsibility for YOUR trades.
📈 TRADE MANAGEMENT CHECKLIST
✅ Wait for SMA breakout confirmation
✅ Confirm retest at @154.700 zone
✅ Check correlated pairs for confluence
✅ Set SL at @155.500 (or based on YOUR strategy)
✅ Monitor EUR/JPY, GBP/JPY for JPY strength
✅ Watch USD/CHF for USD weakness confirmation
✅ Scale out at @153.500 or your target
✅ Trail SL as trade progresses
🎯 FINAL WORD
This setup combines:
Technical breakout strategy
Multi-timeframe analysis
Correlation confluence
Risk management principles
Smart money concepts
Remember: The market doesn't owe you anything. Trade smart, manage risk, and protect your capital FIRST, profits SECOND.
💬 ENGAGE WITH THIS IDEA
👍 If you found this analysis helpful!
💭 Comment your thoughts and strategy
📊 Share your USD/JPY setups
🔔 Follow for more professional trade ideas
Stay Sharp. Trade Smart. "THE NINJA" Way! 🥷
Disclaimer: Trading involves substantial risk. This is educational content only. Always do your own research and consult with financial professionals before trading.
#USDJPY #ForexTrading #TechnicalAnalysis #DayTrading #PriceAction #TheNinja #BearishSetup #ForexStrategy #CurrencyCorrelation #RiskManagement #ForexEducation #TradingIdeas #JPY #USD #ForexSignals

USDJPY - Buy nowUSDJPY has been in a very clear uptrend for the last few weeks and has been for a while! It is currently inside an upward channel and has recently broken the last major resistance zone which means it is extremely likely to keep heading to the upside for much longer (just a very minor resistance level which is causing slight delays for its bullish movements). The next target will be the fibonacci extension zone which is shown on the chart. USDJPY has struggled to break below support but has constantly been breaking through resistance levels. BUY USDJPY

#USDJPY: One Last Bullish Push Taking Price To 170!The USDJPY pair has been bullish for the past few months, evidenced by the extreme bullish volume in the market. Given the weakening JPY, we believe the price is likely to rise further. A final push could help us with our trading setup.
You might consider setting two take profit levels.
Like and comment for more.
Team Setupsfx_

#USDJPY: From +1100 Pips To +1350 Pips A Possible Swing BuyDear Traders,
I hope you’re all having a great trading week!
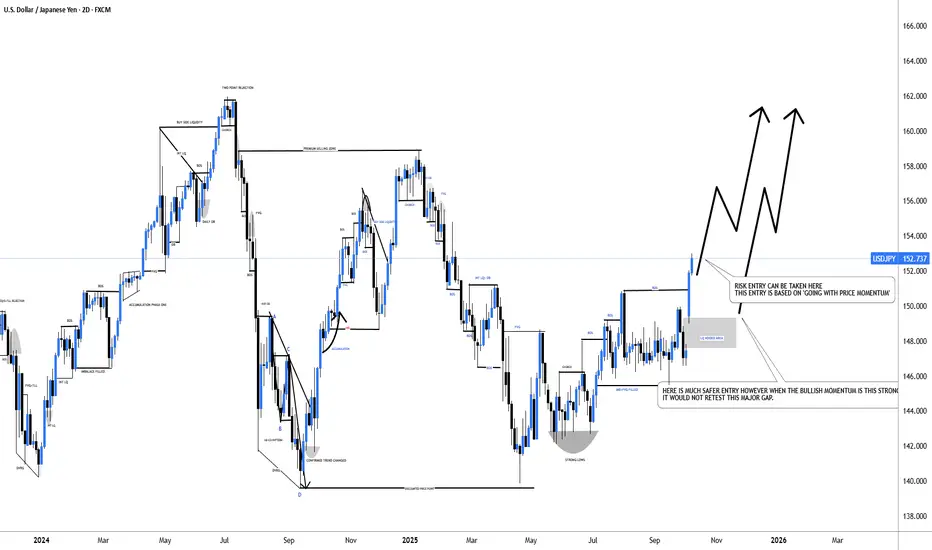
The USDJPY is currently trading in a 152 price range and is experiencing extreme bullish momentum. The price is rallying without making any corrections, primarily due to the collapse of the Yen. We may see it fall further below. Given this market condition, it’s much riskier to trade with USDJPY.
Here are two approaches you may consider:
1. Take the entry at the current trading price with an accurate stop loss while using a smaller timeframe.
2. Wait for the price to return to the liquidity gap area, where it’s expected to fill.
Good luck, and thank you for your support throughout.
We appreciate your support.
Team Setupsfx_
#USDJPY: Price Is Heading Towards 167, With Two Targets! Dear Fellow Traders,
UJ has reversed nicely from our entry zone, and the price is likely to head towards the 167 price range. We may see the price hitting our first target within a few weeks, while the second target will take longer. This is a swing target, and there will be many news events that will affect UJ’s future price.
For a better insight, please read the chart.
Team Setupsfx_

USD/JPY Price Outlook 📊 Technical Structure
FX:USDJPY USD/JPY remains under bearish pressure below the descending trendline and the 155.99–156.17 resistance zone. Price repeatedly failed to break through this area, signalling strong selling interest and reinforcing the broader downtrend structure.
The pair continues to oscillate toward the 155.20–155.02 support zone, where buyers have previously stepped in, but momentum still favours the downside as long as the market stays below 156.00. A retest of resistance followed by rejection would keep the bearish sequence intact. A confirmed breakout above 156.17 would invalidate this structure.
🎯 Trade Setup (Bearish Scenario)
Bias: Sell from resistance after rejection.
Entry: 155.99 – 156.17
Stop Loss: 156.40
Take Profit 1: 155.20
Take Profit 2: 155.02
Risk–Reward Ratio: ~1 : 2.4
The bearish idea remains valid while price remains below 156.17 on a 4H closing basis.
🌐 Macro Background (Simplified)
JPY fundamentals continue to lean supportive despite short-term fluctuations:
Markets expect the Bank of Japan to hike rates as early as next week, supporting the Yen and reinforcing policy divergence with the US.
The Federal Reserve delivered another rate cut, keeping the USD soft and maintaining downward pressure on USD/JPY.
Risk-on sentiment limits safe-haven demand for JPY, but BoJ’s tightening trajectory outweighs this, keeping upside capped.
Japan’s weaker fiscal outlook creates some hesitation among Yen buyers, yet does not offset the broader macro forces favouring JPY strength.
Overall, the macro environment aligns with the technical bias for further USD/JPY downside.
🔑 Key Technical Levels
Resistance Zone: 155.99 – 156.17
Support Zone: 155.20 – 155.02
Invalidation Level: 156.17 (4H breakout)
📌 Trade Summary
USD/JPY continues to respect the descending trendline and strong resistance near 156.00. As long as the pair remains capped below 156.17, the market maintains a bearish bias toward 155.20–155.02. Retests of resistance provide attractive short opportunities aligned with both technical and macro trends.
⚠️ Disclaimer
This analysis is for reference only and does not constitute trading advice. Trading involves significant risk, and proper risk management is essential.

Elite | USD/JPY – Neutral Structure | Breakdown or FakedownFX:USDJPY
Price is currently ranging between rejection supply and lower support. We have BOS confirmations both ways, which keeps structure neutral. A decision will come only when market confirms either direction.
🔹If Buyers Take Control
• Break + retest above 156.00–156.450 supply activates bullish continuation.
• Clean bullish structure toward liquidity.
🎯 Upside Target: 157.800 (major liquidity sweep zone)
🔸If Sellers Take Control
• Breakdown + candle close below 155.00/154.500 confirms bearish continuation.
• Momentum should accelerate once structure fails.
🎯 Final Downside Target: 152.100
⚠️ Wait for confirmation candle — no premature directional bias.
Disclaimer: Market analysis only — not financial advice.

Selena | USDJPY 2H – Demand Retest + Structural Long SetupFX:USDJPY
If price reacts bullishly from the marked OB zone, upside liquidity lies toward 156.30 → 157.20 → 158.00, which aligns with prior rejection highs. A deeper sweep toward 153.40–152.70 remains secondary buy interest if first zone fails.
📈 Bullish Case 🚀 (Primary Idea)
Hold above demand zone 154.40–154.80 → breakout expected.
🎯 Target 1 → 156.30
🎯 Target 2 → 157.20
🎯 Final Target → 158.00 (liquidity + premium zone)
📉 Bearish Case (Invalidation)
Close below 153.40 shifts structure downward
Strong reversal below 152.70 only.
Current Levels to Watch
Resistance 🔴: 155.50 / 156.30 / 158.00
Support 🟢: 154.40 / 153.40 / 152.70
⚠️ Disclaimer: Educational analysis only — not financial advice.

The gain phase before the pulse USDJPY continues to develop its structure following recent strengthening. The pair shows confident upward impulses, while corrective pullbacks remain limited, indicating buyer dominance.
The current dynamics are forming a foundation for further growth: the market holds above key levels and is gradually accumulating energy for continued movement. Within the structure, a sequence of advances is visible, confirming sustained interest in the asset from market participants.
An additional factor is demand for the dollar, supported by expectations of steady Federal Reserve policy. This increases the likelihood that USDJPY will consolidate in the upward direction and develop a new impulse.

USD/JPY — Next Bullish Wave? Entry Layers & Target Roadmap📌 Asset: USD/JPY — “THE NINJA”
📊 Market Type: Forex | Swing / Day Trade Opportunity Guide
📈 Trade Thesis — Bullish Structure With MA Pullback Confirmation
USD/JPY continues to hold a clean bullish structure, with price respecting the moving averages and maintaining upward momentum. The recent pullback into dynamic support offers a favorable zone for layered accumulation using the Thief-style entry map. This setup focuses on capturing continuation while managing exposure through structured limit layering.
Thief Strategy Layered Entry Zones (Multiple Buy Limits)
To maintain precision and reduce risk concentration, the plan utilizes multiple staggered limit orders:
Buy Limit Layer 1: 154.500
Buy Limit Layer 2: 155.000
Buy Limit Layer 3: 155.500
(📌 You may increase or reduce the number of layers depending on your own system.)
This layered method helps in catching deeper pullbacks while keeping average entry efficient.
🛡️ Risk Management — Adjust to Your Framework
Stop Loss:
🔐 Thief Protective Zone: 154.000
Dear Ladies & Gentlemen (Thief OG’s), this is simply my personal protective line.
You are encouraged to adjust your SL to fit your own strategy, volatility tolerance, and trade model.
🎯 Target Zone — Take Profit With Discipline
The upside is approaching a strong resistance region aligned with overbought metrics + potential trap behavior.
To avoid getting caught at the top, consider managing profits into:
🎯 Take-Profit Target: 157.800
Again, take profits according to your own structure — you make the money, you decide how to secure it.
🌐 Correlated Pairs to Watch ($) — Key Notes & Insights
1. TVC:DXY (US Dollar Index)
Strong USD strength supports bullish USD/JPY continuation.
If DXY pulls back sharply, USD/JPY may stall or dip into deeper layers.
2. NASDAQ:JPY Basket / Yen Weakness Indicators
Continued BoJ dovish tone = structural weakness in JPY.
Any sudden BoJ comments can create sharp volatility — monitor news carefully.
3. OANDA:XAUUSD (Gold vs USD)
Gold ↘️ usually supports USD strength → often correlates with bullish USD/JPY flows.
If gold spikes aggressively, USD might weaken temporarily.
4. FOREXCOM:SPX500 / US Indices
Risk-on sentiment → often weakens JPY (safe-haven outflows), creating USD/JPY upside pressure.
Risk-off can create temporary JPY strength.
5. TVC:US10Y / Bond Yields
Rising US yields → strong bullish driver for USD/JPY.
Always track yield momentum during major USD transitions.
📝 Final Thoughts
This plan blends structured Thief layering with a clean technical continuation setup. Manage position size, follow your own rules, and adapt based on live momentum.
Trade safe & stay sharp, Ladies & Gentlemen (Thief OG’s).
The Ninja moves fast — be prepared, be disciplined, and take profits with confidence.

USD/JPY) Bearish trend analysis Read The captionSMC Trading point update
Technical analysis of USD/JPY – 1H SMC Outlook
1. Market Context – Bearish Framework
Price is trading inside a descending channel, creating:
Lower highs
Lower lows
This indicates a macro bearish trend and a high probability that rallies into premium areas will be sold.
Your trendlines confirm:
Market respecting upper trendline as dynamic supply.
Lower boundary acting as long-term liquidity pool.
---
2. Current Price Action – Corrective Rally
Recent bullish push looks corrective, not impulsive:
Pullback into imbalance (FVG)
Respecting 50 EMA / under 200 EMA
Weak momentum compared to prior sell legs
This supports the idea of reaction + continuation lower.
---
3. Supply + FVG Confluence (Main POI)
The blue box marks a strong supply/FVG zone around:
155.45 – 155.65
Confluences:
Imbalance fill
Previous supply zone
Structure mitigation level
Upper trendline touch
200 EMA overhead
This is a premium zone for shorts.
---
4. Liquidity Perspective
There is resting liquidity:
Above POI
Enough liquidity to fuel a sharp rejection
Expect a wick into supply (sweep)
Below price
Equal lows / clean structure at 154.08
Major liquidity magnet
This supports a sell-side target.
---
5. Expected Price Behavior (Base Case)
Ideal flow (as drawn on chart):
1. Price taps into FVG + supply
2. Rejection with displacement
3. Lower high forms
4. Expansion sell-off
5. Sweep of downside liquidity
Primary target:
154.087
Extended target (channel low):
153.60 – 153.30
---
6. Entry Plan (If Trading This)
Entry:
155.45 – 155.65 (FVG/Supply zone)
Stop:
Above rejection wick
155.90 – 156.05 depending on aggressiveness
Targets:
1. 154.70 (partial)
2. 154.08 (model target)
3. 153.60 (runner)
R:R potential: 1:3 to 1:6
---
7. Validations & Confirmations
Lower time frame confirmation (5–15m):
Look for:
CHoCH / BOS bearish
Rejection wick at POI
FVG left behind
Market structure shift
This will filter weak entries.
---
8. What Can Invalidate the Setup?
Bullish continuation invalidates if:
Price breaks and holds above 156.00
Strong bullish displacement closes above trendline
FVG fails to reject
This would imply accumulation, not distribution.
Until then, bearish bias remains valid.
Mr SMC Trading point
---
Overall Thesis
This is a textbook corrective pullback into premium prices inside a downtrend:
Trend: bearish
Structure: lower highs
Context: corrective rally
POI: supply + FVG + trendline
Target: liquidity below
Bias: Short from premium → sell-side liquidity
Very clean setup.
---
Please support boost 🚀 this analysis

Is USD/JPY Ready for the Next Leg Higher?🔥 USD/JPY "THE NINJA" - LAYERED BULLISH SWING SETUP 🔥
Hey Traders! 👋 The King of Forex is showing strength, and I'm plotting a strategic bullish swing trade on USD/JPY "THE NINJA". This isn't a chase; it's a patient, layered entry plan for the next leg up! 📈
🎯 TRADE PLAN: "THE THIEF" LAYERED STRATEGY
This method uses multiple limit orders to "steal" good prices on dips, averaging into a position without FOMO.
Direction: Bullish 🐂
Style: Swing Trade
⚡ ENTRY ZONE (LAYERED LIMITS):
I am setting buy limit orders at these key support layers:
1st Layer: 153.600 🟢
2nd Layer: 154.000 🟢
3rd Layer: 154.400 🟢
Pro Tip: You can increase or adjust these layers based on your capital and risk appetite. The goal is to scale in!
🚨 STOP LOSS (MANAGE YOUR RISK!):
My hard stop is placed below a key support level at 153.300.
⚠️ IMPORTANT NOTE: This is MY stop loss. You MUST adjust your position size and SL based on YOUR own risk tolerance and strategy. Protect your capital! 🛡️
🎯 PROFIT TARGET:
Primary Target: 156.000 ✅
Why Here? This zone converges with a strong moving average resistance, potential overbought conditions, and could be a "trap" for late buyers. Let's escape with profits before the crowd! 💰
⚠️ IMPORTANT NOTE: This is MY target. You are free to take partial profits earlier or trail your stop. "Make money, then take money" at your own discretion!
🔍 MARKET CONTEXT & KEY DRIVERS
Trend: The broader trend remains bullish, driven by interest rate differentials between the hawkish Fed and the dovish BoJ.
Key Level: We are respecting the psychological 155.00 level. A break and close above could accelerate the move.
Caution: The market is watching for any potential FX intervention from Japanese authorities, which can cause violent, short-term reversals.
🌐 RELATED PAIRS TO WATCH
Diversify your view! Don't trade USD/JPY in a vacuum.
TVC:DXY (US Dollar Index): 📊
Correlation: Positive. A strong DXY typically means a strong USD/JPY. If the dollar is rallying broadly, this trade has a stronger tailwind.
EUR/USD ( FX:EURUSD ): 🇪🇺🇺🇸
Correlation: Negative (Inverse). Often, if USD/JPY is going up, EUR/USD is going down. Watch this for overall USD strength/weakness.
GBP/JPY ( OANDA:GBPJPY ): 🇬🇧🇯🇵
Correlation: Positive. This is a "risk-on" JPY pair. If both USD/JPY and GBP/JPY are rising, it confirms a broad-based sell-off in the Japanese Yen.
USD/CHF ( OANDA:USDCHF ): 🇺🇸🇨🇭
Correlation: Positive. Both are often traded as "USD-strength" pairs, though CHF can have its own safe-haven flows.
✅ SUMMARY
Asset: USD/JPY (The Ninja)
Bias: Bullish Swing
Strategy: Layered "Thief" Entries
Target: 156.000
Stop Loss: 153.300
Let me know your thoughts in the comments! 👇
What's your target? Did you layer your entries?
Like & Follow if you found this guide useful! 🚀 Good luck, and trade safe!
#Forex #Trading #USDJPY #NINJA #SwingTrading #Bullish #TradingStrategy #DXY #EURUSD #GBPJPY
