DXY Analysis – Are Bad News Already Priced In?Since Trump entered the White House, the U.S. Dollar has taken a hard hit against its major counterparts, losing more than 10% overall.
But looking closer at the chart, we see a different story: since the April low around 97.80, the DXY has been stuck in a range-bound pattern, with the exception of July’s dip that was quickly reversed.
Lately, the USD has faced strong headwinds:
• Two weak NFP reports in a row.
• The Fed hinting at rate cuts.
• A constant flow of bearish headlines.
And yet, the Dollar did not collapse to fresh lows — instead, it simply revisited the same levels as before. This is a classic market signal that bad news may already be priced in.
From a technical standpoint, August was nothing but an annoying tight range:
• Support around 97.50.
• Resistance near 98.50.
Now, although the index looks like it’s breaking lower, I suspect this is another false breakdown, one that could be reversed quickly. If that plays out, the stage is set for a push higher — potentially to the 100 zone, a clean 3% rise from current levels.
Such a move would naturally translate into pressure on the majors:
• EUR/USD could slide back toward 1.14.
• GBP/USD could retreat near 1.35.
For now, I’m watching closely for reversal signals. The market has punished the USD for months, but if sellers are exhausted, the Dollar may surprise to the upside. 🚀
DJ FXCM Index

Bearish momentum to extend?The US Dollar Index (DXY) has rejected off the pivot and could drop to the 1st support.
Pivot: 98.63
1st Support: 97.12
1st Resistance: 100.21
Disclaimer:
The above opinions given constitute general market commentary, and do not constitute the opinion or advice of IC Markets or any form of personal or investment advice.
Any opinions, news, research, analyses, prices, other information, or links to third-party sites contained on this website are provided on an "as-is" basis, are intended only to be informative, is not an advice nor a recommendation, nor research, or a record of our trading prices, or an offer of, or solicitation for a transaction in any financial instrument and thus should not be treated as such. The information provided does not involve any specific investment objectives, financial situation and needs of any specific person who may receive it. Please be aware, that past performance is not a reliable indicator of future performance and/or results. Past Performance or Forward-looking scenarios based upon the reasonable beliefs of the third-party provider are not a guarantee of future performance. Actual results may differ materially from those anticipated in forward-looking or past performance statements. IC Markets makes no representation or warranty and assumes no liability as to the accuracy or completeness of the information provided, nor any loss arising from any investment based on a recommendation, forecast or any information supplied by any third-party.

US Dollar: Still Bearish-Neutral, But Is The Correction Ending?Welcome back to the Weekly Forex Forecast for the week of Sept 8-12th.
In this video, we will analyze the following FX market: USD Dollar
The USD is still grinding sideways, but it did sweep the low of the consolidation Friday on bad NFP numbers. Worth mentioning is it finally made contact with a significant demand zone as well. As bearish-neutral as the DXY has looked over the past several weeks, there is potential here that if has finally found support for higher prices.
As long as the market maintains the protected low, we are still in correction territory. The potential for a move higher remains.
React and do not predict.
Enjoy!
May profits be upon you.
Leave any questions or comments in the comment section.
I appreciate any feedback from my viewers!
Disclaimer:
I do not provide personal investment advice and I am not a qualified licensed investment advisor.
All information found here, including any ideas, opinions, views, predictions, forecasts, commentaries, suggestions, expressed or implied herein, are for informational, entertainment or educational purposes only and should not be construed as personal investment advice. While the information provided is believed to be accurate, it may include errors or inaccuracies.
I will not and cannot be held liable for any actions you take as a result of anything you read here.
Conduct your own due diligence, or consult a licensed financial advisor or broker before making any and all investment decisions. Any investments, trades, speculations, or decisions made on the basis of any information found on this channel, expressed or implied herein, are committed at your own risk, financial or otherwise.

USDJPY Primed for Push Higher! Ascending Channel & Bullish🔮 USDJPY Technical Forecast & Trading Strategy | Week of Sept 6th, 2025
Current Spot Price: 147.385 | CFD | Date: Sept 6, 2025
🟢 Overall Bias: BULLISH | The pair is trading within a clear bullish structure on higher timeframes. All pullbacks are currently being bought, indicating strong underlying demand.
📊 Multi-Timeframe Technical Breakdown
1. Chart Pattern & Theory Convergence:
🚩 Bullish Continuation Patterns: The price action from the August low exhibits characteristics of a Bull Flag or an Ascending Channel. A clean break above the 148.00 resistance would confirm this pattern and open a path significantly higher.
📐 Gann Theory & Square of 9: The current price is consolidating near a key Gann angle. A hold above 147.00 is crucial for the bulls to maintain control and propel price towards the next Gann objective near 148.80-149.20.
🌊 E lliott Wave Theory: The rally from the late August low is impulsive in nature, suggesting this is part of a larger Wave 3 or Wave C push higher. Any dip is likely a Wave 4 correction before a final Wave 5 thrust.
☁️ Ichimoku Kinko Hyo: A strongly bullish configuration. The price is well above the Kumo (Cloud), the Tenkan-sen (9) is above the Kijun-sen (26), and the Cloud itself is bullish. This is a classic trend-following signal.
2. Key Indicator Signals:
📶 RSI (14): On the 4H chart, the RSI is holding firmly in bullish territory (above 50) and has not reached overbought (>70) levels, suggesting there is more room for the trend to run. 🟢
📏 Bollinger Bands (20,2): Price is riding the upper band, a sign of strong momentum. Any pullback would likely find support at the middle band (20 SMA ~146.80), which is rising.
⚖️ VWAP & Anchored VWAP: The price is trading well above the daily and weekly VWAP, confirming that the trend is strong and the average participant is long and in profit.
📈 Moving Averages: The key EMA's (50, 100, 200) are all bullishly aligned and acting as dynamic support. The 50 EMA on the 4H chart (~146.90) is a key level for bulls to defend.
3. Critical Support & Resistance:
🎯 Immediate Resistance: 148.00 (Psychological, Recent High)
🎯 Key Resistance: 149.20 - 149.50 (Gann Target, Previous Swing High)
🛡️ Immediate Support: 147.00 - 146.90 (Previous Resistance, 50 EMA)
🛡️ Strong Support: 146.20 - 146.00 (Kijun-sen, Key Fibonacci Level)
🛡️ Major Support: 145.00 (Top of Ichimoku Cloud)
⚡ Trading Strategies & Setups
A. Intraday Trading (5M - 1H Charts):
Strategy: Look for long opportunities on dips towards support. Use bullish candlestick patterns (Hammer, Bullish Engulfing) near the 147.00 or 146.90 levels for high-probability entries.
Long Entry (Ideal): ~147.10 - 146.95 | Stop Loss: 146.60 | Take Profit 1: 147.80 | Take Profit 2: 148.50
Breakout Long: On a decisive break and hold above 148.10, with a target of 148.80.
B. Swing Trading (4H - D Charts):
Strategy: The bullish structure and Ichimoku alignment favor continued upside. Any dip into support is a potential buying opportunity for a larger move.
Swing Long Entry: On a pullback to 146.90-146.70 (Buy the Dip) OR a daily close above 148.20 (Breakout Buy).
Stop Loss: Below 146.20 | Target 1: 149.20 | Target 2: 150.00+
Bearish Invalidation: A decisive break and close below 145.80 (into the cloud) would invalidate the immediate bullish bias and signal a deeper correction.
🌍 Market Context & Risk Factors
Interest Rate Divergence: This is the core driver. The pair is highly sensitive to the US Dollar (USD) strength and Bank of Japan (BoJ) policy. Hawkish Fed rhetoric vs. dovish BoJ stance is profoundly bullish for USDJPY. 👁️ Watch for any unexpected BoJ intervention hints.
Risk Sentiment: Traditionally a "risk-off" proxy, but currently driven more by yield differentials. Monitor global equity markets and geopolitical events for sudden flight-to-safety flows into the JPY.
✅ Key Takeaways:
The Trend is Your Friend! 🐂 All higher-timeframe signals point to a robust bullish trend.
Ichimoku is Bullish. The price above a bullish cloud is a strong trend-confirmation signal.
Buy the Dips. The strategy favors entering on short-term weakness toward support rather than chasing the breakout.
Mind the BoJ. The largest risk is verbal or physical intervention from the Bank of Japan, which can cause violent, sharp reversals.
For individuals seeking to enhance their trading abilities based on the analyses provided, I recommend exploring the mentoring program offered by Shunya Trade. (Website: shunya dot trade)
I would appreciate your feedback on this analysis, as it will serve as a valuable resource for future endeavors.
Sincerely,
Shunya.Trade
Website: shunya dot trade
⚠️Disclaimer: This post is intended solely for educational purposes and does not constitute investment advice, financial advice, or trading recommendations. The views expressed herein are derived from technical analysis and are shared for informational purposes only. The stock market inherently carries risks, including the potential for capital loss. Therefore, readers are strongly advised to exercise prudent judgment before making any investment decisions. We assume no liability for any actions taken based on this content. For personalized guidance, it is recommended to consult a certified financial advisor.


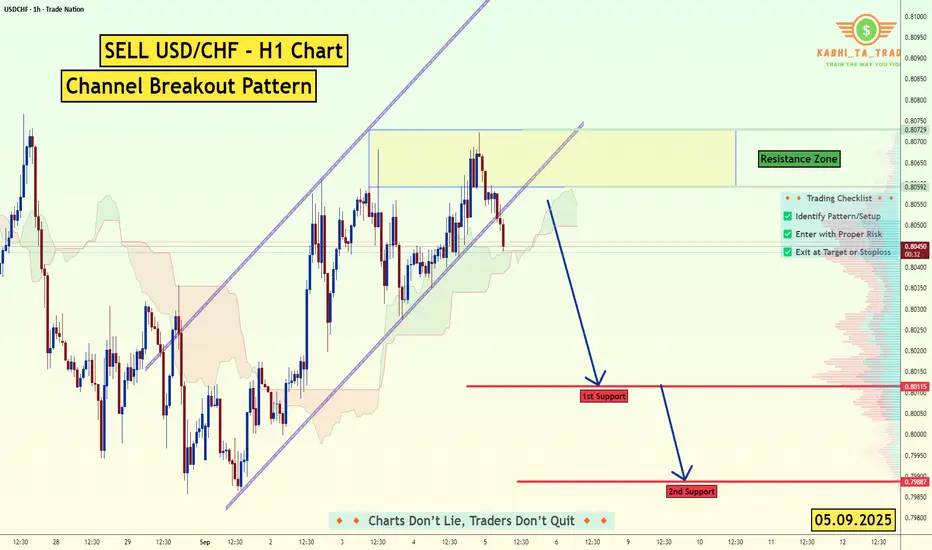
USD/CHF - H1 - Channel Breakout (NFP) (05.09.2025)The USD/CHF Pair on the H1 timeframe presents a Potential Selling Opportunity due to a recent Formation of a Channel Breakout Pattern. This suggests a shift in momentum towards the downside in the coming hours.
Possible Short Trade:
Entry: Consider Entering A Short Position around Trendline Of The Pattern.
Target Levels:
1st Support – 0.8011
2nd Support – 0.7988
🎁 Please hit the like button and
🎁 Leave a comment to support for My Post !
Your likes and comments are incredibly motivating and will encourage me to share more analysis with you.
Best Regards, KABHI_TA_TRADING
Thank you.
Disclosure: I am part of Trade Nation's Influencer program and receive a monthly fee for using their TradingView charts in my analysis.
USD/CAD - Bullish Pennant (04.09.2025)The USD/CAD pair on the M30 timeframe presents a Potential Buying Opportunity due to a recent Formation of a Bullish Pennant Breakout Pattern. This suggests a shift in momentum towards the upside and a higher likelihood of further advances in the coming hours.
Possible Long Trade:
Entry: Consider Entering A Long Position around Trendline Of The Pattern.
Target Levels:
1st Resistance – 1.3835
2nd Resistance – 1.3853
🎁 Please hit the like button and
🎁 Leave a comment to support for My Post !
Your likes and comments are incredibly motivating and will encourage me to share more analysis with you.
Best Regards, KABHI_TA_TRADING
Thank you.
Disclosure: I am part of Trade Nation's Influencer program and receive a monthly fee for using their TradingView charts in my analysis.

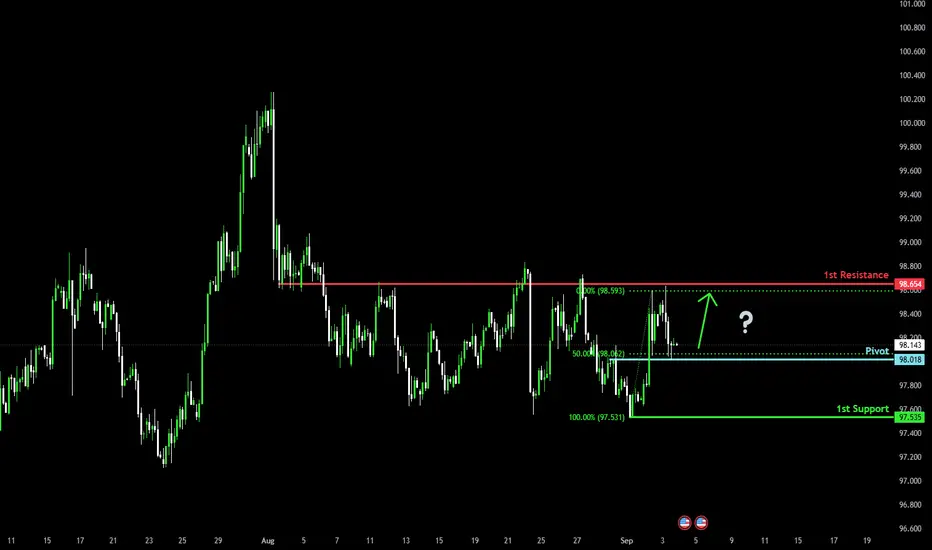
Bullish reversal at pullback support?The US Dollar Index (DXY) is falling towards the pivot, which acts as a pullback support that aligns with the 50% Fibonacci retracement and could bounce to the 1st resistance.
Pivot: 98.01
1st Support: 97.53
1st Resistance: 98.65
Risk Warning:
Trading Forex and CFDs carries a high level of risk to your capital and you should only trade with money you can afford to lose. Trading Forex and CFDs may not be suitable for all investors, so please ensure that you fully understand the risks involved and seek independent advice if necessary.
Disclaimer:
The above opinions given constitute general market commentary, and do not constitute the opinion or advice of IC Markets or any form of personal or investment advice.
Any opinions, news, research, analyses, prices, other information, or links to third-party sites contained on this website are provided on an "as-is" basis, are intended only to be informative, is not an advice nor a recommendation, nor research, or a record of our trading prices, or an offer of, or solicitation for a transaction in any financial instrument and thus should not be treated as such. The information provided does not involve any specific investment objectives, financial situation and needs of any specific person who may receive it. Please be aware, that past performance is not a reliable indicator of future performance and/or results. Past Performance or Forward-looking scenarios based upon the reasonable beliefs of the third-party provider are not a guarantee of future performance. Actual results may differ materially from those anticipated in forward-looking or past performance statements. IC Markets makes no representation or warranty and assumes no liability as to the accuracy or completeness of the information provided, nor any loss arising from any investment based on a recommendation, forecast or any information supplied by any third-party.
Waiting for a 'risk on' trade: AUD JPY fall to stall? Similar to Tuesday's ISM data, Wednesday's 'job openings data' has added fuel to the FED rate cut narrative, once again 'bad news is good news'. The VIX is below 17, the S&P is positive and US yields are 'testing' the 4.2 support level.
It is a narrative I envision could remain until NFP. I currently view any of the USD, JPY or CHF as a 'shortable'.
The initial USD weakness upon the 'jobs openings data release' looked a little stretched following the previous days reversal (I hope that makes sense?) and I'm currently waiting for 'nice support' on the USD charts before feeling confident in a trade.
The JPY initially has (what I would call) 'fake strength', USD JPY fell in correlation with falling yields. But if USD JPY and yields stall the fall, I'd be very happy with a JPY short, in fact, that's probably my preferred scenario.
Alternatively, if I feel confident in a trade and the CHF is weaker than both the USD and JPY, I'd be happy to go with a CHF short.
the next time I'll look at the charts will be either, a couple of hours after market close, or (more likely) early in the European session.

NZDUSD Channel Down targeting 0.57500.The NZDUSD pair has been trading within a Channel Down since the July 01 High and right now it is on its latest Bullish Leg.
The 1D RSI has already touched its Lower Highs trend-line, so that's an indication that the Bullish Leg might have topped already, given also the fact that the price has almost touched the 0.618 Fibonacci retracement level also, marginally above which all previous Lower Highs have been made.
As a result, we can expect the new Bearish Leg to decline by as much as -3.13% (according to the declining rate on every Bearish Leg), with our fair Target placed at 0.57500.
-------------------------------------------------------------------------------
** Please LIKE 👍, FOLLOW ✅, SHARE 🙌 and COMMENT ✍ if you enjoy this idea! Also share your ideas and charts in the comments section below! This is best way to keep it relevant, support us, keep the content here free and allow the idea to reach as many people as possible. **
-------------------------------------------------------------------------------
💸💸💸💸💸💸
👇 👇 👇 👇 👇 👇

GBPUSD SHORT TRADING PLANWhy:
1: Bearish Divergence
2: Weekly Divergence
3: DXY Going to Strong OANDA:GBPUSD
4: BOS
5: Short is Always Against The Trend
6: Good R:R

Dollar Index Surges:Bullish Momentum Sparks New OpportunitiesThe DXY Dollar Index Futures kicked off the new week with a strong bullish candle, signaling renewed upward momentum. According to the latest Commitment of Traders (COT) data, non-commercial traders are reducing their bearish bets, indicating a shift in market sentiment. Meanwhile, commercial traders are holding positions at levels not seen since 2021, suggesting confidence in the dollar’s strength. Retail traders, on the other hand, continue to push against the trend, maintaining bearish pressure. Recently, the price retested a key demand zone at the end of last week, which could present a strategic buy opportunity at a discounted level. What are your thoughts on this setup?
✅ Please share your thoughts about DXY in the comments section below and HIT LIKE if you appreciate my analysis. Don't forget to FOLLOW ME; you will help us a lot with this small contribution.

USD/CHF - Wedge Breakout (02.09.2025)The USD/CHF pair on the M30 timeframe presents a Potential Buying Opportunity due to a recent Formation of a Wedge Breakout Pattern. This suggests a shift in momentum towards the upside and a higher likelihood of further advances in the coming hours.
Possible Long Trade:
Entry: Consider Entering A Long Position around Trendline Of The Pattern.
Target Levels:
1st Resistance – 0.8048
2nd Resistance – 0.8067
🎁 Please hit the like button and
🎁 Leave a comment to support for My Post !
Your likes and comments are incredibly motivating and will encourage me to share more analysis with you.
Best Regards, KABHI_TA_TRADING
Thank you.
Disclosure: I am part of Trade Nation's Influencer program and receive a monthly fee for using their TradingView charts in my analysis.

DXY – Big Week Ahead, Watch These Zones-Dollar still stuck in a range. No need to guess, just watch the heavy levels:
-96.66 = bullish liquidity zone
-99.80 = bearish liquidity zone
-This week is packed with heavy news:
-NFP Friday – jobs report could shake markets hard
-Fed credibility under fire – politics trying to pressure the central bank
-Be careful with dollar pairs — market makers love stop hunts around news.
Best to stay patient → let price show which zone breaks first.

USDCAD BUYS🔎 Technical Breakdown
Breakout Structure
Price had been consolidating in a sideways range after a strong downtrend.
Recently, price broke out of the consolidation zone to the upside, showing buyers stepping in.
Current candles are forming higher lows → early trend reversal signals.
Support Zone (Demand Area)
Around 1.3730–1.3740, price rejected multiple times (wicks).
This shows strong demand, making it a safe stop-loss zone.
Candle Behavior
Recent bullish candles have longer bodies and smaller wicks → momentum favors buyers.
The last red candles got quickly engulfed by blue (bullish) candles → market bias shifted.
Risk-to-Reward (RRR)
SL around 1.3731 and TP1 at 1.3770 / TP2 1.3790 gives you nearly a 1:2 RRR, which is favorable.
Market Context
USDCAD often reacts strongly to oil price moves and USD strength. If USD is stable/strong, buying pressure supports this setup.
Also, this looks like a retracement entry after a sell-off, catching the early reversal
PS - STILL BEARISH IN DAILY TF

Bullish reversal?The US Dollar Index (DXY) has bounced off the pivot and could rise to the 1st resistance that aligns with the 50% Fibonacci retracement.
Pivot: 97.49
1st Resistance: 98.15
1st Support: 97.16
Risk Warning:
Trading Forex and CFDs carries a high level of risk to your capital and you should only trade with money you can afford to lose. Trading Forex and CFDs may not be suitable for all investors, so please ensure that you fully understand the risks involved and seek independent advice if necessary.
Disclaimer:
The above opinions given constitute general market commentary, and do not constitute the opinion or advice of IC Markets or any form of personal or investment advice.
Any opinions, news, research, analyses, prices, other information, or links to third-party sites contained on this website are provided on an "as-is" basis, are intended only to be informative, is not an advice nor a recommendation, nor research, or a record of our trading prices, or an offer of, or solicitation for a transaction in any financial instrument and thus should not be treated as such. The information provided does not involve any specific investment objectives, financial situation and needs of any specific person who may receive it. Please be aware, that past performance is not a reliable indicator of future performance and/or results. Past Performance or Forward-looking scenarios based upon the reasonable beliefs of the third-party provider are not a guarantee of future performance. Actual results may differ materially from those anticipated in forward-looking or past performance statements. IC Markets makes no representation or warranty and assumes no liability as to the accuracy or completeness of the information provided, nor any loss arising from any investment based on a recommendation, forecast or any information supplied by any third-party.

EURUSD Channel Up aiming at 1.20500The EURUSD pair has been trading within a Channel Up since the April 21 High and is on its new Bullish Leg since the Higher Low bottom on the 1D MA100 (green trend-line).
Having flipped the 1D MA50 (blue trend-line) into Support, the 1D RSI shows that we are on a symmetrical level similar to June 10 2025. We expect the Bullish Leg to reach the 1.5 Fibonacci extension (at least) just like the previous one did. Our Target is 1.20500.
-------------------------------------------------------------------------------
** Please LIKE 👍, FOLLOW ✅, SHARE 🙌 and COMMENT ✍ if you enjoy this idea! Also share your ideas and charts in the comments section below! This is best way to keep it relevant, support us, keep the content here free and allow the idea to reach as many people as possible. **
-------------------------------------------------------------------------------
💸💸💸💸💸💸
👇 👇 👇 👇 👇 👇

BULLISH Tone for EURUSDEURUSD attempts to sell are still met with a rejection from buyers and at the same time buy attempts are slowed by sellers. Despite Powell changing his Hawkish stance, the dollar is held back by good GDP and traders already anticipate NFP growth which means Hawkish for the dollar. So this week if THE 1.17200 resistance zone holds the pair will likely retest deeper. Therefore, any better than expected NFP will be bad for Powell dovish remarks. ISM is expected to be out tomorrow and I am looking forward to more buy positions if it comes out lower than expected. Buys momentum seem to still be there. If NFP confirms buy we are likely to reach 1.18900 zone.

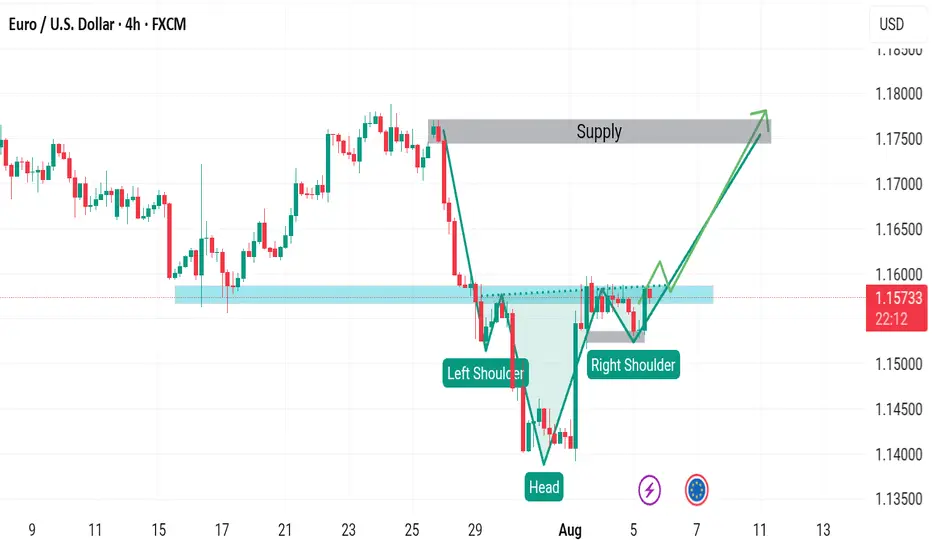
EURUSD BUY SETUPThe price will form a head and shoulders pattern because the candle in the second shoulder is very strong, which indicates that it will break the neck of the pattern. We also have a stronger bounce from below, so I expect an uptrend.
Forex Weekly Review: Fundamental analysis. USD to weaken? The week starting Monday 25 August ended where it began, with roughly an 85% likelihood of a September FED rate cut.
There was a lot of external noise in-between. But all the while, the currencies 'movement' remained fairly muted.
Given the reaction to chair Powell's speech the previous Friday, I was quite surprised by the USD strength on Monday.
Throughout the week, we did get a few 'events', namely Mr Trump 'firing' FED member cook, whilst simultaneously stirring the tariff pot. The firing of COOK is an interesting one as it brings into question the FED's independence and is a scenario that could rumble on for a while. We also got 'discouraging' forward guidance from NVIDEA. On another week, all of these narratives would have 'likely' spurred 'sour sentiment'. But any moves were muted, which I put down to many traders being away on 'summer breaks', the fact the VIX hovered around 15 all week (despite the negativity) backs up this theory.
In other news, we did a bit of 'action,' on Monday when political uncertainty in France weakened the EUR. And on Friday 'in line with expectations' US PCE data (eventually) weakened the USD. The theory being inflation is still benign enough for the FED to cut rates in September.
Finally, 'soft' CAD GDP data keeps a BOC September rate cut firmly on the table.
On a personal note, I only really perceived two opportunities all week, the EUR weakness on Monday (which I didn't trade) and the USD opportunity on Friday (GBP USD long). Although that was a tricky one because the dollar did initially strengthen on the headline. We only saw the 'true reaction' once the US market opened.
Throughout the week, I did find myself a little frustrated with the lack of my perceived opportunities over the last few weeks, I'm very intrigued to see if volume picks up once 'institutional traders' return to their desks.
I begin the new week with my 'risk on' bias in tact (particularly following weekend news of a supreme court tariff ruling). But I suspect the narrative surrounding the US jobs market could play a big role this week.
Results:
Trade 1: GBP USD +1.2
Total = +1.2%

US Dollar: A Bit Lower Before Moving Higher? Happy September!Welcome back to the Weekly Forex Forecast for the week of Sept. 1 - 5th.
In this video, we will analyze the following FX market: USD Dollar
The USD is more bearish than bullish. Yes. However, it is still in correction territory. That is to say, it could potentially move higher from current levels. It is in consolidation, ranging here for weeks. Sept may bring the volume to move price out of the summer range. Let's be prepared for it!
React and do not predict.
Enjoy!
May profits be upon you.
Leave any questions or comments in the comment section.
I appreciate any feedback from my viewers!
Disclaimer:
I do not provide personal investment advice and I am not a qualified licensed investment advisor.
All information found here, including any ideas, opinions, views, predictions, forecasts, commentaries, suggestions, expressed or implied herein, are for informational, entertainment or educational purposes only and should not be construed as personal investment advice. While the information provided is believed to be accurate, it may include errors or inaccuracies.
I will not and cannot be held liable for any actions you take as a result of anything you read here.
Conduct your own due diligence, or consult a licensed financial advisor or broker before making any and all investment decisions. Any investments, trades, speculations, or decisions made on the basis of any information found on this channel, expressed or implied herein, are committed at your own risk, financial or otherwise.

EURUSD: Support & Resistance Analysis For Next Week 🇪🇺🇺🇸
Here is my latest structure analysis and important supports & resistances
for EURUSD for next week.
Consider these structures for pullback/breakout trading.
❤️Please, support my work with like, thank you!❤️
I am part of Trade Nation's Influencer program and receive a monthly fee for using their TradingView charts in my analysis.

