US DOLLAR IS FILLING IN DISCOUNT
Traders are pricing in a possible Fed rate cut, while fresh U.S.–China trade tension adds uncertainty to global flows.
Technically, the dollar sits in its weekly mid-range, printing a 5th inside bar behind last Thursday’s move — the classic order-loading phase.
Price is rotating between a key bullish low weakness zone at 98.30 and a bearish order block near 99.00 — a compression range where liquidity builds before expansion.
Structure remains bearish-biased but currently in bull-back mode.
Buyers are pressing into bearish volume nodes, leaving no clean swing setups — just a 50/50 zone where patience pays.
Expect one side of this range to be cleared before the next directional leg.
Until then, we stay tactical — cross-market focused, scalping for bread and butter while the market sets up its next move.
DJ FXCM Index

USD/CAD - Wedge Breakout (15.10.2025)📊 Setup Overview: OANDA:USDCAD
USD/CAD has completed a rising wedge formation and broken below the support trendline — a classic sign of bearish reversal pressure. The price is now rejecting from the resistance zone, supported by weakening momentum within the Ichimoku cloud. This setup indicates a potential move toward the next major support levels.
📈 Trade Plan:
Bias: Bearish
Sell Entry Zone: Near 1.4040 – 1.4060 (resistance retest area)
1st Target: 1.3992 ✅
2nd Target: 1.3954 🎯
Invalidation: Above 1.4075 resistance zone
🧩 Supporting Factors:
Clear wedge breakout below trendline
Resistance zone rejection after sharp upward push
Price trading below Ichimoku cloud, signaling bearish control
Volume and structure aligning for a potential downside continuation
#USDCAD #Forex #PriceAction #TechnicalAnalysis #TradingView #ChartPattern #WedgeBreakout #ForexSignals #BearishSetup #FXTrading #Ichimoku #ChartsDontLie
⚠️ Disclaimer:
This analysis is for educational purposes only and not financial advice. Always conduct your own analysis and use proper risk management before taking any trade.
💬 Support the Analysis:
If you found this helpful — Like 👍, Comment 💬, and Follow ✅ for more high-quality chart setups and pattern-based analyses!

GBPUSD (15M) – Reaction Setup at Key ZonesFX:GBPUSD
📊 ⚖️
Structure | Trend | Key Reaction Zones
Price recently rebounded from the pink demand zone, confirming short-term bullish momentum.
Currently approaching a strong yellow supply zone (1.3360–1.3380), which has previously rejected price.
Trendline compression indicates a possible fakeout-to-reversal scenario forming.
Market Overview
GBPUSD is trading between a defined supply-demand structure. After recovering from the pink zone, bulls are driving price back into upper liquidity areas. A rejection from the yellow zone may trigger bearish continuation back toward the demand area, while a clean breakout above 1.3380 could fuel a stronger bullish run. Patience for confirmation is key — market could flip either way with London volatility.
Key Scenarios
✅ Bullish Case 🚀 → 🎯 Target 1: 1.3380 → 🎯 Target 2: 1.3400
❌ Bearish Case 📉 → 🎯 Target 1: 1.3310 → 🎯 Target 2: 1.3280 (Revisit to pink demand zone)
Current Levels to Watch
Resistance 🔴: 1.3360 – 1.3380
Support 🟢: 1.3280 – 1.3250
⚠️ Disclaimer: This analysis is for educational purposes only. Not financial advice

GBP/USD - Breakout Pattern (14.10.2025)The GBP/USD pair on the M30 timeframe presents a Potential Buying Opportunity due to a recent Formation of a Breakout Pattern.
This suggests a shift in momentum towards the upside and a higher likelihood of further advances in the coming hours.
Possible Long Trade:
Entry: Consider Entering A Long Position around Trendline Of The Pattern.
Target Levels:
1st Resistance – 1.3434
2nd Resistance – 1.3484
🎁 Please hit the like button and
🎁 Leave a comment to support for My Post !
Your likes and comments are incredibly motivating and will encourage me to share more analysis with you.
#GBPUSD #Forex #Trading #TechnicalAnalysis #PriceAction #ForexSignals #BreakoutTrading #Ichimoku #FXTrading #BullishSetup #TradingView
⚠️ Disclaimer:
This analysis is for educational purposes only and not financial advice. Always use proper risk management and conduct your own research before trading.
Best Regards, KABHI_TA_TRADING
Thank you.

Bullish bounce off?US Dollar Index (DXY) has bounced off the pivot which is an overlap support that lines up with the 38.2% Fibonacci retracement and could rise to the 1st resistance.
Pivot: 98.77
1st Support: 98.41
1st Resistance: 100.14
Disclaimer:
The above opinions given constitute general market commentary, and do not constitute the opinion or advice of IC Markets or any form of personal or investment advice.
Any opinions, news, research, analyses, prices, other information, or links to third-party sites contained on this website are provided on an "as-is" basis, are intended only to be informative, is not an advice nor a recommendation, nor research, or a record of our trading prices, or an offer of, or solicitation for a transaction in any financial instrument and thus should not be treated as such. The information provided does not involve any specific investment objectives, financial situation and needs of any specific person who may receive it. Please be aware, that past performance is not a reliable indicator of future performance and/or results. Past Performance or Forward-looking scenarios based upon the reasonable beliefs of the third-party provider are not a guarantee of future performance. Actual results may differ materially from those anticipated in forward-looking or past performance statements. IC Markets makes no representation or warranty and assumes no liability as to the accuracy or completeness of the information provided, nor any loss arising from any investment based on a recommendation, forecast or any information supplied by any third-party.

EURUSD More selling ahead after the 1D MA100 rejection.The EURUSD pair has been trading within a (red) Channel Down since the September 17 High, which is so far technically the Bearish Leg of the last valid Channel Up (since the July 01 High).
The break below its 1D MA100 (red trend-line) has the potential to start a new yearly Bear Cycle but on the short-term even, today's 1D MA100 re-test and rejection, validates the continuation of the Channel Down.
Given that the first Bearish Leg was -2.30%, we expect at least another such decline from the recent Lower High, which gives us a 1.15100 Target.
-------------------------------------------------------------------------------
** Please LIKE 👍, FOLLOW ✅, SHARE 🙌 and COMMENT ✍ if you enjoy this idea! Also share your ideas and charts in the comments section below! This is best way to keep it relevant, support us, keep the content here free and allow the idea to reach as many people as possible. **
-------------------------------------------------------------------------------
💸💸💸💸💸💸
👇 👇 👇 👇 👇 👇

DOLLAR INDEX (DXY) — TECHNICALS FIRST, FUNDAMENTALS SECOND
Technically, the key level this week is 99.197. If DXY manages a bullish close above it, we should see a weekly structure shift higher. That opens the door for 99.8 → 101.5 as internal algorithmic targets. This isn’t wishful thinking — this is how systems behave when liquidity regimes flip.
Under that lens, any rejections beneath 99.197 or weak closes around it remain valid short setups — but only after structure gives the nod. Don’t force trades ahead of confirmation.
In the background, the dollar is reacting to trade-war rhetoric and political shifts. Trump’s 100 % tariffs on Chinese imports raised volatility, but he later softened his tone, suggesting more cooperation than conflict. Its complet currency war.
Meanwhile, some analysts argue a bullish case for the dollar remains due to relative U.S. productivity strength and higher real yields.
These narratives give motive, but do not override price structure.
So from CORE5’s frame: structure leads, news lags. Let clean price confirmation in the 99.197 zone tell you whether to lean into long bias or respect the risk of failure. Eyes locked.
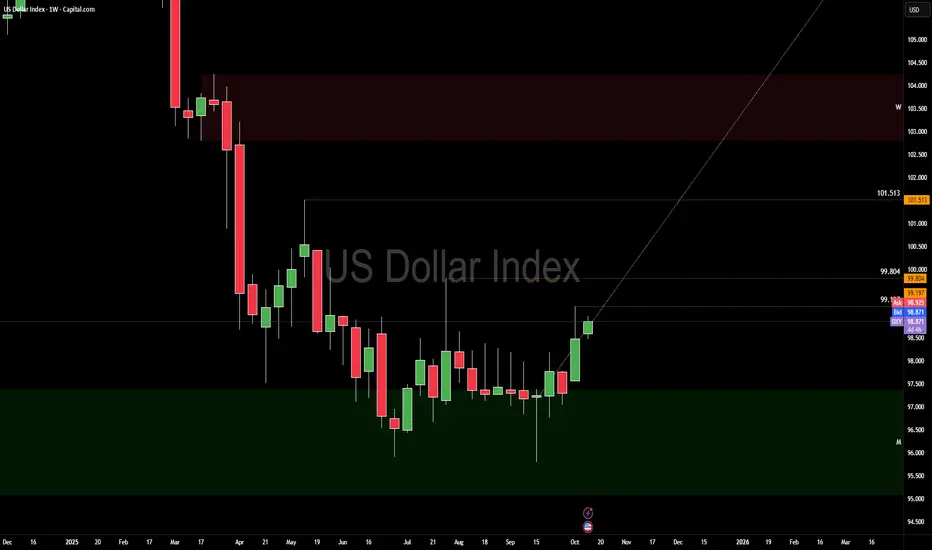
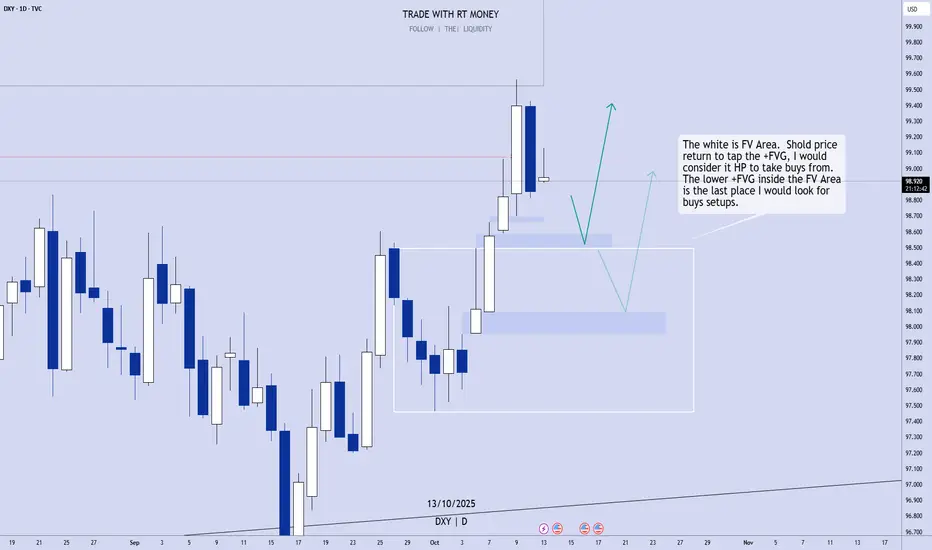
US Dollar: Still Bullish. Wait For Buy Setups!Friday's candle notwithstanding, the USD is strong, and still bullish. Taking sells into the bullish Fair Value Area is not a good option. Looking for buys at the _FVGs is!
Enjoy!
May profits be upon you.
Disclaimer:
I do not provide personal investment advice and I am not a qualified licensed investment advisor.
All information found here, including any ideas, opinions, views, predictions, forecasts, commentaries, suggestions, expressed or implied herein, are for informational, entertainment or educational purposes only and should not be construed as personal investment advice. While the information provided is believed to be accurate, it may include errors or inaccuracies.
I will not and cannot be held liable for any actions you take as a result of anything you read here.
Conduct your own due diligence, or consult a licensed financial advisor or broker before making any and all investment decisions. Any investments, trades, speculations, or decisions made on the basis of any information found on this channel, expressed or implied herein, are committed at your own risk, financial or otherwise.
XAUUSD 15M – Channeling Higher After Demand Reaction TVC:GOLD
Structure | Trend | Key Reaction Zones
Price tapped perfectly into the previous support zone, triggering a sharp bullish recovery.
The market is now moving inside a rising channel, showing healthy bullish correction.
Key focus remains around 4 020 – 4 058, where rejection or breakout will confirm the next phase.
Market Overview
Gold reacted sharply from the prior demand zone, forming a textbook W-reversal structure followed by clean channel continuation. Buyers are currently maintaining control as long as price holds above 3 985 – 3 962 levels. A breakout above 4 020 could extend momentum toward the rejection zone near 4 058, completing the full bullish leg.
Key Scenarios
✅ Bullish Case 🚀 → 🎯 Target 1 : 4 020 | 🎯 Target 2 : 4 058 | 🎯 Target 3 : 4 080
❌ Bearish Case 📉 → 🎯 Target 1 : 3 985 | 🎯 Target 2 : 3 926
Current Levels to Watch
Resistance 🔴 : 4 020 – 4 058
Support 🟢 : 3 962 – 3 926
⚠️ Disclaimer: For educational purposes only. Not financial advice.

Forex Weekly Review: fundamental analysis, + the week ahead Although the US government shutdown continues, there was still a lot of information to take in during the week starting Monday 6 October. Starting with the JPY 'opening gap', weekend news that new LDP leader TAKACHI is likely to induce policies positive for growth and Japanese stocks but negative for the JPY currency, when added to the previous Friday's dovish UEDA comments, it all equaled a very weak JPY, at least for the first few days of the week.
Next up, The RBNZ took the spotlight with a 0.5bp rate cut and dovish commentary. Considerably weakening the NZD. Similar to the JPY, it was a very big initial move and the problem with very big moves in a short space of time, is that (I personally) always feel that it's inevitable the chart will pull back fairly significantly. Therefore, if you're not at the chart to take advantage very soon after the news, it's often a case of waiting for a pullback before feeling confident in a trade.
The USD had bouts of strength throughout the week, I didn't note a particular catalyst. The FOMC minutes and a slue of FED speakers didn't really tell us anything new. Its likely USD JPY liquidity played a part in USD strength and I did read expectations the number of FED rate cuts next year are being re-evaluated, thanks to the strong US consumer. But, ultimately, we could do with the shutdown ending and data being reported to get a true reflection of where the USD stands.
Political uncertainty in France didn't have a lasting effect on the EUR, but it's something to keep an eye on.
As the week wore on, with the JPY being so weak, we did get the inevitable 'intervention chatter'. I did think I'd woken up in 2023 at one point, reading about "undesirable rapid Forex moves". I do think USD JPY needs to reach 155 / 160 before we'll see actual intervention. But if the 'intervention script' remains the same, any 'BOJ jawboning' 'should' eventually turn into a JPY short opportunity.
Finally, never too far from the spotlight, the US president treated us to some 'fresh tariff news', causing a 'risk off' end to the week. Similar to the JPY, if the 'tariff script' remains the same, any negative sentiment will likely be bought.
On a personal note, it was a week of two trades. An AUD NZD long following a pullback post RNBZ, which just made it to the profit target. On Friday, I ended the week with a CAD NZD short based on positive Canadian data, I was a little late to that trade and it coincided with the 'tariff news' which perhaps fortunately gave the chart an extra boost lower.
I begin the new week tentatively watching for a resumption of 'risk on sentiment' but it depends how affected sentiment is by the tariff news. I also continue to have a bias for 'interest rate speculation' trades.
Results:
Trade 1: AUD NZD +1.5
Trade 2: NZD CAD +1
Total = +2.5%

Bullish bounce?The US Dollar Index (DXY) is falling towards the pivot which is a pullback support and could bounce to the 1st resistance.
Pivot: 98.54
1st Suport: 96.63
1st Resistance: 101.95
Disclaimer:
The above opinions given constitute general market commentary, and do not constitute the opinion or advice of IC Markets or any form of personal or investment advice.
Any opinions, news, research, analyses, prices, other information, or links to third-party sites contained on this website are provided on an "as-is" basis, are intended only to be informative, is not an advice nor a recommendation, nor research, or a record of our trading prices, or an offer of, or solicitation for a transaction in any financial instrument and thus should not be treated as such. The information provided does not involve any specific investment objectives, financial situation and needs of any specific person who may receive it. Please be aware, that past performance is not a reliable indicator of future performance and/or results. Past Performance or Forward-looking scenarios based upon the reasonable beliefs of the third-party provider are not a guarantee of future performance. Actual results may differ materially from those anticipated in forward-looking or past performance statements. IC Markets makes no representation or warranty and assumes no liability as to the accuracy or completeness of the information provided, nor any loss arising from any investment based on a recommendation, forecast or any information supplied by any third-party.

Dollar at Max Deviation — Watching 99.197 CloselyThe dollar had another wild week, closing around 99.197 — right on the edge of major structure.
Most traders see strength, but when you zoom out, this move looks stretched.
Yields have started to cool off, which takes pressure off the dollar’s safe-haven run.
We still got smaller data releases like PMIs and Fed talks, but the big stuff like CPI is on hold until the U.S. shutdown clears.
Even the IMF warned about growing liquidity risks in global FX — meaning sudden spikes or fake outs can happen fast when markets get thin.
Technically, we’re in a bearish zone on the higher timeframe.
The last three months of liquidity targets are already taken, and the market’s now trading inside maximum deviation — a point where algorithms usually reset before any new trend forms.
That’s why 99.197 matters: it’s the last shelf before structure confirms the drop.
If price breaks and holds below that level early next week, momentum likely shifts bearish.
If it holds above, expect more sideways chop before a correction.
For now, it’s all about patience and tracking structure — not emotions.

mrmoney limited DXY position/swing trading ideaprice has reacted from our monthly support level giving us pin bar which created a double bottom on the weekly time frame looking for mor bullish move for the time being except price reacts on our resistance level

DXY Technical Analysis: Navigating Key Juncturre1. Big Picture & Market Context
The DXY is consolidating near a critical technical juncture. Geopolitical tensions and shifting rate expectations continue to be the primary drivers, creating volatility perfect for both intraday scalps and strategic swing positions.
2. Multi-Timeframe Technical Snapshot
Monthly/Weekly (Swing): Price is squeezed between the 50-week EMA (support ~98.20) and the 200-day SMA (resistance ~99.50). A decisive break either way will set the medium-term trend.
Daily (Swing & Intraday Bias): The chart shows a potential bearish flag formation following the recent decline. RSI (14) is neutral at 48, offering no extreme bias. The Ichimoku Cloud is thick above price, representing a significant resistance zone.
3. Elliott Wave & Harmonic Perspective
The pullback from the 100.50 high is being analyzed as either a Wave 4 (corrective) or the start of a larger bearish impulse. The key Harmonic zone for a potential bullish reversal (Bat pattern) lies between 98.30 - 98.50.
4. Key Support & Resistance Levels
Strong Resistance: 99.50 (200-day SMA & prior swing high)
Minor Resistance: 99.10 (Intraday)
Immediate Pivot: 98.85 (Current Price)
Strong Support: 98.50 (50-week EMA & 50% Fibonacci)
Critical Support: 98.20 (Breakdown Level)
5. Gann & Wyckoff Analysis
Gann Square of 9: Key levels align with 98.50 (support) and 99.20 (resistance). A close above 99.20 could trigger a run towards 99.80.
Wyckoff Cycle: Price action suggests we are in a possible Re-Distribution phase. A failure to hold 98.50 would signal a new Markdown phase, targeting 97.80.
6. Intraday Trading Strategy (5M-1H Charts)
Bullish Scenario (Long):
Entry: 98.55 - 98.65 (with bullish reversal candlestick confirmation)
Stop Loss: 98.35
Take Profit 1: 98.95
Take Profit 2: 99.15
Bearish Scenario (Short):
Entry: 99.05 - 99.10 (with bearish rejection confirmation)
Stop Loss: 99.30
Take Profit 1: 98.70
Take Profit 2: 98.50
7. Swing Trading Strategy (4H-Daily Charts)
Swing Long:
Entry Zone: 98.30 - 98.45 (Accumulation Zone)
Stop Loss: 97.90 (Daily Close)
Target 1: 99.20
Target 2: 99.80
Swing Short:
Entry Trigger: Daily close below 98.20
Stop Loss: 98.60
Target 1: 97.80
Target 2: 97.20
8. Indicator Cluster Consensus
Bollinger Bands: Price is trading in the upper band, indicating neutral momentum. A squeeze is forming, signaling a volatility expansion is due.
Anchored VWAP: (Anchored at last swing high) Price is below VWAP, indicating a Weak Bearish medium-term trend.
Moving Averages: The 50 EMA is about to cross below the 200 SMA on the 4H chart—a potential "Death Cross" warning for the week ahead.
Final Verdict: The DXY is at a make-or-break level. The bias is cautiously bearish below 99.10. The 98.50-98.20 zone is critical; a hold there could spark a relief rally, while a break opens the door for a significant swing down.
Disclaimer: This is technical analysis, not financial advice. Always manage your risk and use stop-loss orders.
BTCUSD update
Bitcoin just smashed through another order block and slipped straight into the discount zone — the area where opportunity often hides.
Price has flushed thru last oredblock and is now sitting deep in liquidity pockets Structure remains bearish in the short term, but momentum hints at a possible rotation higher if we see dollar to reclaim lower levels, lets see what next week brings to us
This has been an incredible trading week — multiple clean plays across majors and BTC delivering textbook structure. Now comes the patience phase. Let price confirm before adding exposure.
#BTC #Bitcoin #Crypto #SmartMoney #CORE5TRADECRAFT #MarketStructure #OrderFlow #TradingView

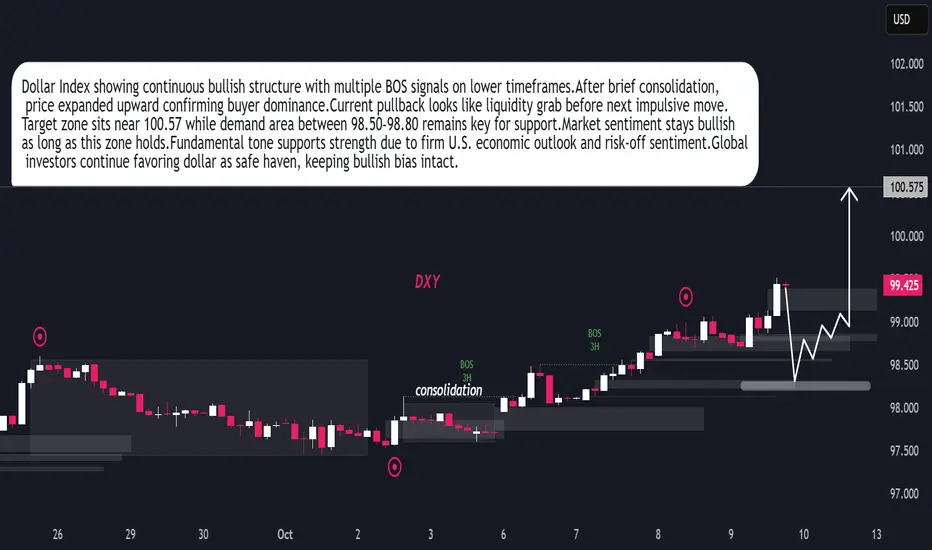
DXY Ready for Next Bullish Leg After Liquidity SweepDollar Index maintaining bullish structure after recent BOS on 3H timeframe.Market formed consolidation phase early October before expansion.Buyers showing control pushing price towards 100.57 objective.Current retracement indicates liquidity grab before next bullish impulse.Demand zone 98.50–98.80 remains key area for continuation.Technical sentiment stays positive as long as price holds above 98.50.Fundamentally, dollar supported by strong U.S. data and cautious global tone favoring safe-haven demand.Momentum outlook remains bullish with potential continuation toward 100.50+ zone.
Dollar Index (DXY): More Growth is Coming
Dollar Index keeps recovering.
The market managed to violate a significant resistance cluster yesterday
and closed above that.
It opens a potential for more rise.
The next historic structure is 100.0.
The index will aim at that next week.
❤️Please, support my work with like, thank you!❤️

US Dollar RECAPDollar Index (DXY) — Range Heat Building
You’ve got a weekly bearish range, with a key high at 99.8 and price now trading into bearish distribution around 99.0.
The dollar’s been front and center this week — while Washington argues over funding, it’s been doing real damage across cross-asset charts.
Price has been printing higher lows all week, grinding inside this bearish range.
That’s your profit-taking zone, not an add-on zone.
Stay patient. Let the range speak.

BTCUSD 4H – Preparing for a Breakout 🚀 BITSTAMP:BTCUSD
Market Overview
BTC is consolidating just under the key breakout zone, showing signs of strength after rebounding from demand. A clean breakout and retest above 123.9K could trigger a sharp move toward 125.6K, with extended targets at 126.2K–127.4K, where psychological resistance awaits.
Key Scenarios
✅ Bullish Case 🚀 → 🎯 Target 1: 125.6K | 🎯 Target 2: 126.2K | 🎯 Target 3: 127.4K
❌ Bearish Case 📉 → If BTC loses 122K support, expect correction back toward 120.8K.
Current Levels to Watch
Resistance 🔴: 123.9K – 125.6K
Support 🟢: 121.8K – 122.2K
⚠️ Disclaimer: This analysis is for educational purposes only. Not financial advice.

USDCAD 15M – Bearish Correction Setup 📉 OANDA:USDCAD
Structure | Trend | Key Reaction Zones
Price is respecting a descending trendline, rejecting multiple times near 1.3960–1.3965, showing exhaustion after minor pullbacks. The structure remains bearish with lower highs forming consistently.
Market Overview
USDCAD is currently consolidating below resistance, forming a corrective pattern within the descending structure. A clean break below 1.3949 would confirm downside momentum targeting the 1.3920–1.3930 demand zone, where strong buyers may appear for short-term reversals.
Key Scenarios
✅ Bearish Case 📉 → 🎯 Target 1: 1.3942 | 🎯 Target 2: 1.3920
❌ Bullish Case 🚀 → Break and close above 1.3965 could invalidate the setup and push toward 1.3971 resistance.
Current Levels to Watch
Resistance 🔴: 1.3965 – 1.3971
Support 🟢: 1.3942 – 1.3920
⚠️ Disclaimer: This analysis is for educational purposes only. Not financial advice.

XAGUSD 15M – Retracement Before Continuation TVC:SILVER
Structure | Trend | Key Reaction Zones
Silver remains in a clear bullish structure, recently facing a pullback from the 49.50 resistance zone after a strong rally from the 47.80 demand base.
Market Overview
The market printed a strong impulse leg upward followed by a healthy correction toward the 48.74–48.67 support zone, which also aligns with previous accumulation structure. As long as this zone holds, bullish continuation remains valid with buyers expected to regain control.
Key Scenarios
✅ Bullish Case 🚀 → 🎯 Target 1: 49.10 | 🎯 Target 2: 49.50 | 🎯 Target 3: 49.80
❌ Bearish Case 📉 → Break below 48.67 could extend correction toward 48.23 or 47.80.
Current Levels to Watch
Resistance 🔴: 49.10 – 49.50 – 49.80
Support 🟢: 48.74 – 48.23 – 47.80
⚠️ Disclaimer: This analysis is for educational purposes only. Not financial advice.

GBPUSD 4H – Preparing for a Strong Reversal Move FX:GBPUSD
Market Overview
GBPUSD has been consolidating near a demand zone after repeated rejections from the upper descending trendline. Bulls may soon step in once liquidity below 1.3340 is grabbed. A confirmed break of the descending structure could open a clean upside push toward 1.3499 and 1.3666.
Key Scenarios
✅ Bullish Case 🚀 → Reversal from 1.3340 → 🎯 Target 1.3499 → 🎯 Target 1.3666
❌ Bearish Case 📉 → Break below 1.3300 → 🎯 Downside Target 1.3250
Current Levels to Watch
Resistance 🔴: 1.3499 / 1.3666
Support 🟢: 1.3340 / 1.3300
⚠️ Disclaimer: This analysis is for educational purposes only. Not financial advice.

EURUSD 4H – Testing Strong Demand ZoneFX:EURUSD
Structure | Trend | Key Reaction Zones
Market remains in a downtrend channel, but price is now approaching a strong demand zone near 1.1570–1.1600.
The falling wedge structure suggests potential bullish reversal soon if liquidity sweeps the lows.
Mid-range resistance lies near 1.1658 and 1.1769.
Market Overview
EURUSD continues to respect its descending structure after rejection from the 1.1870 zone. However, buyers may soon step in as the pair nears a high-demand region, historically known for strong reversals. A clean reaction or double-bottom pattern could trigger a short-term bullish rally back toward mid-zone resistance.
Key Scenarios
✅ Bullish Case 🚀 → Rejection from 1.1570 zone → 🎯 Target 1.1658 → 🎯 Target 1.1769 → 🎯 Extended 1.1870
❌ Bearish Case 📉 → Break below 1.1570 → 🎯 Target 1.1500
Current Levels to Watch
Resistance 🔴: 1.1658 / 1.1769
Support 🟢: 1.1570 / 1.1500
⚠️ Disclaimer: This analysis is for educational purposes only. Not financial advice.
