BUY US Dollar! Sell xxxUSD Pairs! Buy USDxxx Pairs!This is the FOREX futures outlook for the Sept 30th.
In this video, we will analyze the following FX markets:
USD Index, EUR, GBP, AUD, NZD, CAD, CHF, and JPY.
Keep it simple! Buy USDxxx pairs. Sell xxxUSD pairs. Just wait for valid setups. Once price shows a valid change in the state of delivery on your entry TFs, enter.
Enjoy!
May profits be upon you.
Leave any questions or comments in the comment section.
I appreciate any feedback from my viewers!
Like and/or subscribe if you want more accurate analysis.
Thank you so much!
Disclaimer:
I do not provide personal investment advice and I am not a qualified licensed investment advisor.
All information found here, including any ideas, opinions, views, predictions, forecasts, commentaries, suggestions, expressed or implied herein, are for informational, entertainment or educational purposes only and should not be construed as personal investment advice. While the information provided is believed to be accurate, it may include errors or inaccuracies.
I will not and cannot be held liable for any actions you take as a result of anything you read here.
Conduct your own due diligence, or consult a licensed financial advisor or broker before making any and all investment decisions. Any investments, trades, speculations, or decisions made on the basis of any information found on this channel, expressed or implied herein, are committed at your own risk, financial or otherwise.
DJ FXCM Index

EURUSD 4H Channel Down targets 1.1600.The EURUSD pair is trading within a Channel Down on the 4H time-frame. As long as the 4H MA50 (blue trend-line) acts as Resistance, we expect the pattern to initiate its 3rd Bearish Leg, as at the same time, we have hit the 0.5 Fibonacci retracement level, which is where the previous Bearish Leg topped (Lower High).
If it repeats the recent Lower Low decline, we should see a 1.382 Fibonacci extension test. That more than covers our 1.16000 Target, which is where we believe contact can be made with the long-term Support of the 1D MA100 (red trend-line).
-------------------------------------------------------------------------------
** Please LIKE 👍, FOLLOW ✅, SHARE 🙌 and COMMENT ✍ if you enjoy this idea! Also share your ideas and charts in the comments section below! This is best way to keep it relevant, support us, keep the content here free and allow the idea to reach as many people as possible. **
-------------------------------------------------------------------------------
💸💸💸💸💸💸
👇 👇 👇 👇 👇 👇

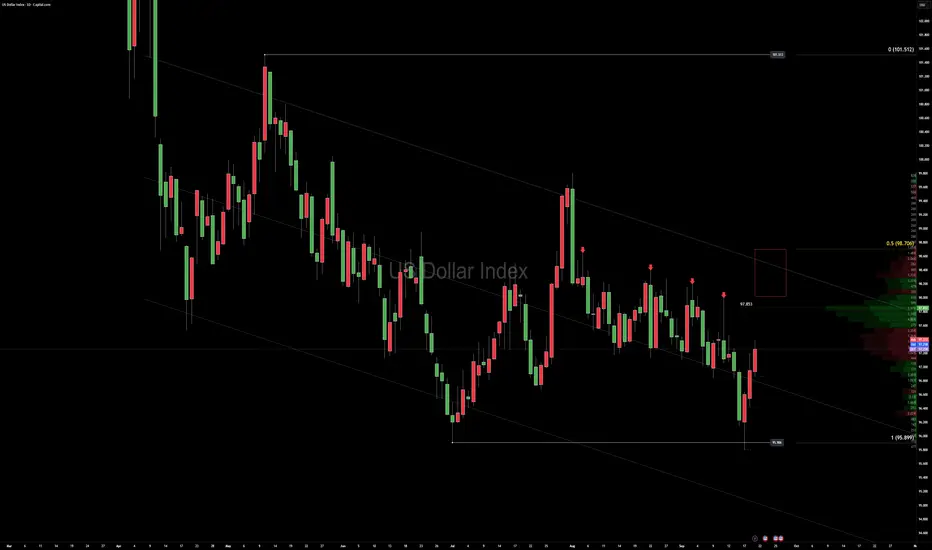
Bearish drop?The US Dollar Index (DXY) is reacting off the pivot which aligns with the 61.8% Fibonacci retracement and could drop to the 1st support which acts as a multi-swing low support.
Pivot: 98.63
1st Support: 96.61
1st Resistance: 100.19
Disclaimer:
The above opinions given constitute general market commentary, and do not constitute the opinion or advice of IC Markets or any form of personal or investment advice.
Any opinions, news, research, analyses, prices, other information, or links to third-party sites contained on this website are provided on an "as-is" basis, are intended only to be informative, is not an advice nor a recommendation, nor research, or a record of our trading prices, or an offer of, or solicitation for a transaction in any financial instrument and thus should not be treated as such. The information provided does not involve any specific investment objectives, financial situation and needs of any specific person who may receive it. Please be aware, that past performance is not a reliable indicator of future performance and/or results. Past Performance or Forward-looking scenarios based upon the reasonable beliefs of the third-party provider are not a guarantee of future performance. Actual results may differ materially from those anticipated in forward-looking or past performance statements. IC Markets makes no representation or warranty and assumes no liability as to the accuracy or completeness of the information provided, nor any loss arising from any investment based on a recommendation, forecast or any information supplied by any third-party.

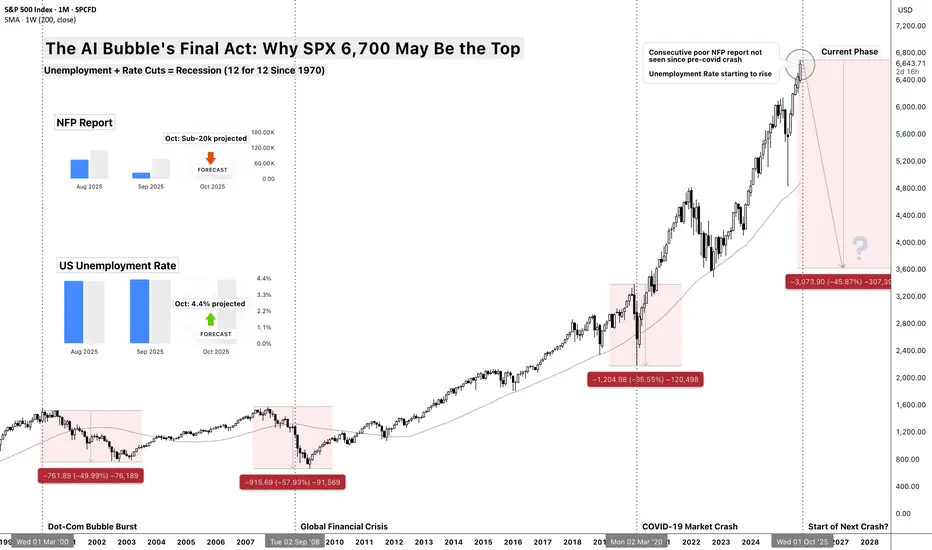
The AI Bubble's Final Act: Why $SP:SPX 6,700 May Be the TopThe AI Bubble's Final Act: Why SP:SPX 6,700 May Be the Top
Unemployment + Rate Cuts = Recession (12 for 12 Since 1970)
The Death Cross Pattern
There's a simple rule that's worked for 55 years: When the Fed cuts rates while unemployment is rising from cycle lows, recession follows within 12 months - every single time.
Think of it like a doctor taking your temperature while giving you painkillers. The medicine might make you feel better temporarily, but if the fever is rising, something serious is wrong underneath.
Current Status:
✅ Fed just cut rates ECONOMICS:USINTR (September 2025)
✅ Unemployment ECONOMICS:USUR rising from 3.4% cycle low
✅ TVC:SPX at all-time high ($6,700)
Historical Result: 12/12 times = recession + 35% average equity crash
The Precedent: Crisis Follows a Script
2000 Dot-Com Bubble:
Setup: TVC:SPX at ATH (1,550), ECONOMICS:USUR unemployment at 3.9%, ECONOMICS:USINTR Fed starts cutting
Crisis: Technology "revolution" story breaks down
Result: -49% crash over 2.5 years
Recovery: 7 years to new highs
2008 Financial Crisis:
Setup: CBOE:SPX at ATH (1,576), ECONOMICS:USUR unemployment at 4.4%, ECONOMICS:USINTR Fed starts cutting
Crisis: Housing/credit bubble bursts
Result: -57% crash over 1.5 years
Recovery: 5 years to new highs
2025 AI Bubble:
Setup: SPREADEX:SPX at ATH (6,700), ECONOMICS:USUR unemployment at 3.4%→4.2%, ECONOMICS:USINTR Fed starts cutting ✅
Crisis: AI productivity story meets employment reality
Projection: -35 to -45% crash over 18 months
Recovery: 3-5 years (faster due to tech infrastructure remaining)
The AI Employment Paradox
The Productivity Mirage
Wall Street celebrates AI boosting productivity, but here's the paradox:
productivity gains = job losses = reduced consumer spending = recession.
Think of it like a factory owner celebrating a new machine that replaces 100 workers. Great for margins, terrible for the local economy when those 100 families stop spending.
Jobs ECONOMICS:USNFP at Risk by Sector:
Customer Service: 2M jobs (chatbots replacing agents)
Software Development: 500K jobs (AI-assisted coding reducing teams)
Transportation: 3M jobs (autonomous vehicles accelerating)
Administrative: 4M jobs (AI handling routine tasks)
Content Creation: 1M jobs (AI writing, design, video)
Total Impact: 10+ million jobs facing displacement over next 2-3 years
Why This Time is Different?
Unlike previous automation waves that created new job categories, AI is targeting cognitive work directly. A factory worker could become a service worker, but what does a displaced knowledge worker become?
Valuation Extremes: 1929 Levels with 2025 Leverage
Current Valuation Metrics:
Shiller CAPE: 38+ (higher than 1929's 33)
Buffett Indicator: 195% (market cap/GDP, historical average 85%)
Price/Sales: 3.3x (vs 1.4x historical average)
Forward P/E: 23x (on optimistic AI earnings assumptions)
Valuations today exceed 1929 by most measures - but with far more leverage embedded in the system. If 1929 was a valuation bubble, 2025 is that bubble layered with derivatives, corporate debt, and passive flows.
The Leverage Layer:
Margin Debt: $1.023 trillion (record high)( as of July 2025, ycharts )
Corporate Debt/GDP: 85% (vs 45% in 2000)
Derivatives Exposure: $700 trillion notional ( as of June 2025, BIS semiannual data )
ETF/Passive Flows: $1.5 trillion annually (forced selling on reversals)
When liquidity stress hits, derivatives amplify shocks - notional exposure dwarfs underlying assets.
Think of today's market like a house of cards built on a trampoline. Even small bounces can bring the whole structure down.
Technical Breakdown: The Charts Don't Lie
Major Warning Signals:
Market breadth has deteriorated from 90% in Q4 2024 to ~60% today,
Defensives led earlier in the year,
TVC:VIX Volatility’s floor has shifted higher
Credit risk appetite (HYG/TLT) is stretched.
Together, these signal fragility beneath the index surface.
The Three-Stage Technical Collapse:
Stage 1 - The Warning (Now-Q4 2025):
Current Level: $6,700
Initial Support: $6,200 (previous resistance)
Character: Failed rallies, rotating leadership, "healthy correction" narrative
Target: 5,800-6,000 (-10 to -13%)
Stage 2 - The Cascade (Q4 2025-Q2 2026):
Breaking Point: Below 5,800 triggers algorithmic selling
Character: "Buy the dip" stops working, margin calls begin
Target: 4,800-5,200 (-25 to -30%)
Stage 3 - Capitulation (Q2-Q4 2026):
Final Flush: Panic selling, ETF redemptions
Character: "Markets will never recover" sentiment peaks
Target: 3,700-4,200 (-35 to -45%)
The Catalyst: When Reality Meets Hype
Q4 2025 Earnings Season - The Reckoning
Companies will face impossible questions:
"You spent $50B on AI - where's the revenue growth?"
"Productivity is up 20%, why are you laying off workers?"
"If AI is so transformative, why are margins declining?"
The Employment Data Domino Effect:
October/Nov NFP: First print above 250K unemployment claims
November Consumer Spending: Down 2%+ as job fears spread
December Holiday Sales: Weakest since 2008
January Layoff Announcements: Tech companies start "right-sizing"
Think of it like the moment in 2000 when investors finally asked: "How exactly does Pets.com make money?" or 2007 when they wondered: "What's actually in these mortgage bonds?"
Sector-by-Sector Breakdown
Technology (-50 to -70%)
AI hype stocks get destroyed first
Software companies face declining growth + competition
Semiconductor cycle turns negative
Biggest Losers: NVDA, MSFT, GOOGL
Consumer Discretionary (-40 to -55%)
Unemployment hits spending immediately
High-end retailers crushed first
Auto sales collapse with higher rates
Biggest Losers: TSLA, AMZN, NKE
Financials (-30 to -45%)
Credit losses surge as economy weakens
Interest margin compression
Commercial real estate exposure
Biggest Losers: Regional banks, non-bank lenders
Relative Outperformers (-15 to -25%)
Utilities, Healthcare, Consumer Staples
Companies with genuine AI cost savings
High-dividend yielders in low-rate environment
Key Dates and Catalysts
October 2025:
Jobs report (first warning?)
Q3 earnings disappointments
Fed meeting (dovish pivot?)
November 2025:
Election aftermath volatility
Black Friday sales data
Thanksgiving week low-volume crashes
December 2025:
Year-end tax selling
Institutional rebalancing
Holiday retail reality check
Q1 2026:
Layoff announcements surge
Earnings guidance slashed
Credit events begin
The Recovery Setup
Why This Crash Creates Opportunity:
Valuation Reset: P/E ratios back to historical norms
Weak Hands Flushed: Margin traders eliminated
Government Response: Fiscal + monetary stimulus
AI Infrastructure Remains: Real productivity gains continue post-bubble
Recovery Timeline:
Bottom: Q4 2026 around 3,700-4,200
Initial Rally: 30-50% bounce over 6 months
New Bull Market: Begins 2027 with stronger foundation
New Highs: 2029-2030 timeframe
Risk Management Rules
This Analysis Fails If:
Fed pivots to massive QE before crisis
Fiscal stimulus exceeds $2 trillion quickly
AI productivity gains offset job losses faster than projected
Geopolitical crisis overrides economic fundamentals
Probability Assessment:
60%: Correction to 4,800-5,500 range (25-30% decline)
25%: Major crash to 3,700-4,200 range (40-45% decline)
15%: Continued melt-up through 2026 (soft landing achieved)
Conclusion: The End of the Everything Era
At SPX 6,700 with unemployment rising and the Fed cutting rates, we're witnessing the final act of the 15-year "everything bubble."
The AI revolution is real, but like the Internet in 2000, revolutionary technology doesn't prevent financial gravity.
The bubble is ending exactly like the previous ones - with everyone believing "this time is different" right until it isn't.
Smart money is already rotating defensive. The question isn't whether a correction is coming - it's whether you'll be positioned for it.
EUR/USD Mid-Range HoldThis week’s price action has done its job
Two recent highs were taken out after the massive bull-back we mapped.
First targets on the cross pairs are still open, so I’m standing by into the weekend—no new adds here.
Right now EUR/USD sits mid-range.
Bias remains lower if the dollar keeps its bid, but I’ll let next week’s closes confirm.
Fresh Brookings research this week tied the dollar’s safe-haven status directly to U.S. trade policy.
Even with the tariff drama earlier this year, current rates (≈17–18%) stay well below the 26% “tipping point,” leaving the us dollar reserve role intact.
Fed Chair Powell’s recent remark that U.S. equities are “fairly highly valued” only adds to the cautious tone that supports the dollar.
Next Week’s Data to Watch
Tue – U.S. Consumer Confidence
Wed – Eurozone CPI Flash
Thu – U.S. Q2 GDP Final
Fri – U.S. PCE Price Index & Personal Income/Spending
Stronger U.S. numbers here would reinforce the dollar’s strength and keep pressure on EUR/USD.

Post PCE thoughts.PCE data in line with expectations, personal income and spending slightly up, all in all, when I saw the data, I felt it would potentially be good for the S&P and also the USD. But both the S&P and the USD are nonplussed.
The GBP has positive momentum, but it's not something I can hang my hat on while the rest of the currencies are behaving incoherently. All in all, i'd like to place a risk on trade, but I don't have conviction in the direction of the currencies over the next few hours.
Which means I'll close the book on a week of only trade, which stopped out. Mildly disappointing but I look forward to the new week.
Weekly Review and currency overview to follow. Wishing you a lovely weekend.
GBPUSD Long-term Top confirmed. Massive selling ahead.At the beginning of the year (January 10, see chart below), we issued a very strong buy signal on the GBPUSD pair, exactly at the bottom of the 3-year Channel Up, catching the most optimal buy entry and methodically hitting our 1.2950 Target:
This time we a confirmed Top for the same very pattern, which even though it may have widened the Higher Highs and Higher Lows (Megaphone), it did form last week Lower Highs, while also coming off a 1W MACD Bearish Cross, which at such high values, has been the sell signal on both previous Channel Tops.
Given that both Bearish Legs (red Channel Down sequences) reached at least their respective 0.786 Fibonacci levels, we are expecting the pair to hit 1.2450 within Q1 2026.
-------------------------------------------------------------------------------
** Please LIKE 👍, FOLLOW ✅, SHARE 🙌 and COMMENT ✍ if you enjoy this idea! Also share your ideas and charts in the comments section below! This is best way to keep it relevant, support us, keep the content here free and allow the idea to reach as many people as possible. **
-------------------------------------------------------------------------------
💸💸💸💸💸💸
👇 👇 👇 👇 👇 👇

USDJPY 4H TRADE IDEA FOR 26TH SEP,2025The USD against the JPY has broken a balanced area it has been in for the previous weeks before, as bulls generally start to take back control of the momentum and trend, but the
The question is, will the move last? As the overall trend is still bearish, this could be signaling a trend reversal based on what we see happening currently, but at this moment price is within a short range as it finds a base to continue long for the rest of the session today.
As usual, my calls or analysis are based on what we see, the current Bias, and from a probability standpoint, meaning that this projection may be or may not be validated, so tread carefully, and as usual, this is not financial advice, trade responsibly

US Dollar: Hold Off On Selling The USD! Higher Prices Ahead?Welcome back to the Weekly Forex Forecast for the week of Sept 22 - 26th.
In this video, we will analyze the following FX market: USD Dollar
The USD recovered last Friday after the FED cut the rate .25 basis points. The USD was also supported by higher T-note yields.
What's next?
Although price swept the Swing Low last week, it recovered, trading back up into the consolidation. There is a bullish tone to this movement, and a manipulative one as well. The sell side LQ was taken, followed by a quick recovery.
The highlighted bullish FVG indicates bullish order flow.
There is a potential iFVG just above the +FVG. Monitor it to see if price will respect it as support. Should it hold, look to long the USD.
Wait and react. Do not predict.
Enjoy!
May profits be upon you.
Leave any questions or comments in the comment section.
I appreciate any feedback from my viewers!
Disclaimer:
I do not provide personal investment advice and I am not a qualified licensed investment advisor.
All information found here, including any ideas, opinions, views, predictions, forecasts, commentaries, suggestions, expressed or implied herein, are for informational, entertainment or educational purposes only and should not be construed as personal investment advice. While the information provided is believed to be accurate, it may include errors or inaccuracies.
I will not and cannot be held liable for any actions you take as a result of anything you read here.
Conduct your own due diligence, or consult a licensed financial advisor or broker before making any and all investment decisions. Any investments, trades, speculations, or decisions made on the basis of any information found on this channel, expressed or implied herein, are committed at your own risk, financial or otherwise.

USDJPY Massive bullish break-out above the 1W MA50.The USDJPY pair has been trading within a 3-year Channel Up and more recently since the April 21 2025 Low, within a shorter term Channel Up (dotted trend-lines).
This pattern made a Higher Low last week and on this one it broke above its 1W MA50 (blue trend-line) for the first time since July 28. If it closes the candle above it, it will be the first time to do so since January 27 2025, thus a massive buy signal.
Based on the Bullish Legs of the dotted Channel Up (+6.00%) we expect the current rise to test the Lower Highs trend-line at 154.000.
-------------------------------------------------------------------------------
** Please LIKE 👍, FOLLOW ✅, SHARE 🙌 and COMMENT ✍ if you enjoy this idea! Also share your ideas and charts in the comments section below! This is best way to keep it relevant, support us, keep the content here free and allow the idea to reach as many people as possible. **
-------------------------------------------------------------------------------
💸💸💸💸💸💸
👇 👇 👇 👇 👇 👇

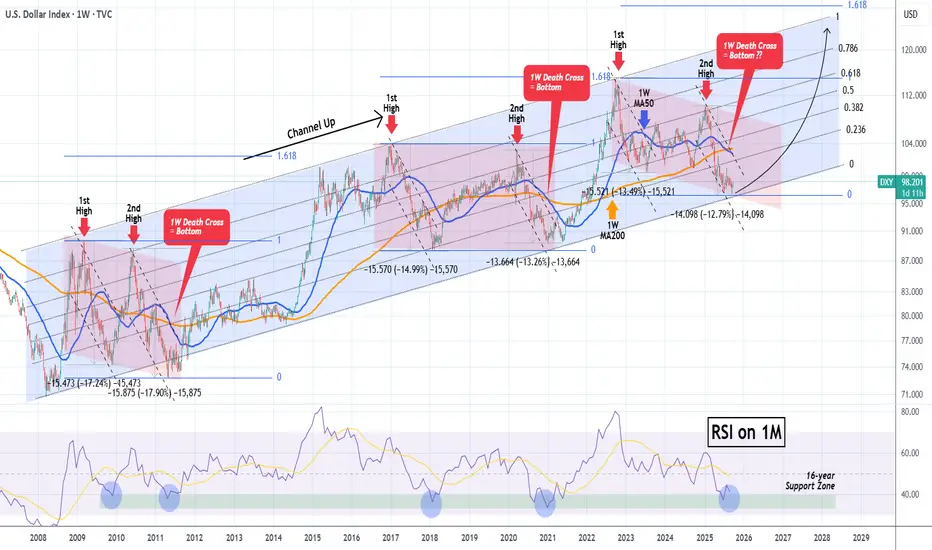
DXY Is it finally time for the Dollar to shine?The U.S. Dollar index (DXY) has been trading within a Channel Up since the March 2008 bottom during the U.S. Housing Crisis. This pattern has been showing incredible symmetry, having clear correction phases (red Channels) followed by bullish phases, where the price rallied to the 1.618 Fibonacci extension.
Right now the price has almost hit the bottom of this multi-year Channel Up, while at the same time making a new (2nd) bottom for the 2nd Bearish Leg of the (red) correction phase.
With the 1M RSI having already touched its 16-year Support Zone, which has provided the most optimal Buy Signals throughout this pattern, we expect the Dollar Index to start rising aggressively in the long-term, targeting at lest 120.000 on its way to the 1.618 Fib ext.
-------------------------------------------------------------------------------
** Please LIKE 👍, FOLLOW ✅, SHARE 🙌 and COMMENT ✍ if you enjoy this idea! Also share your ideas and charts in the comments section below! This is best way to keep it relevant, support us, keep the content here free and allow the idea to reach as many people as possible. **
-------------------------------------------------------------------------------
💸💸💸💸💸💸
👇 👇 👇 👇 👇 👇
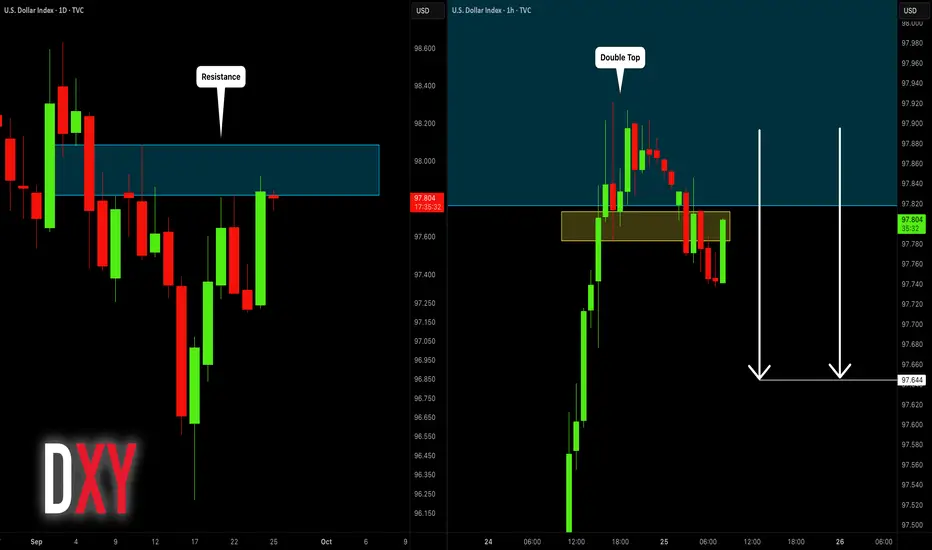
DOLLAR INDEX (DXY): Overbought Market & Pullback
Dollar Index is testing a major daily resistance cluster now.
With a high probability, the market will retrace from that.
A double top pattern that was formed on an hourly time frame
indicates a clear overbought state.
The index may drop to 97.65
❤️Please, support my work with like, thank you!❤️
I am part of Trade Nation's Influencer program and receive a monthly fee for using their TradingView charts in my analysis.
USD/CAD Head and Shoulders patternA clear Head and Shoulders formation has developed. Left Shoulder (~1.3850), Head (~1.3950), and Right Shoulder (~1.3850). Price is now retesting the neckline zone around 1.3730–1.3750.
Normally this pattern formed when it's end of a trend.
So its safer to wait until the break of the support and establishing below the Resistance to enter.

USD/JPY - Bank of Japan Holds Rates, Inflation RisingFX:USDJPY #USDJPY #Forex #Trading #FXAnalysis #TechnicalAnalysis #PriceAction #BankOfJapan #ForexTrader #DayTrading #SwingTrading
The Bank of Japan kept interest rates unchanged while raising its inflation forecast. This signals caution but also optimism that cooperation with the U.S. could help stabilize Japan’s economy.
On the chart, we see key demand zones (red) holding as potential support, with upside targets toward 148.700 – 149.200 (green key zones). If price sustains above the demand area, bullish momentum could push USD/JPY higher into these resistance levels.
Traders should watch for confirmation signals around support before entering long positions.
👍 Support with a like & drop your thoughts in the comments!
⚠️ Disclaimer: This analysis is for educational purposes only and should not be considered financial advice. Always do your own research before making trading decisions.

USD/JPY - Bullish Channel, Next Targeting 148.95 (23.09.2025)#USDJPY #Forex #Trading #TechnicalAnalysis
USD/JPY is trading within a Bullish Channel Pattern on the 30M chart, holding above the rising trendline support. The pair is bouncing from the support zone (147.50 – 147.70), signaling potential upside continuation.
🔹 Market Structure:
Bullish channel intact with higher highs & higher lows.
Price rejected the support zone and trendline.
Momentum suggests buyers could retest upper channel resistance.
🔹 Key Levels:
Support Zone: 147.50 – 147.70
1st Resistance: 148.58
2nd Resistance: 148.95
📈 Trading Idea:
As long as USD/JPY stays above the support zone, bulls may drive price higher toward 148.58 → 148.95.
⚠️ Invalidation:
A break below 147.50 would weaken the bullish outlook.
“Discipline + Patience = Consistency 🔑”

US DOLLAR LIQUIDITY GAMES MAPThe U.S. Dollar is testing traders resolve.
Price action keeps pressing higher, and a daily close above 97.394 would confirm a classic “fractal low” — the kind of structural pivot that lures late buyers before the real move unfolds.
3 Key Insights
Macro Calendar – Stay alert:
Thu – Final Q2 GDP, Weekly Jobless Claims, Durable Goods Orders.
Fri – Core PCE Price Index, Personal Income & Spending, University of Michigan Sentiment (final).
These are the week’s steering currents for USD flows.
A daily close above 97.394 is the key trigger to confirm a fresh leg higher.
• EUR/USD short bias remains valid while DXY stays bid, but expect intraday volatility around data releases.

DXY – Post-Fed Cut: What’s Next for the Dollar?The Fed has cut rates — but the dollar didn’t flinch. No major reaction, which suggests the move was priced in.
I currently see two possible scenarios unfolding on DXY:
Scenario 1: Triangle Completed – More Downside Ahead
If we’ve finished a triangle correction, a break below 96.20 could confirm the move and open up downside toward $95–$92.
Chart:
Scenario 2: Ending Diagonal in Wave 5
Alternatively, the recent low may mark the end of a 5th wave diagonal, completing Wave 3 of the broader decline. If so, we could see choppy corrective action before any larger moves.
Chart:
Key level to watch: Break below $96.20
If price closes above $100.25 I will review the analysis as this may indicate the downward trend is complete.

USDX: demand zone holds but downside pressure remainsThe US dollar index remains under pressure, trading within a descending channel. The recent bounce from the support zone around 96.30–96.90 stalled at the EMAs and the supply zone near 98.30–98.60, where sellers reappeared. On the 4H chart, price has failed to sustain above 97.80, keeping the bearish scenario in play.
It is also important to note that the index is trading below the 200 EMA, reinforcing the bearish bias and signaling that sustainable recovery is less likely without strong fundamental catalysts.
If 96.90 breaks, the next downside target is 96.30, followed by 95.40. Stronger bearish momentum could even push the index toward 94.00, signaling further dollar weakness. For now, 96.30 acts as the key support barrier.
From a fundamental perspective, the dollar index remains weighed down by expectations of a dovish Fed and lower yields. Any hawkish surprise from Fed officials could lift price back toward 98.50, but the structure still favors bearish continuation.
This is exactly the kind of situation where market expectations diverge from reality, and the longer it lasts the more it feels like a trend reversal is near. But as always, emotions must be set aside — we wait for clear signals, not illusions.

BTCUSD POSSIBLE BUY SETUP💡 BTCUSD 4H Outlook – Recovery Setup in Play
After a strong sell-off that created a Change of Character (ChoCH), price has now tapped into the demand zone around 112,000 – 113,000. From here, I’m watching for signs of accumulation and potential continuation back to the upside.
🔼 Bullish Scenario
If buyers hold this demand, we could see a rally toward the first supply zone near 116,000.
A clean break above that would open the way for a push toward the major resistance at 118,000 – 119,000.
🔽 Bearish Scenario
Failure to hold 112,000 support could trigger further downside. Next liquidity sweep would likely come below 111,500 and possibly deeper.
⚔️ Key Levels to Watch
Support: 112,000 | 111,500
Resistance: 116,000 | 118,000 – 119,000
📊 Current structure suggests bulls may try to defend this zone, giving a possible recovery leg.
✅ If this analysis helps you, hit the boost and follow for more updates on BTC and other pairs.
💼 For traders looking for account management services (personal or funded accounts), reach out — I can help with risk-managed growth and consistent strategies.

Bearish drop off?The US Dollar Index (DXY) has rejected off the pivot and could drop to the 1st support.
Pivot: 97.85
1st Support: 96.61
1st Resistance: 98.70
Disclaimer:
The above opinions given constitute general market commentary, and do not constitute the opinion or advice of IC Markets or any form of personal or investment advice.
Any opinions, news, research, analyses, prices, other information, or links to third-party sites contained on this website are provided on an "as-is" basis, are intended only to be informative, is not an advice nor a recommendation, nor research, or a record of our trading prices, or an offer of, or solicitation for a transaction in any financial instrument and thus should not be treated as such. The information provided does not involve any specific investment objectives, financial situation and needs of any specific person who may receive it. Please be aware, that past performance is not a reliable indicator of future performance and/or results. Past Performance or Forward-looking scenarios based upon the reasonable beliefs of the third-party provider are not a guarantee of future performance. Actual results may differ materially from those anticipated in forward-looking or past performance statements. IC Markets makes no representation or warranty and assumes no liability as to the accuracy or completeness of the information provided, nor any loss arising from any investment based on a recommendation, forecast or any information supplied by any third-party.

EURUSD Buy Signal triggered on the 4H MA100.The EURUSD pair has been trading within a Channel Up for almost 2 months and today it is rising after hitting the 4H MA100 (green trend-line). This is technically the bottom of the pattern and potentially the start of its new Bullish Leg.
The typical rallies within this pattern have ranged between +1.41% and +1.51%, so expecting a minimum of +1.41% is valid. Our Target is 1.18900.
On a side-note, the 4H RSI has also rebounded on its own Support Zone, strengthening the current Buy Signal.
-------------------------------------------------------------------------------
** Please LIKE 👍, FOLLOW ✅, SHARE 🙌 and COMMENT ✍ if you enjoy this idea! Also share your ideas and charts in the comments section below! This is best way to keep it relevant, support us, keep the content here free and allow the idea to reach as many people as possible. **
-------------------------------------------------------------------------------
💸💸💸💸💸💸
👇 👇 👇 👇 👇 👇

Sellers in Control AfterEUR/USD hit a major resistance zone between 1.18500 – 1.19000, which aligns with the Monthly Volume Profile resistance area. Price has rejected this zone with lower highs and decreasing volume — a classic bearish signal.
This setup suggests that a Wave 4 correction may be underway, with potential to target 1.15500 and even 1.14500 if selling pressure accelerates.
Disclaimer: This analysis is for educational purposes only and does not constitute financial advice. Always conduct your own research and manage your risk appropriately.

US DOLLAR War Map stays simple right nowThe dollar’s been sliding for months, but we finally saw the range lows taken out after the FOMC spike, and that sets up the next move.
Here’s how I’m reading it:
Rotation lower is still the logical path unless politics or surprise news change the game.
On the DXY chart, I’m watching for a heavy-volume node to act as a target for a short-term pullback higher.
For cross-pairs, that means I’ll look for short setups while using the recent bullish dollar lows as day-to-day reference points.
Key level to watch: around 98.7, where heavy bearish order-flow has been building.
If the market keeps moving, it’s a straightforward trade plan: stay positive, take intraday signals, and let the bigger down-cycle play out.