Dollar Index Bearish Trend Continuation From Marked ResistancesH1 - Bearish Trend in play
Two Solid Resistance Levels
Trend continuation very likely after pullback.
Usdollarindexforecast

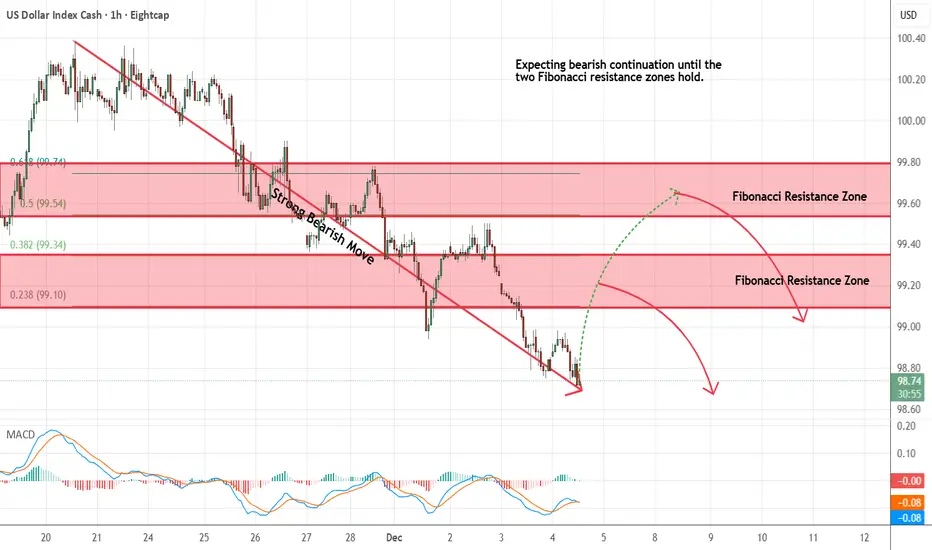
US Dollar Index - Looking To Sell Pullbacks In The Short TermH1 - Strong bearish move.
No opposite signs.
Expecting bearish continuation until the two Fibonacci resistance zones hold.
If you enjoy this idea, don’t forget to LIKE 👍, FOLLOW ✅, SHARE 🙌, and COMMENT ✍! Drop your thoughts and charts below to keep the discussion going. Your support helps keep this content free and reach more people! 🚀
-------------------------------------------------------------------------------------------------------------------
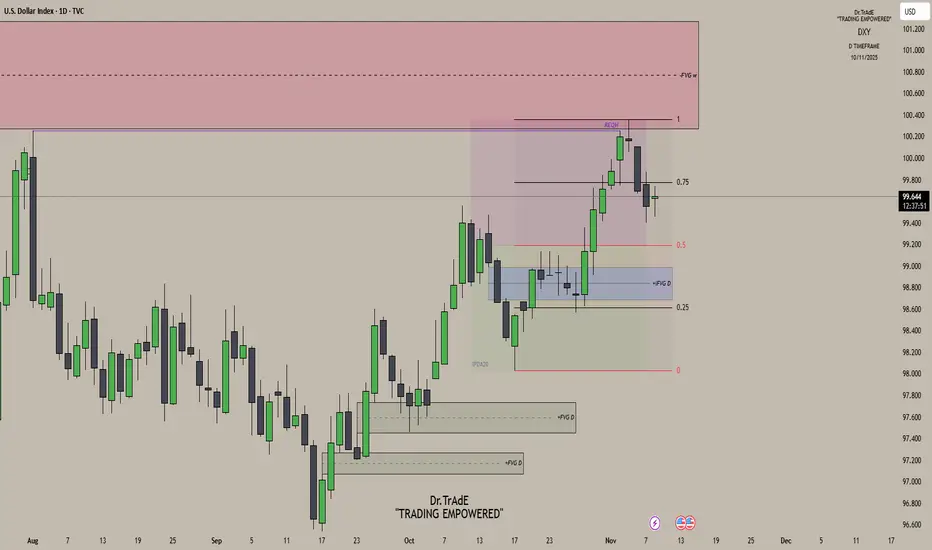
DXY Daily AnalysisLast Week’s Review:
Monday: Bullish delivery as price continued higher.
Tuesday: Price maintained bullish momentum but failed to take out the previous high, leaving equal highs — liquidity resting above.
Wednesday: That liquidity was swept as price reached into the weekly fair value gap, completing delivery to the premium array and initiating bearish distribution.
Current Outlook:
On the daily chart, we’re still trading deep inside premium, and price is showing clear signs of exhaustion after that delivery into the weekly FVG. With bearish distribution now in play, my bias remains bearish. Any short-term push back into the 0.75 quadrant, I’ll treat as a retracement — a chance for price to reprice some lower-timeframe inefficiencies before the next leg lower. On the 4H chart, I’ll be watching for price to trade back into short-term FVGs or inefficiencies that align with this overall bearish narrative.
US Dollar: Hold Off On Selling The USD! Higher Prices Ahead?Welcome back to the Weekly Forex Forecast for the week of Sept 22 - 26th.
In this video, we will analyze the following FX market: USD Dollar
The USD recovered last Friday after the FED cut the rate .25 basis points. The USD was also supported by higher T-note yields.
What's next?
Although price swept the Swing Low last week, it recovered, trading back up into the consolidation. There is a bullish tone to this movement, and a manipulative one as well. The sell side LQ was taken, followed by a quick recovery.
The highlighted bullish FVG indicates bullish order flow.
There is a potential iFVG just above the +FVG. Monitor it to see if price will respect it as support. Should it hold, look to long the USD.
Wait and react. Do not predict.
Enjoy!
May profits be upon you.
Leave any questions or comments in the comment section.
I appreciate any feedback from my viewers!
Disclaimer:
I do not provide personal investment advice and I am not a qualified licensed investment advisor.
All information found here, including any ideas, opinions, views, predictions, forecasts, commentaries, suggestions, expressed or implied herein, are for informational, entertainment or educational purposes only and should not be construed as personal investment advice. While the information provided is believed to be accurate, it may include errors or inaccuracies.
I will not and cannot be held liable for any actions you take as a result of anything you read here.
Conduct your own due diligence, or consult a licensed financial advisor or broker before making any and all investment decisions. Any investments, trades, speculations, or decisions made on the basis of any information found on this channel, expressed or implied herein, are committed at your own risk, financial or otherwise.

US Dollar Index - Looking To Sell Pullbacks In The Short TermM15 - Strong bearish move.
No opposite signs.
Currently it looks like a pullback is happening.
Expecting bearish continuation until the two Fibonacci resistance zones hold.
If you enjoy this idea, don’t forget to LIKE 👍, FOLLOW ✅, SHARE 🙌, and COMMENT ✍! Drop your thoughts and charts below to keep the discussion going. Your support helps keep this content free and reach more people! 🚀
-------------------------------------------------------------------------------------------------------------------

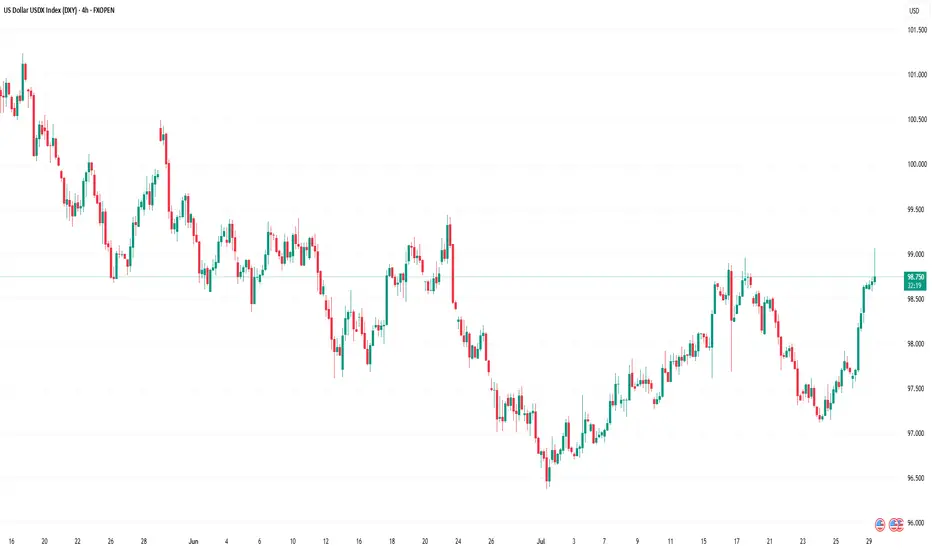
US Dollar Index (DXY) Reaches One-Month HighUS Dollar Index (DXY) Reaches One-Month High
The US Dollar Index (DXY) has risen to its highest level since early July. According to media reports, the bullish sentiment in the market is driven by the following factors:
→ Optimism around US trade agreements. A new trade deal with the EU — which includes a 15% tariff on European goods — is being perceived by the market as favourable for the United States.
→ Confidence in the resilience of the US economy. Strong Q2 corporate earnings have acted as an additional bullish catalyst. Investors may have started covering short positions against the dollar, viewing concerns over a US slowdown as overstated.
→ Expectations that the Federal Reserve will keep interest rates on hold.
From a technical standpoint, today’s DXY chart reflects strengthening bullish momentum.
Technical Analysis of the DXY Chart
Two U-shaped formations (A and B) that developed over the summer have created a bullish сup and рandle pattern — a formation that suggests waning bearish pressure, as evidenced by the shallower second dip.
This setup points to the potential for a bullish breakout above the trendline (marked in red) that has defined the downward movement in the DXY throughout the first half of 2025.
As previously analysed, there are signs that the dollar index may have found a base following a period of decline. This could indicate a shift in market sentiment and the possible end of the recent bearish phase.
This article represents the opinion of the Companies operating under the FXOpen brand only. It is not to be construed as an offer, solicitation, or recommendation with respect to products and services provided by the Companies operating under the FXOpen brand, nor is it to be considered financial advice.
A Closer Look at the Role and Recent Volatility of the (DXY)A Closer Look at the Role and Recent Volatility of the US Dollar Index (DXY)
We don’t even need to say that the US Dollar Index (DXY) is one of the most influential benchmarks in global currency markets. The index, which measures the value of the US dollar against a basket of six major currencies, experiences heightened volatility and presents potential opportunities.
Understanding the DXY: A Macro Lens on the Dollar
The DXY tracks the relative strength of the US dollar versus a weighted currency basket including the euro, Japanese yen, British pound, Canadian dollar, Swedish krona, and Swiss franc. Although the euro comprises nearly 58% of the index, the DXY reflects broad USD strength or weakness across global markets, not just against a single currency.
Traders and analysts use the DXY as a key macro indicator—to track policy divergence between central banks, to hedge USD exposure, and to assess broader market sentiment. Rising DXY levels often signal tightening US policy or global risk aversion, while declines may reflect weakening growth expectations, dovish Fed policy, or geopolitical stress. In volatile environments like 2025, the DXY serves as a real-time barometer of global confidence in the US economy and dollar-based assets.
Recent Price Swings: Tariffs & Policy Uncertainty Shake the Dollar
Since April, the US Dollar Index has faced one of its most volatile stretches in years, driven by a convergence of Federal Reserve policy uncertainty and new trade tariffs announced by President Trump.
April: “Liberation Day” Tariffs Trigger Market Shock
On 2 April, the announcement of sweeping “Liberation Day” tariffs—10% on nearly all imports, with higher duties on selected countries—jolted currency markets. The DXY fell over 2% in a single day. In the following weeks, the index continued to decline as business confidence deteriorated and early signs of recession risk emerged.
May–June: Policy Headwinds Compound Dollar Weakness
As the tariff package took effect, the dollar extended its slide—marking a ~10% drop from its late‑2024 peak, the worst first-half performance in over 50 years. Investors reassessed US growth prospects amid the pressures of trade friction. The Fed responded with a hawkish pause, while President Trump publicly urged for rate cuts, further muddying the policy outlook and pressuring the dollar.
July: Uncertainty Builds
By early July, the DXY had fallen below 97, tallying an approximate 11% year-to-date decline. Analysts cite a “perfect storm” of expanding fiscal deficits, erratic trade decisions, and growing doubts over US policy credibility as key reasons for the dollar’s fall from favour.
Why DXY Matters Now More Than Ever
The DXY has become a real-time gauge of market confidence in US policy stability. The dollar’s sharp decline in 2025 underscores how fragile that confidence can be in the face of aggressive trade measures and uncertain monetary direction.
The introduction of Trump’s tariffs has raised structural concerns among investors:
- Growth expectations have been cut due to higher input costs and supply chain friction.
- The so-called safe-haven appeal of the USD has eroded, with flows shifting to the euro, Swiss franc, and gold.
- Foreign demand for dollar assets has softened, as fears of a prolonged trade conflict and fiscal indiscipline mount.
In this climate, the DXY has evolved into a barometer for geopolitical tension, inflation fears, and investor sentiment towards US leadership.
Bottom Line
The DXY is not just a tool for dollar specialists—it's a key reference for any trader dealing with macro-sensitive instruments. As the global rate environment continues to shift and the US economy shows mixed signals, the DXY may become one of the most revealing indicators to watch and trade in the second half of 2025.
This article represents the opinion of the Companies operating under the FXOpen brand only. It is not to be construed as an offer, solicitation, or recommendation with respect to products and services provided by the Companies operating under the FXOpen brand, nor is it to be considered financial advice.
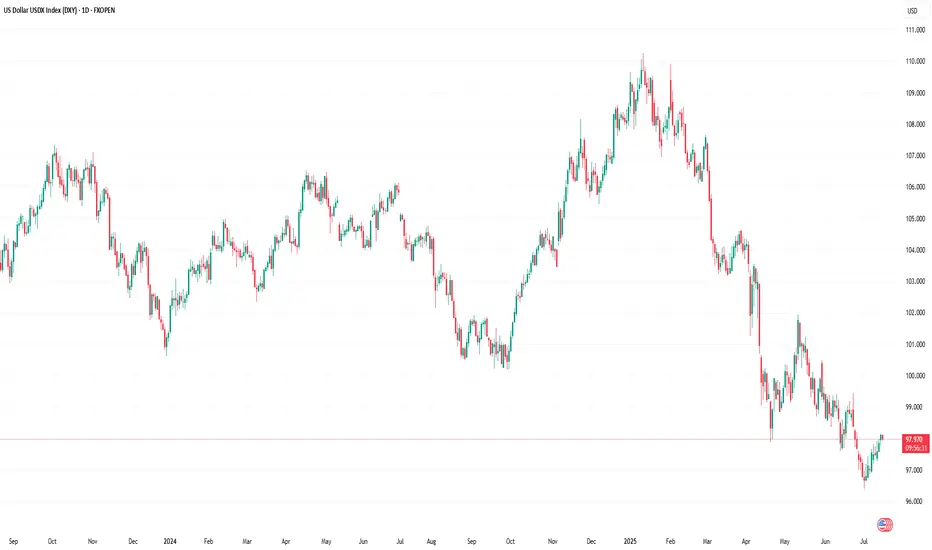
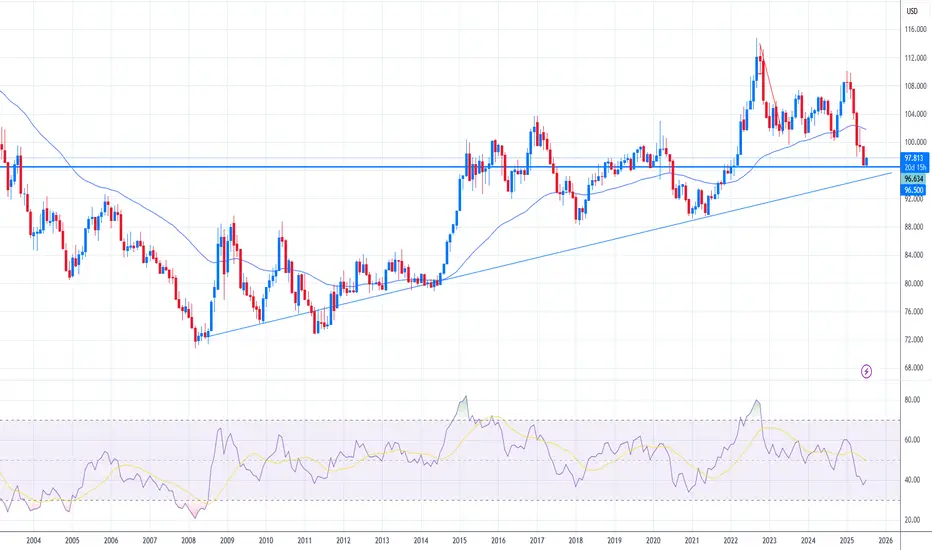
DXY Tests Key Support – What’s Next for the Dollar?
The U.S. Dollar Index (DXY), which tracks the dollar’s performance against a basket of major currencies, recently broke below its 50-month moving average based on the monthly chart —a significant technical signal. After this drop, the index is now bouncing off a key support zone near 96.50.
This area has acted as a pivot point in past cycles, and a sustained bounce could indicate the dollar regaining strength. If risk sentiment fades—due to weaker equity markets, geopolitical tensions, or stronger U.S. data—the dollar might find new momentum.
On the flip side, failure to hold 96.50 could open the door toward the 90.00 zone, a major long-term support level. Such a move would likely reflect expectations of looser U.S. monetary policy or further deterioration in economic confidence.
For now, price action near 96.50 will be decisive. A rebound could shift sentiment back in favor of the dollar, while a deeper decline may trigger broader adjustments in FX markets. Traders should closely monitor upcoming macro data and risk sentiment for cues on the next leg.