USD vs. SEK: Smashing Multi-Year Supports Like a Bear HookupThe USD/SEK pair goes stealing the forex spotlight like a goddamn forex rockstar, grinding lower in a full Bear mode.
The greenback's plunging balls-deep into Bear hell, losing its mojo against the Swedish krona, macro winds are shifting, and the charts are bulldozing long-term supports like a drunk rhino.
The Tech Shortshow
From a TA standpoint, we're witnessing an epic multi-year uptrend reversal - total chart Armageddon.
After recent choppin'/ jerking between 9.0 and 9.5 SEK per buck in H2 2025, Q1 2026 saw it decisively crack 9.0 - that rock-solid support and psych level.
All those dip-buying longs from the past few years? Suddenly bag-holding goes underwater, panic-flushing their positions.
Blasting through the 10-year SMA flips it from cozy dynamic support to a textbook "sell the rip" zone.
Any bounce back there? Big boys will smash it, scooping liquidity pockets to load up on shorts again.
Toss in RSI sub-50 for the last 12 months plus screaming trend strength on short-term frames, and boom - classic D/W setup: "Don't catch that falling knife, buddy."
Fundamentals Tale
Truth bomb: the dollar's safe-haven halo is fading fast. Global cash is ditching the Uncle Sam "hub-and-spoke" system for a messy multipolar vibe - what we call de-dollarization, de-Yankee-fication, diversification, or just "don't bet the farm on the Stars and Stripes."
Geopolitical fireworks, sanction fatigue, and bloc politics are nudging CBs and SWFs to spread reserves across a broader basket. That caps USD upside vs. krona-likes when risk appetite ain't in total meltdown. Sweden keeps shaking off deflation while the US brakes growth and slashes rates? Yield diff tailwind vanishes, turning USD/SEK into a pariah - "sell every bounce" central.
Traders lingo: pair's gone from hot to not. Long holders ain't sticking around post-break, and unless DC magically reclaims macro rockstar status (fingers crossed, not?), USD/SEK's primed for a long, juicy short squeeze-down, not some long-hunter magnet.
USDSEK

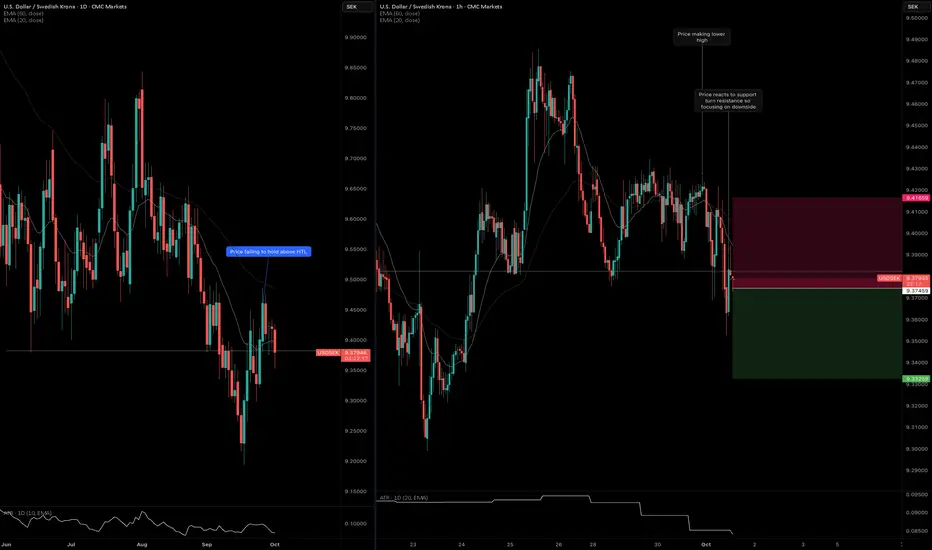
USDSEK: Price Crosses Below HTL AgainUSDSEK traded below the daily HTL, but there's weakness after price crossed back above.
On the other hand, the H1 timeframe is showing weakness. Price is failing to make higher high so I'm betting on downside momentum to pick up.
Reduced position size since we are nearing New York rollover.
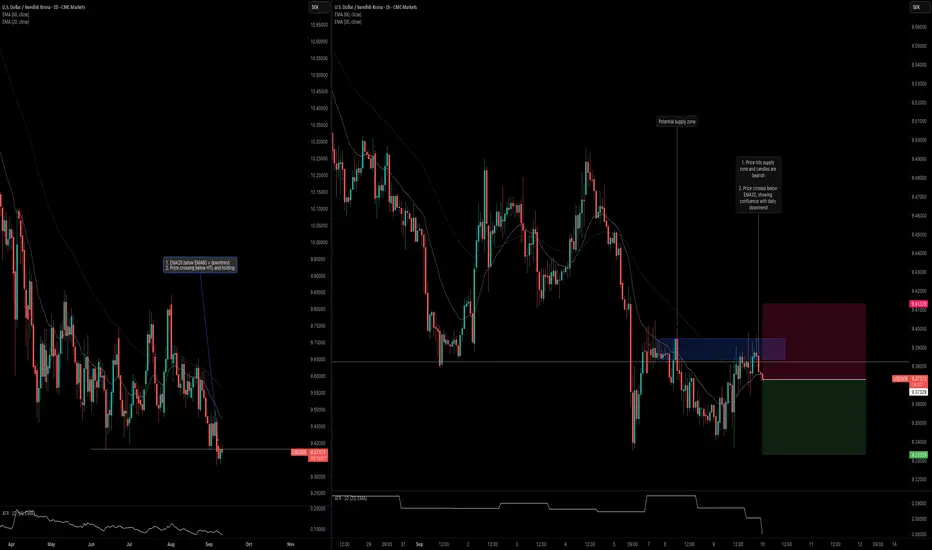
USDSEK: Trend ContinuationUSDSEK is one of the latest pairs to break below a key daily level. Here's my analysis on both the daily and intraday timeframes.
Daily Timeframe:
EMA20 is below EMA60, which indicates that this is a downtrend.
Price crossed below the horizontal trend line (HTL) and then a bullish bar formed that remain below the HTL.
H1 Timeframe:
Price entered a supply zone, and seemed to hold below it.
Price also crossed back below the EMA20, signaling confluence with the overall daily downtrend.
USDSEK: Trend ContinuationUSDSEK looks to resume its downtrend. This is observable based on the daily and 1-hour timeframe confluence.
Daily Timeframe:
Starting on the daily timeframe, EMA20 rests below EMA60, with price hovering below EMA20. This indicates that the overall trend is down.
In addition, price recently made a clean break below the horizontal trendline (HTL). It then tried to trade above it with no success.
1-Hour Timeframe:
Over on the lower timeframe, we see confluence as well. Price crosses below the ascending trendline, which indicates the overall trend is resuming. There's alignment on the daily and 1-hour timeframes.
My entry is based on the consolidating range that formed after the price pullback. Price is now breaking out of this range, which signals that momentum is picking up.

Home of ABBA, IKEA, and Volvo (USD/SEK)USD/SEK has broken below major multi-year support.
While below there we are looking for shorts (i.e. bullish the Swedish krona)
The daily chart has corrected higher but the trend is down.
Another breakdown through the lows could setup another leg lower
Thoughts?

USDSEK | 21.04.2025BUY 9.53000 | STOP 9.44000 | TAKE 9.68000 | Technical view: oversold levels. Correctional return of the price.

Buy idea on USD/SEKBased on
- Cycle analysis and quantitative data
- Strong Demand Zone
- Undervalued Conditions

USDSEK The most 'neat' sell you can take!The USDSEK pair has been trading within a Channel Down since the May 01 2024 High. The price has been on its latest Bullish Leg since the September 27 Lower Low and right now the price is just a step before testing the top (Lower Highs trend-line) of the Channel Down.
At the same time, the 1D RSI touched the 70.00 overbought barrier and turned sideways for the past week. This is a bearish sign as every time it did so since April 30, the Channel Down had topped.
As you can see there is a high degree of symmetry within this Channel and we expect the new Bearish Leg that will start to follow the same parameters. The previous ones bottomed after around -7.00% declines and on the -0.236 Fib extension.
As a result our sell Target as of today is 9.90500 (above the -0.236 Fib on less than -6.89% decline).
-------------------------------------------------------------------------------
** Please LIKE 👍, FOLLOW ✅, SHARE 🙌 and COMMENT ✍ if you enjoy this idea! Also share your ideas and charts in the comments section below! This is best way to keep it relevant, support us, keep the content here free and allow the idea to reach as many people as possible. **
-------------------------------------------------------------------------------
💸💸💸💸💸💸
👇 👇 👇 👇 👇 👇

USDSEK Bearish break-out imminent.The USDSEK pair is testing the Internal Higher Lows trend-line of the 2-year Channel Down pattern, below both the 1D MA50 (blue trend-line) and 1D MA200 (orange trend-line). Having made its last Lower High just above the 0.786 Fibonacci level (similar to the previous Lower High), it is technically expected to break the Internal Higher Lows trend-line and extend to a new Channel Down Low towards the end of the year.
As you can see the structure of this pattern is very symmetrical and with the last Lower Low being just above the -0.186 Fibonacci extension, we expect the next to be at 9.7500 at least.
-------------------------------------------------------------------------------
** Please LIKE 👍, FOLLOW ✅, SHARE 🙌 and COMMENT ✍ if you enjoy this idea! Also share your ideas and charts in the comments section below! This is best way to keep it relevant, support us, keep the content here free and allow the idea to reach as many people as possible. **
-------------------------------------------------------------------------------
💸💸💸💸💸💸
👇 👇 👇 👇 👇 👇

USDSEK Under both major MAs. Sell opportunity.The USDSEK pair is consolidating below both the 1D MA50 (blue trend-line) and the 1D MA200 (orange trend-line). This is half-way through the new Bearish Leg of the 1.5 year Channel Down, with the recent Top in May being formed on the 0.786 Fibonacci, just like the previous Lower High (November 01 2023).
The current consolidation resembles that of November - December 2023, which eventually bottomed on the 1.382 Fibonacci extension. As a result, we expect the price to resume the bearish leg soon and our Target is 10.000 (Fib 1.382).
-------------------------------------------------------------------------------
** Please LIKE 👍, FOLLOW ✅, SHARE 🙌 and COMMENT ✍ if you enjoy this idea! Also share your ideas and charts in the comments section below! This is best way to keep it relevant, support us, keep the content here free and allow the idea to reach as many people as possible. **
-------------------------------------------------------------------------------
💸💸💸💸💸💸
👇 👇 👇 👇 👇 👇

Trade Like A Sniper - Episode 43 - USDSEK - (14th June 2024)This video is part of a video series where I backtest a specific asset using the TradingView Replay function, and perform a top-down analysis using ICT's Concepts in order to frame ONE high-probability setup. I choose a random point of time to replay, and begin to work my way down the timeframes. Trading like a sniper is not about entries with no drawdown. It is about careful planning, discipline, and taking your shot at the right time in the best of conditions.
A couple of things to note:
- I cannot see news events.
- I cannot change timeframes without affecting my bias due to higher-timeframe candles revealing its entire range.
- I cannot go to a very low timeframe due to the limit in amount of replayed candlesticks
In this session I will be analyzing USDCOP, starting from the 3-Month chart.
If you want to learn more, check out my TradingView profile.

A Traders’ Week Ahead Playbook: The tables have turned for riskWhile we await earnings from Nvidia (on 22 May) that will be influential on future market direction, we move into the tail-end of US quarterly earnings, but also past a dovish Fed meeting, a strong US ECI report and weaker-than-expected US nonfarm payrolls and 2 hefty bouts of MoF/BoJ intervention.
Yet, despite these landmines, a gentle calm descends over financial markets – early last week the USD was threatening to trend higher, but now momentum shifts to the downside, with US Treasuries finding better buyers, US interest rate markets pricing close to two cuts by year-end, while the VIX index has pulled back to 13.5%, with the S&P500 closing above the 29 April high.
By way of significant movers - aside from a lazy 25% w/w fall in Cocoa and a 32% w/w gain in Nat Gas – where NG needs to be on the radar given the breakout and the growing potential for a bullish trend to materialise, we see solid movement in the HK50 (closing 6.9% wow), while Bitcoin has rallied 10% off its lows and is eyeing a move back to the 50-day MA at 65,890. In FX, CADJPY saw the biggest 5-day percentage change, falling 3.6% w/w.
The MAG7 equity names look to have regained their mojo, amid solid earnings and some lofty guidance for capex - suggesting growth and innovation remain at the core of their investment thesis, backed by renewed buybacks and some big names even rolling out dividends. China tech is also flying higher, where both Tencent and Alibaba have run hard of late and while overbought should be well supported into weakness.
How the tables have turned, and the reassuring view from Fed Chair Jay Powell that policy is still “sufficiently restrictive” and “it’s unlikely the next policy move will be a hike” has reinvigorated the risk bulls. Add in a weaker US ISM services print and a moderation in US nonfarm payrolls (NFP) and the market has gained greater confidence that the US economy is not indeed overheating. Conviction levels may still be low, but the platform is in place for risky assets to move higher this week, notably if truce talks in Gaza gain real traction.
Looking ahead and the landmines through which we navigate positions:
US data is thin on the ground this coming week, with the senior loan officer survey on bank lending practices really the only economic event risk to be concerned with – traders can trade the KRE ETF (US Regional bank ETF) here and react to markets interpretation of the survey. We also get 11 speeches from Fed members, but until we get the US (April) CPI report on 15 May, I suspect traders will not be too concerned with holding risk over their respective views.
It will be a lively week at a central bank level, with the RBA (on hold), BoE (on hold), Swedish Riksbank (skewed to cut), Banxico (cut) and Brazilian Central Bank (50bp cut) all meeting.
We should get a 25bp cut in Mexico, with a 50bp cut expected to the Brazilian Selic rate.
The RBA meeting and Statement on Monetary policy will get big focus, and while the RBA will almost certainly keep rates at 4.35%, and continue to suggest “the board is not ruling anything in or out”, Aussie swaps price a near 40% chance of a hike by August (see pricing below), so many are expecting a modest shift in their commentary and a clearer roadmap to future hikes – if we don’t see that play out in the wording then we could see the AUD trade lower, notably vs the FX cross rates.
The GBP navigates Thursday’s BoE meeting, with the broad consensus expecting a dovish split in the voting and a statement that justifies the view priced into interest rate pricing, where the BoE is expected to embark on its first cut in August. We also get UK Q1 GDP, a speech by BoE Chief Economist Huw Pill and 1-year inflation expectations from the DMP (Decision Makers Panel), and that could be looked at by some in the market. GBPJPY and GBPAUD shorts, EURGBP longs, were the preferred plays last week, and I still favour these staying in these positions.
Wednesday’s Riksbank meeting puts the SEK (Swedish krona) firmly in play, with economists split on whether we see the Swedish central bank join the Swiss National Bank in starting its easing cycle. The SEK swaps market implies a 25bp cut at around 80% probability, so those holding SEK short positions will have some concern with that position over this event. The risk-to-reward trade-off favours short NOKSEK over the meeting, but a 25bp cut is a lineball call and as many will attest to, trading over news like this is more of an exercise in risk management, or for those running tactical or special situation strategies.
We also see inflation prints in Mexico, Norway, Columbia, Chile, Brazil, and China. Trade data (Thursday – no set time) from China will also get a focus, with imports expected to increase by 4%.
In Japan, I guess kudos go to the MoF/BoJ - they hit JPY shorts hard with two bouts on size intervention and as luck would have it, they’ve been given a helping hand from Jay Powell and the first below estimate NFP print since October 2023. Those using the JPY to fund a saturated carry position will almost certainly think twice about using the JPY tactically here in the near term, and until we see a better trend in the US data, or if we see a hotter US CPI print, USDJPY has scope for ¥150. Conversely, on the week, I’d be expecting the upside to be capped at ¥155 and would be selling rallies into ¥155.50.
As always, an open mind to market movement (as price will always go to where it wants to go), and a dynamic approach to react will serve you well in this market.

USDSEK Sell signal on the 0.786 Fib.The USDSEK pair hit the 0.786 Fibonacci retracement level of the previous Lower High of the long-term Channel Down and has immediately reacted with a rejection. This rejection is the ideal short-term sell entry for a 1D MA50 (blue trend-line) test, which the current Bullish Leg hasn't tested since March 21 2024. Our Target is 10.6000.
-------------------------------------------------------------------------------
** Please LIKE 👍, FOLLOW ✅, SHARE 🙌 and COMMENT ✍ if you enjoy this idea! Also share your ideas and charts in the comments section below! This is best way to keep it relevant, support us, keep the content here free and allow the idea to reach as many people as possible. **
-------------------------------------------------------------------------------
💸💸💸💸💸💸
👇 👇 👇 👇 👇 👇

USDSEK 6-week Trading planThe USDSEK pair followed our trading plan to perfection last time we made a sell call on it (October 06 2023, see chart below) as it completed the Head and Shoulders pattern and aggressively declined to hit our 10.4500 Target:
At the moment the price is ranging within the 1D MA50 (blue trend-line) and 1D MA200 (orange trend-line) being Support and Resistance levels respectively. We have identified the long-term pattern to be a Channel Down since the September 26 2022 High and the current rise since the December 27 2023 Lower Low to be the new Bullish Leg to a Lower High.
The dynamic parameters here are the 0.618 and 0.382 Fibonacci retracement levels. When the previous Bullish Leg hit the 0.618 Fib for the first time on the way up, in got rejected strongly and pulled-back to the 0.382 Fib. As a result and as long as the 1D MA50 holds, we will be bullish targeting the 0.618 Fib at 10.7500 where we will then turn bearish, targeting the 0.382 Fib at 10.4500 where contact can be made with the 1D MA50.
-------------------------------------------------------------------------------
** Please LIKE 👍, FOLLOW ✅, SHARE 🙌 and COMMENT ✍ if you enjoy this idea! Also share your ideas and charts in the comments section below! This is best way to keep it relevant, support us, keep the content here free and allow the idea to reach as many people as possible. **
-------------------------------------------------------------------------------
💸💸💸💸💸💸
👇 👇 👇 👇 👇 👇

USDSEK: Rising towards the September high.USDSEK crossed over the LH trend-line as well as the 1D MA50, ending the 1 month pullback and turning the 1D timeframe bullish again (RSI = 57.915, MACD = -0.004, ADX = 28.535). According to two same fractals within 2023, we should be expecting at least a test of the Resistance, if not the 1.236 Fibonacci extension. As long as the 1D MA50 holds, we are short term buyers aiming at September's High (TP = 11.250).
## If you like our free content follow our profile to get more daily ideas. ##
## Comments and likes are greatly appreciated. ##

USDSEK Head and Shoulders giving an end-of-year sell.We haven't looked at the USDSEK pair in exactly 1 year but it was that Higher Higher rejection (see chart below) that gave us the best sell opportunity since COVID:
On the 1D time-frame an Ascending Triangle has emerged since and the price has been rejected on the latest September 21 Higher High. We can see the emergence of a Head and Shoulders pattern that is supported on Higher Lows. Similar Higher Lows structures have been formed on long-term peaks, you can even see the resemblance on the 1D MACD sequences.
As a result, if the market closes a 1D candle below the 1D MA50 (blue trend-line), we will see and target a potential contact with the 1W MA100 (red trend-line) at 10.4500.
-------------------------------------------------------------------------------
** Please LIKE 👍, FOLLOW ✅, SHARE 🙌 and COMMENT ✍ if you enjoy this idea! Also share your ideas and charts in the comments section below! This is best way to keep it relevant, support us, keep the content here free and allow the idea to reach as many people as possible. **
-------------------------------------------------------------------------------
💸💸💸💸💸💸
👇 👇 👇 👇 👇 👇

USDSEK: Head and Shoulders at the PCZ of a Bearish ABCDUSDSEK is trying to confirm a Right Shoulder of a Bearish Head and Shoudlers Pattern at the PCZ of a Harmonic Bearish AB=CD. If it is able to goback down from here and break through the neckline then we could see action similar to what we saw on the EURHUF.

Emerging market currencies to outperform G10 in 2023With the global economy showing more resilience and the Fed slowing its pace of tightening, we believe EM currencies can outperform relative to G10 peer currencies this year. Attractive real yields should result in market participants accumulating exposure to developing currencies, while our assumption for contained banking sector stresses should lead to improved risk appetite.

USDSEK Trading The Corrective CycleIn this update we review the recent price action in the USDSEK and identify the next high probability trading opportunities and price objectives to target

USDSEK: Elliott wave triangle is pointing down Despite some slow down of inflation in Sweden, this one looks to be ready to break down from a triangle soon. If FED dissapoints to bring more hawks after US PCI miss last week, I think this one can easily break down into a fifth wave.

USDSEK - Let's sit & wait...USDSEK - Let's sit & wait...
Most favourite plan to do on the weekend is my weekend analysis. The market is close, going through higher TF, getting into the zone and ready to crush another week of trading!
USDSEK - Another trading pair I occasionally trade. I feel the behaviour of SEK is very interesting, i'd say I do trade relatively small on this pair but the risk/rewards are great. For now we are waiting for a break to either direction and this is a similar theme on all FX pairs I am looking at. When the market are these conditions I usually add alerts and perhaps limit orders.
Key Tip: Don't forget to follow your trade plan and if you don't have one MAKE ONE!
Trade Journal


