STABLE COINS DOMINANCE BROKE THE SUPPORTAs the stable coins dominance broke the support then in any days rally comes to crypto market like in April's 12 & July's 8th
USDT-D

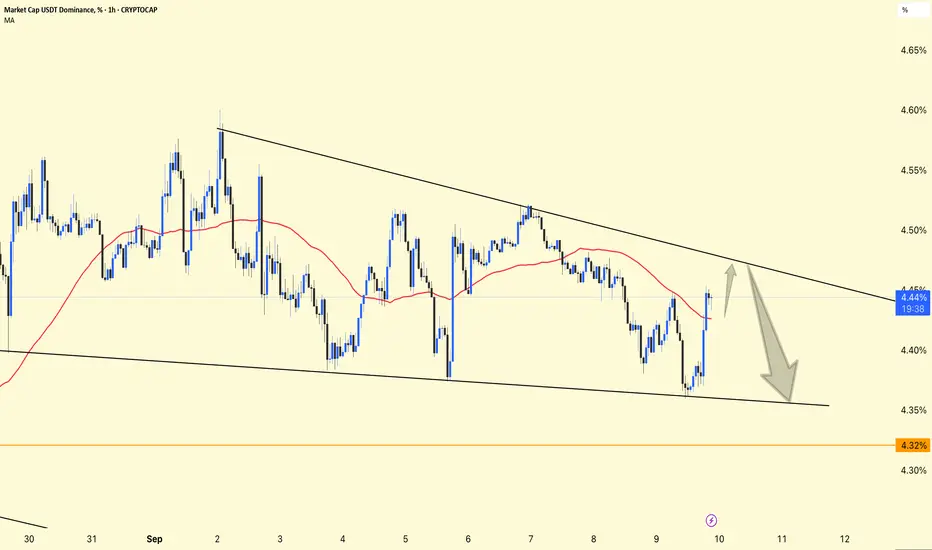
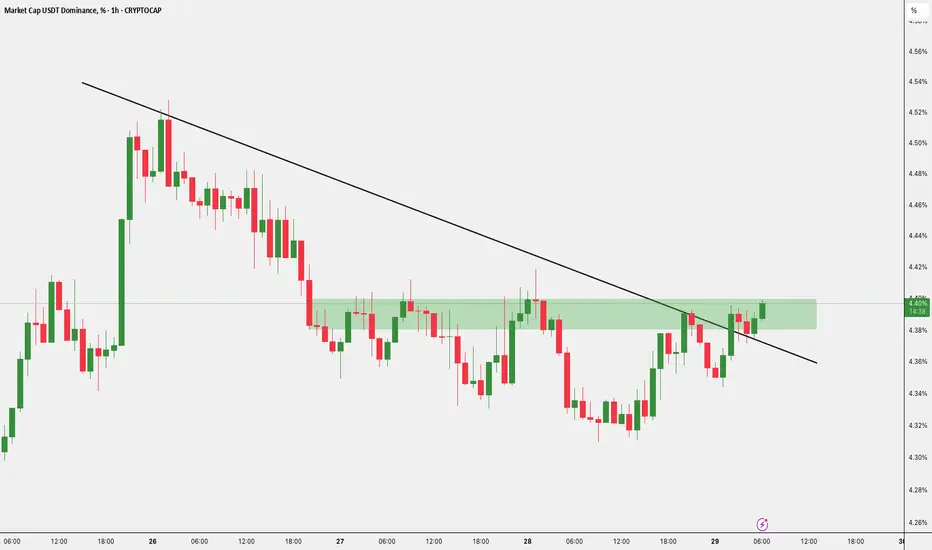
USDT.D 1H Analysis !!USDT.D 1H Analysis
Price is consolidating inside a descending triangle (lower highs + flat bottom).
Currently sitting around 4.44%.
50MA (red) is acting as dynamic resistance, keeping pressure on dominance.
Support Zone
Key support lies near 4.35% (triangle bottom).
A breakdown below this zone could send dominance lower toward 4.32% (orange line).
Resistance
The upper trendline around 4.48%–4.50% is the first big resistance.
Break above → short-term relief rally in dominance.
📈 Outlook
Bullish case: If USDT.D breaks above 4.48%, dominance may rise toward 4.55%–4.60%, usually bearish for crypto prices.
Bearish case: If it rejects and breaks below 4.35%, we can see a move toward 4.32%, which would support bullish momentum in BTC/altcoins.
👉 In simple terms:
Watch 4.48% (resistance) and 4.35% (support).
A breakout = bearish for crypto.
A breakdown = bullish for crypto.
ALCX Trading Update$ALCX Trading Update
$ALCX is currently testing the red resistance zone 🔴. If bulls manage to break out above this level, the first target 🎯 will be the green line level, where buyers are expected to push price next.
⚠️ Confirmation of breakout is key before entering long.
Happy trading ✨

CGPT Trading Update$CGPT Trading Update
After the recent uptrend, $CGPT is now retracing. If the price continues lower into the green support zone around 0.0830, this area could offer a potential long entry.
This zone acted as a resistance in the past and now lines up with the POC and strong buyer volume accumulation — suggesting bulls may defend it and push the price up again.
⚠️ As always, waiting for confirmation before entering long is crucial to avoid false signals.
Happy trading ✨

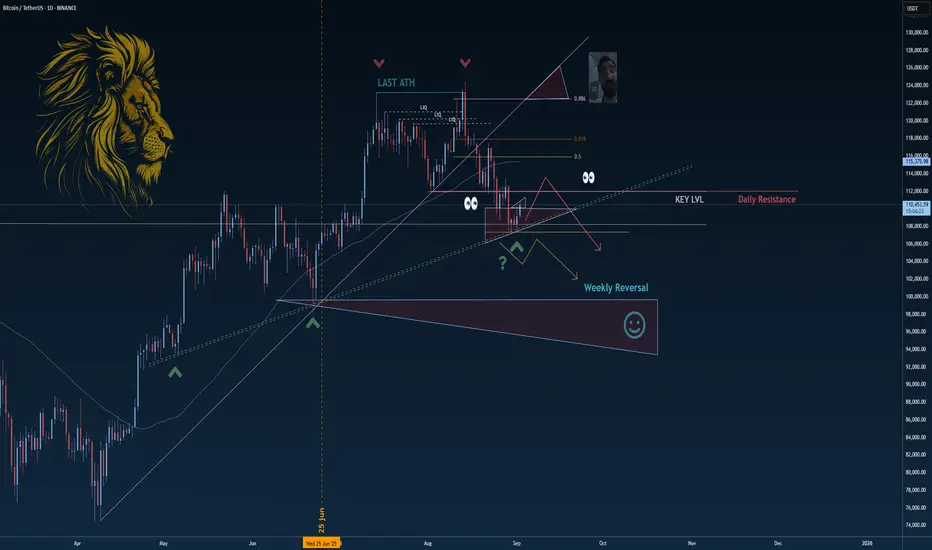
BTCUSDT (Daily)### 🔎 **Chart Context**
* Pair: **BTC/USD**
* Exchange: **Binance**
* Timeframe: **1D (Daily)**
* Current price: \~**112,231**
* Bitcoin is consolidating above the **111,000 support zone**, while the projection targets **130,500** as the next major upside level.
* The structure remains **bullish**, with higher lows intact and fair value gap (FVG) marked below.
---
### 📊 **Key Observations**
1. **Market Structure**
* Last major swing high: **123,731**.
* Recent correction found support near **111,971 – 111,917**, forming a higher low.
* Uptrend remains intact above **100,000 – 104,500 key supports**.
2. **Support Zones**
* **111,900 – 111,500**: Immediate intraday support.
* **104,553 – 100,424**: Strong demand zone aligning with EMA cluster.
* **98,385 – 99,500**: Historical support + fair value gap.
3. **Resistance Zones**
* **119,900 – 123,731**: First resistance block.
* **130,500 (TP)**: Chart projection and major liquidity target.
* Above 130K → possible extension toward **136,000 – 140,000**.
4. **Fair Value Gap (FVG)**
* Marked between **98,000 – 104,500**, which could be retested if BTC fails to sustain current support.
---
### 📈 **Bullish Scenario (Higher Probability)**
* BTC holds above **111,900** support and pushes higher.
* Path: Retest **119,900 → 123,731 → breakout toward 130,500** (main TP).
* If momentum continues, rally could extend toward **136K – 140K**.
---
### 📉 **Bearish Scenario (Risk Case)**
* Breakdown below **111,900** opens path toward:
* **104,500 – 100,400 demand zone**.
* If this fails, price could dip into **98,000 – 99,500 FVG fill**.
* Structure flips bearish only if BTC closes below **98K** on daily.
---
### ⚡ **Trading Plan**
* **Long Setup (Preferred):**
* Entry: 111,900 – 112,200 retest (confirmation bounce).
* TP1: 119,900
* TP2: 123,731
* TP3: 130,500
* Stop: Below 109,500
* **Short Setup (Countertrend):**
* Entry: Rejection at 123,700 – 124,000.
* TP: 111,900 → 104,500
* Stop: Above 125,500
---
### ✅ **Conclusion**
BTC/USD daily chart shows **bullish continuation bias**. Holding above **111,900** strengthens the case for a rally toward **119,900 → 123,731 → 130,500**. A deeper retest into **104K – 100K demand zone** would still be healthy as long as price stays above **98K**.

WLD CAN DO IT AGAIN..It's been a long time since WLD showed a new increasing trend.
Following the coming hours to see if WLD is able to open a new cycle
Never enter any trend directly, wait for the confirmations, and trade only depending your setups.
WLD did show before at good cycle times, that it can do even 12 usd in short term

#Bitcoin Sunday Update#Bitcoin Sunday Update 📉
I’m still holding my short from the past 20 days. CRYPTOCAP:BTC is stuck near $111K, trading weak below the 50MA, and the structure remains bearish. If we get a CPI-driven spike into 115K–120K, I’ll look to add more short positions.
📌 Downside Targets:
105K → 100K → 95K → 90K

BTCUSDT (Daily)### 🔎 **Chart Context**
* Pair: **BTC/USDT**
* Exchange: **Binance**
* Timeframe: **1D (Daily)**
* Current price: \~**110,880**
* BTC has retraced from the **124,474 top** and is now stabilizing above the **111,920 support zone**.
* Projection points toward a **bullish continuation toward 138,000** after reclaiming mid-range resistance.
---
### 📊 **Key Observations**
1. **Market Structure**
* BTC printed a **higher high at 124,474** in August.
* Pullback into **111,920 support zone** has been defended.
* Structure remains **bullish** on daily timeframe as long as BTC holds above **100,000 – 111,000 range**.
2. **Support Zones**
* **111,920 – 110,530**: Immediate support, currently holding.
* **99,475 – 100,372**: Strong historical support cluster, high-volume node on VPVR.
* **88,765 – 90,500**: Deeper demand zone if broader correction occurs.
3. **Resistance Zones**
* **119,902 – 123,218**: First major resistance ahead.
* **124,474**: Swing high and liquidity cluster.
* **138,000 – 140,000**: Next big target & projected liquidity pool (aligned with chart’s TP).
4. **Volume Profile (VPVR)**
* Clear **volume gap above 120,000**, meaning once BTC reclaims **119,900**, price can accelerate toward **138,000**.
* Heaviest volume traded between **95,000 – 105,000**, forming a strong support base.
---
### 📈 **Bullish Scenario (Higher Probability)**
* Price sustains above **111,920 support**.
* Path:
* Retest 119,900 → Break 124,474 high → Rally into 138,000–140,000 zone.
* This aligns with projection, suggesting continuation after consolidation.
---
### 📉 **Bearish Scenario (Risk Case)**
* Breakdown below **111,920 – 110,530 support**.
* Next downside levels:
* **100,000 – 99,475** → Major support & volume shelf.
* **88,765 – 90,500** if selling accelerates.
* A daily close below **99,000** would shift structure to bearish mid-term.
---
### ⚡ **Trading Plan**
* **Long Setup (Preferred):**
* Entry: 111,920 – 110,530 support retest.
* TP1: 119,900
* TP2: 124,474
* TP3: 138,000–140,000
* Stop: Below 109,000
* **Short Setup (Countertrend):**
* Entry: Rejection from 119,900 – 124,474 zone.
* TP: 111,920 → 100,000
* Stop: Above 125,500
---
### ✅ **Conclusion**
BTC/USDT daily remains **bullish**, holding key support at **111,920**. The most probable scenario is **continuation toward 119,900 → 124,474 → 138,000**, with strong momentum if BTC reclaims **120K**. Only a breakdown below **100K** would invalidate the bullish trajectory.


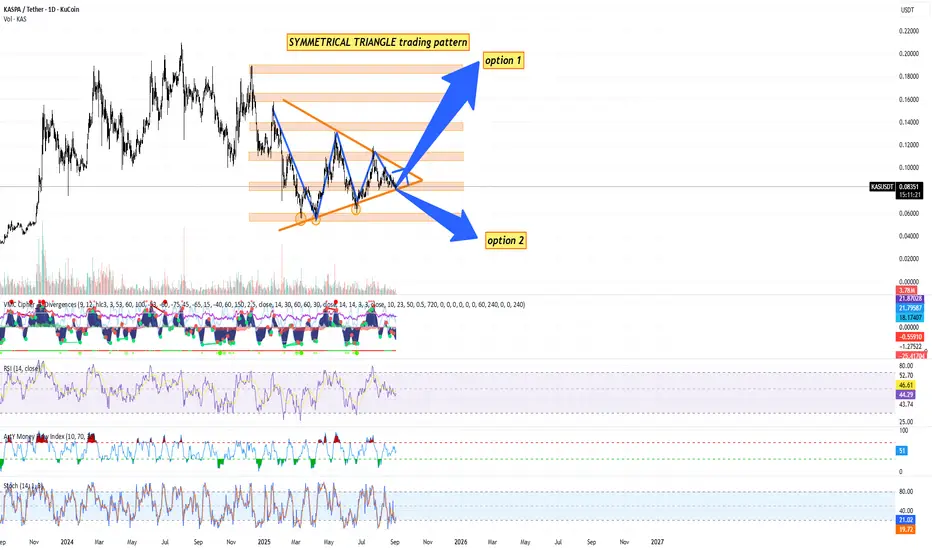
KASPA / USDT DAILY CHART KUCOIN - TA + TRADE PLANTechnical Analysis (Daily Timeframe) by Blaž Fabjan
Chart Pattern
The price is consolidating within a Symmetrical Triangle pattern.
This is a neutral continuation pattern – it signals that a major breakout (either upward or downward) is approaching as the apex is nearing.
Both higher lows and lower highs confirm the formation.
Key Support & Resistance Levels
Immediate support zone: $0.080 – $0.082
Strong support below: $0.070
Immediate resistance: $0.095 – $0.100
Major resistances above: $0.120, $0.140, $0.160, $0.200, $0.220
Indicators
Volume: Declining within the triangle – typical before a breakout.
RSI (14): ~46 → Neutral, no overbought/oversold signals.
Stochastic RSI: Oversold (~20), suggesting possible short-term upside bounce.
MFI (Money Flow Index): Neutral (~51), showing balanced inflows/outflows.
MACD/VM indicator: Bearish momentum has slowed, histogram flattening.
Scenarios
Option 1 (Bullish breakout): If KAS breaks above the $0.095–$0.100 zone with volume, next targets are $0.120 → $0.140 → $0.160 → $0.200+.
Option 2 (Bearish breakdown): If KAS loses $0.080, potential retest of $0.070 → $0.060 support levels.
Trading Plan for KAS/USDT
🔹 Short-Term Swing Trade (1–4 weeks)
Entry Zone (Buy):
Aggressive: $0.082 – $0.085 (current support area).
Conservative: On confirmed breakout above $0.095 with volume.
Stop Loss:
Below $0.078 (tight stop) OR below $0.070 (safe stop).
Take Profit Targets:
$0.100 (first resistance, partial TP)
$0.120 (main target)
$0.140 (strong resistance)
🔹 Medium-Term Position Trade (1–3 months)
Entry Strategy: Accumulate in the $0.080–$0.085 range.
Stop Loss: Below $0.070 (close daily candle confirmation).
Targets:
Base case: $0.160
Optimistic case: $0.200 – $0.220
🔹 Risk Management
Risk per trade: 1–2% of portfolio.
Position sizing according to stop-loss distance.
Avoid over-leveraging; triangle breakouts can produce false moves before direction confirms.
Kaspa is entering the decision zone – the symmetrical triangle is compressing, and a major breakout is imminent in coming weeks.
Momentum indicators show neutrality, giving equal probability for either breakout direction.
The safest approach is to wait for breakout confirmation (daily close above $0.095 or below $0.080 with volume).
If bullish, Kaspa could target +40–100% upside over the next quarter. If bearish, downside risk is -20–30%.
Recommendation:
For conservative traders → wait for breakout confirmation.
For aggressive traders → accumulate around support ($0.082–$0.085) with tight stop-loss below $0.078 and scale out profits at resistance levels.
$USDT dominance broke out.CRYPTOCAP:USDT dominance just broke out of its months-long downtrend and is holding steady above 4.4% 👀.
This could be an early signal of shifting momentum in the market.
DYOR,NFA

USDT Dominance Update – Market at a Turning PointUSDT Dominance got rejected from the 4.55% – 4.60% resistance zone and is now consolidating right on the dynamic yellow trendline and the white diagonal support.
📊 Key Points:
• This area is a critical decision zone.
• Holding above support could trigger another push toward 4.55–4.60%.
• But a clean breakdown below 4.44% may open the way to 4.35% – 4.30%, which would be very bullish for altcoins.
⚡ Conclusion: USDT dominance is at a major crossroad – the next move will likely define the short-term direction for both Bitcoin and altcoins.

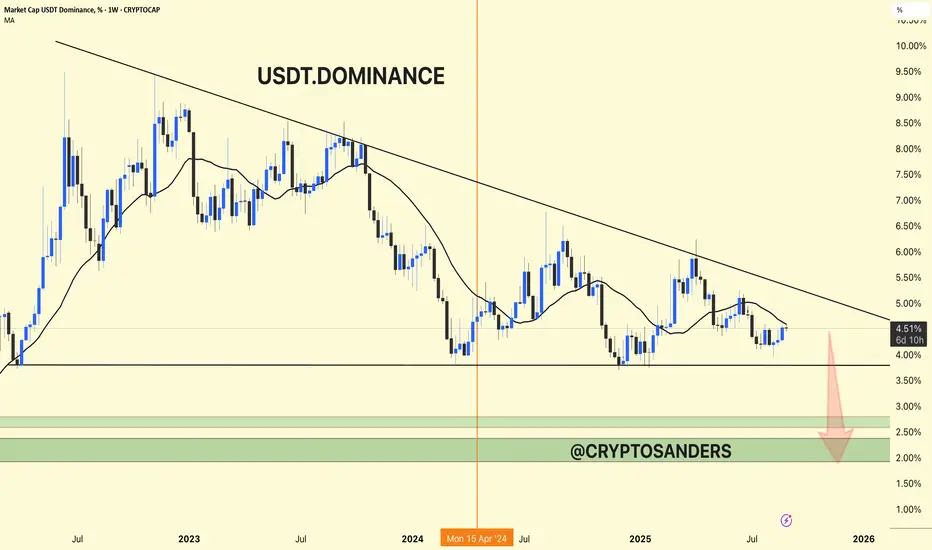
USDT Dominance Weekly Chart Update!!USDT Dominance Weekly Chart Update
USDT dominance continues to decline and is hitting lower highs. This indicates that capital is slowly shifting from stablecoins (USDT) to crypto assets (BTC, ETH, and altcoins).
Support Zone: The main support is between 3.5% - 2.5%. If dominance falls into this zone, it could trigger a strong bullish move in altcoins and BTC.
Perspective: A decline of 2-2.5% would signal the start of a big altcoin season.
⚡ Current Status (4.49%): The market is moving in an uptrend. If dominance continues to decline, expect strong inflows into crypto.
DYOR | NFA

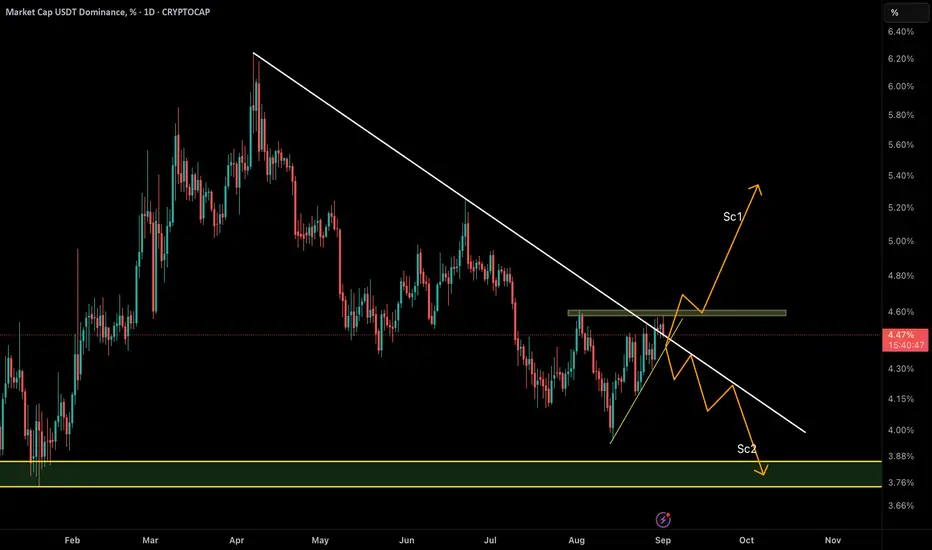
USDT Dominance at a Key Decision Point ,Crash or Fly?USDT Dominance has managed to break above the descending trendline (white line) with volume, but so far it has failed to clear the order block resistance at 4.61% (green zone).
At this stage, price action is stuck between two critical levels, and the next move could define the market’s mid-term direction:
🔸 Scenario 1 (Bullish for USDT.D / Bearish for Crypto):
A clean break and acceptance above the 4.61% order block would confirm demand for stablecoins, signaling capital rotation out of crypto assets. This could trigger a market-wide selloff in Bitcoin and altcoins.
🔸 Scenario 2 (Bearish for USDT.D / Bullish for Crypto):
Failure to hold above the broken trendline and a rejection from 4.61% could drive USDT.D back below the descending line, opening the path toward the 3.8% demand zone. This would suggest capital flowing back into crypto, fueling a potential bullish rally.
⚠️ Market participants should keep a close eye on this area — the reaction around 4.61% will set the tone for the weeks ahead.
BTCUSDT 1H🔎 Chart Context
• Pair: BTC/USDT
• Timeframe: 1H
• Current price: ~109,399
• Bitcoin is in a short-term bearish trend, with consistent lower highs and lower lows since rejecting 117,429.
• The chart highlights a potential relief bounce into supply zones, before continuation toward 106,000.
📊 Key Observations
1. Market Structure
• Major high: 117,429 (strong rejection).
• Recent lower highs: 115,666 → 113,485 → 112,625.
• Last swing low: 107,350 with minor relief bounce in play.
• Overall structure: bearish, favoring downside continuation.
2. Support & Demand Zones
• 108,666 – 107,350: Current demand area, temporary support.
• 106,000: Marked liquidity target; a key downside magnet.
• Below 106,000 → potential continuation toward 104,500–105,000 if selling pressure accelerates.
3. Resistance & Supply Zones
• 110,345 – 110,862: Immediate intraday supply zone.
• 112,371 – 112,625: Secondary supply / breakdown origin.
• 115,000+: Stronger resistance, unlikely to be reclaimed without higher timeframe reversal.
4. Liquidity Map
• Buy-side liquidity: Above 110,862 & 112,625 (short-term stops).
• Sell-side liquidity: Below 107,350 and 106,000 (primary target).
• The chart shows price likely to engineer a bounce into supply before continuation lower.
📈 Bullish Relief Scenario (Countertrend)
• Price holds 107,350–108,666 support.
• Short-term bounce path:
• TP1: 110,345 → 110,862
• TP2: 112,371 → 112,625 (secondary supply)
• This move would likely just be a retracement before continuation down.
• Invalidation: Break above 113,000–113,500.
📉 Bearish Scenario (Higher Probability)
• BTC rejects from 110,345 – 110,862 supply zone.
• Path:
• Selloff resumes → sweep 107,350
• Target: 106,000 liquidity level
• A clean 1H close below 106,000 could trigger further downside into 104,500–105,000.
⚡ Trading Plan
Short Setup (Preferred):
• Entry: 110,345 – 110,862 (supply zone rejection)
• TP1: 107,350
• TP2: 106,000
• TP3 (extension): 104,500
• Stop: Above 112,000
Long Setup (Countertrend):
• Entry: 107,350–108,000 demand defense
• TP: 110,345 → 110,862
• Stop: Below 107,000

BTC Ready to strong fallBTC is poised for a big drop to the 200 EMA. Close your positions and prepare for a strong entry in October.

Crypto Market at a Major Crossroad, USDT Dominance Will TellUSDT Dominance has reached the critical descending trendline resistance – a major decision point for the entire crypto market.
🔹 If USDT.D breaks above this trendline and holds, it signals rising demand for stablecoins. This usually means capital is leaving crypto assets, potentially starting a long-term bearish phase for the market.
🔹 On the other hand, if USDT.D fails to break this resistance and gets rejected, it could trigger a decline in dominance. That would suggest money is flowing back into Bitcoin and altcoins, opening the door for a possible new rally.
⚠️ The next few days are crucial. This zone is a macro decision point that may define the medium-to-long-term direction of the crypto market.

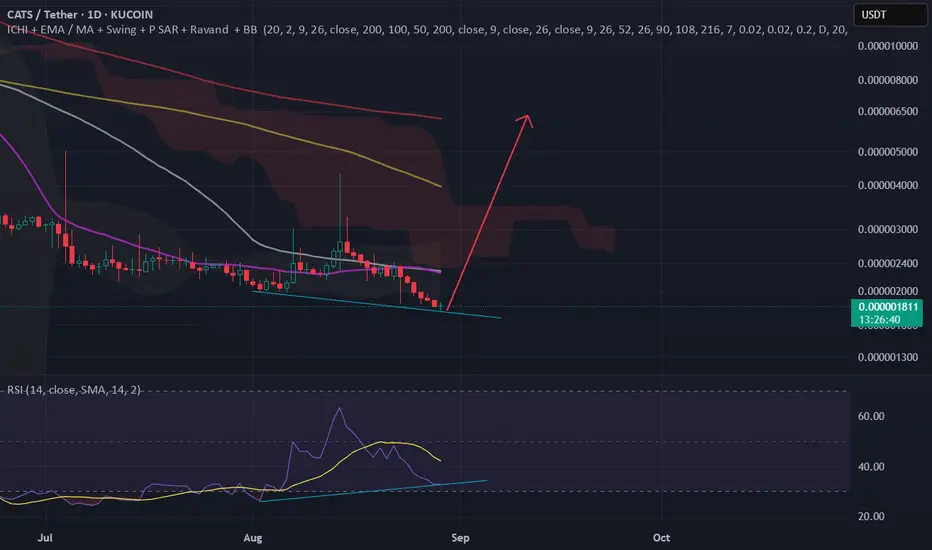
CATSUSDTat technically RSI in daily Chart has Positive Divergence , Break out Excepted , Buy before Explode About to 4x For First
$USDT Dominance Is Knocking Breakout or Rejection Ahead?CRYPTOCAP:USDT 👀 dominance is knocking on the 4.40% level. If it breaks through, alts might feel some pressure.
But if it gets rejected, we could see a nice relief bounce for altcoins.
DYOR, NFA
THIS CAN BE THE CANDLE THAT WILL BRING BTC BACK TO 117KTHIS CAN BE THE CANDLE THAT CAN BRING BTC BACK TO 117K
Following it with 100% focus.
High chance BTC is going to 117K after confirmation 113K

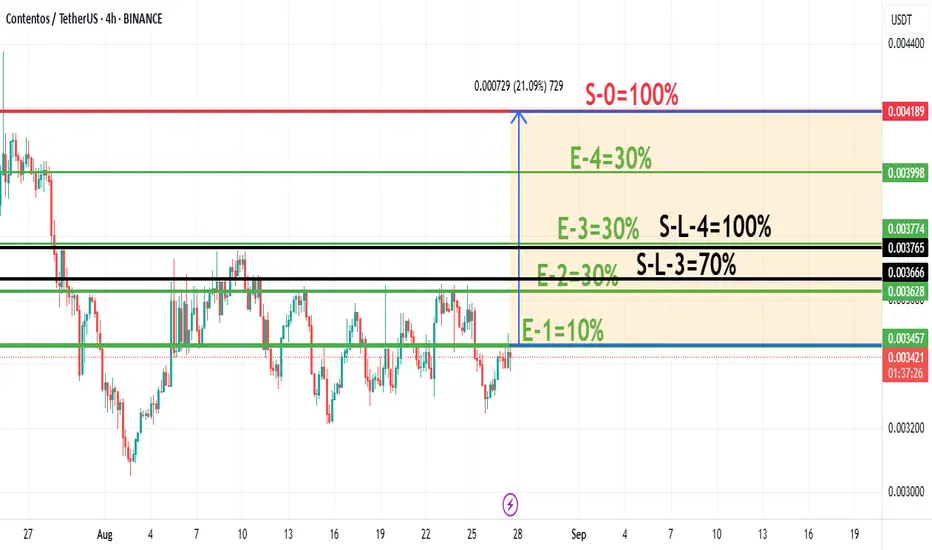
Proposed ~11% Average Gain Trade Strategy with COSThis is a 4-step buying plan where you add to your position as the price goes up. Your stop-loss automatically moves to a "breakeven" point after each phase, guaranteeing no loss if the price reverses.
1. The Entries (Buying More as it Rises):
E-1: Buy 10% at price 0.003457
E-2: Buy another 30% at the higher price 0.003774
E-3: Buy another 30% at the higher price 0.004189 (You now own 70%)
E-4: Buy the final 30% at the high price 0.008998 (You now own 100%)
2. The Exits & Risk Management (The "No-Loss" Trick):
After E-3 (70% owned), you set a Stop-Loss at S-L-3.
The S-L-3 price is set at your average purchase price for the first 70%.
If the price hits S-L-3, you sell all 70%. Since the price is at your average cost, you break even and lose nothing.
After E-4 (100% owned), you move your Stop-Loss to S-L-4.
The S-L-4 price is set at your new, higher average purchase price for the entire 100% position.
If the price hits S-L-4, you sell 100%. Again, you break even and lose nothing.
3. The Profit Target:
You sell your entire 100% position for profit at the final target price: S-0.
In simple terms: You keep buying as the price goes up. After each major purchase, you move your stop-loss to the price you paid on average, locking in a "no-loss" scenario. Your only goal is to reach the high-profit target (S-0) without being stopped out at breakeven.
* This is for educational purposes only and is not investment advice