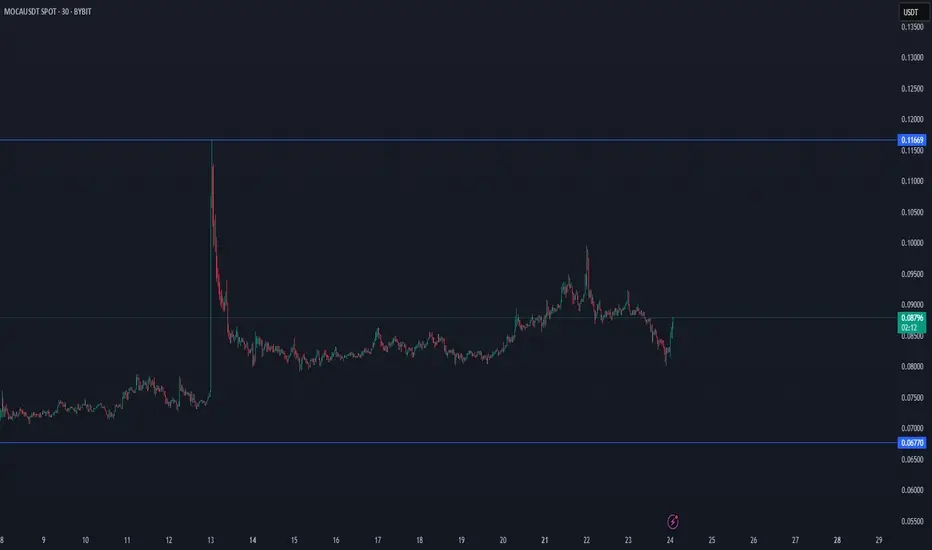
MOCA/USDT NEW VOLUME RANGEMOCA/usdt starting with new volume range, which can get confirmed in the next hours.
our follow will here for this coin to see new confirmations.
USDT-D
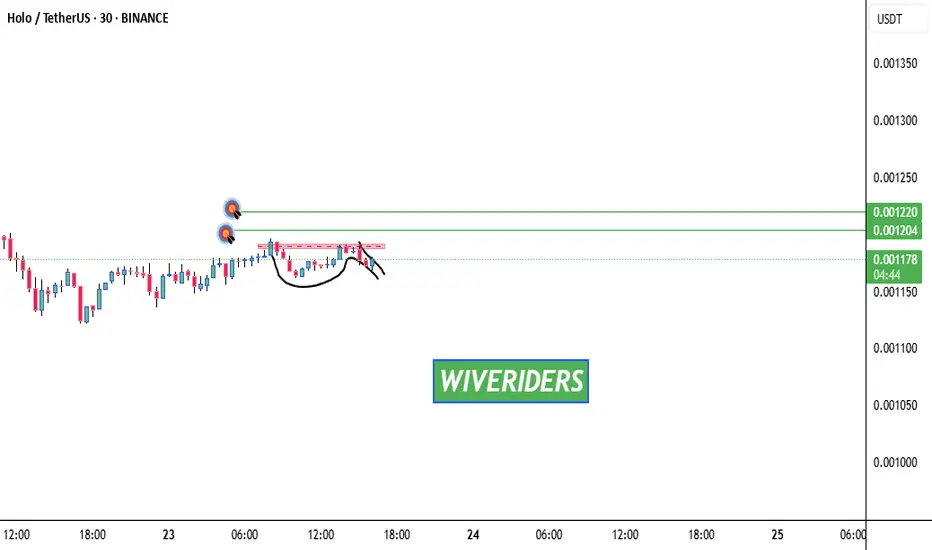
Cup & Handle Formation 🚨 XETR:HOT Testing Red Resistance – Cup & Handle Formation 📈
XETR:HOT is currently testing the red resistance zone and has formed a bullish Cup & Handle pattern on the chart — a classic continuation setup.
If breakout is confirmed, potential upside:
✅ First Target: Green line level
✅ Second Target: Green line level
🕵️♂️ Wait for clear breakout confirmation before entering long.
This pattern often signals strong momentum if buyers step in.
Trade smart. Let’s monitor for the perfect entry! 💹💼
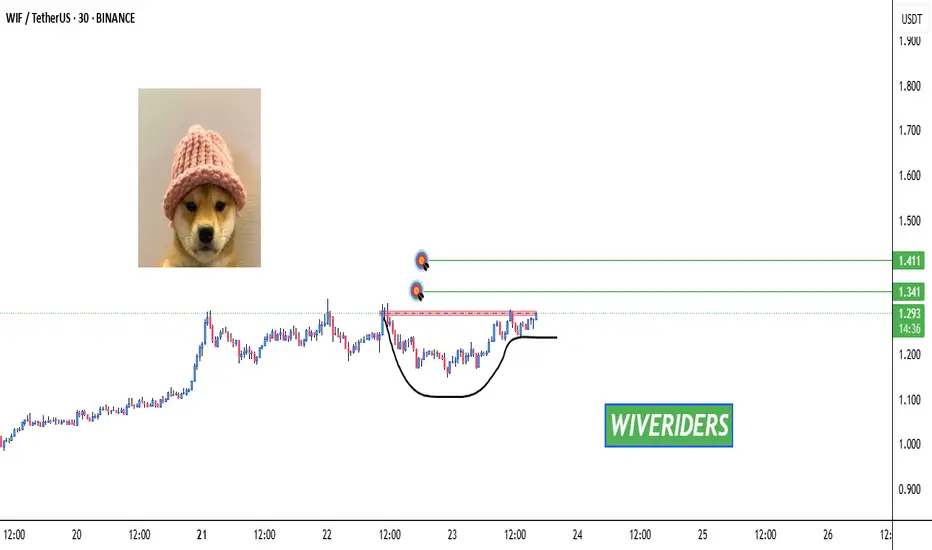
Bullish Cup & Handle Pattern Formed 🚨 SEED_WANDERIN_JIMZIP900:WIF Testing Red Resistance – Bullish Cup & Handle Pattern Formed 📈
SEED_WANDERIN_JIMZIP900:WIF is currently testing the red resistance zone and has formed a bullish cup and handle pattern on the chart.
If a breakout occurs, potential upside toward:
✅ First Target: Green line level
✅ Second Target: Green line level
Wait for breakout confirmation before entering long. 📊
Patience is key—watch this closely! 💼💸
$RAYUSDT Breakout: 146% PotentialNASDAQ:RAY just broke out of a major downtrend and flipped key resistance into support around $3.208 –$3.352.
If it holds, a move toward $8+ is on the cards, nearly
146% upside.
Momentum appears strong; watch for a clean retest and potential continuation.
DYOR, NFA

$CUSDT Breakout Targeting $0.47BITGET:CUSDT just broke out of and is now retesting the $0.34–$0.35 resistance zone.
If this level holds, we could see a strong move toward $0.47, nearly a 47% upside.
Momentum looks solid, but confirmation will come with a clean bounce.
DYOR, NFA

Tether Dominance Testing Support Zone – Big Move Coming?USDT.D is moving sideways right now.
If it breaks down below this range, it could fuel another leg up for altcoins.
Keep a close eye, the next move could shift the market.
$CUSDT Breakout: Eyes on 94% Upside.BITGET:CUSDT is showing signs of strength again.
After a healthy pullback, it held support and broke out of the falling wedge.
This move could kickstart the next leg up, with a potential target near $0.53882, almost 94% from here.
Keep it on your radar if momentum picks up.
DYOR, NFA

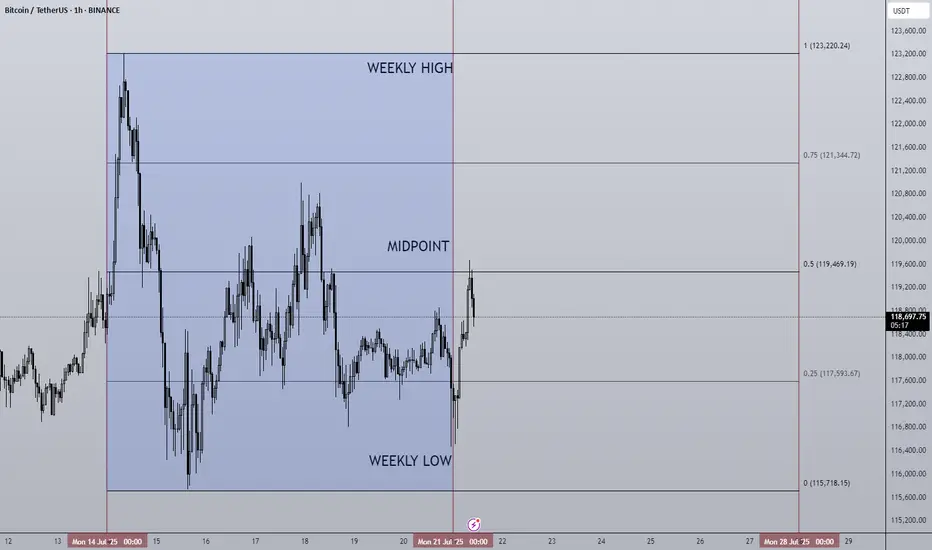
21/07/25 Weekly OutlookLast weeks high: $123,220.24
Last weeks low: $115,718.15
Midpoint: $119,469.19
New BTC ($123,220) & SPX ($6,315) ATH last week! We're really seeing progress being made on all fronts now, bitcoin saw its sixth week of net inflows into BTC ETFs ($2.39B).
The week began strong hitting the new ATH very early and then settled into a tight range to cool off. Altcoins however surged in relation to BTC to break out of HTF downtrends and begin to make up lost ground. One of the beneficiary's of this price movement has been ETH, breaking out from a multi year downtrend against BTC and hitting $3,800 in its USD pair.
For this week I do expect much of the same for BTC as momentum is with altcoins for now. However, as those altcoins reach HTF resistance levels it becomes very important for Bitcoins chop to be accumulation for the next leg up and not distribution for the way down. With so few pullbacks the threat of a sudden correction is present but the probability drops should BTC look to press higher with strong demand.
The ECB Interest rate decision takes place on Thursday but no changes to the 2.15% rate is forecast. In terms of news there are no planned upsets that I can see.
Good luck this week everybody!
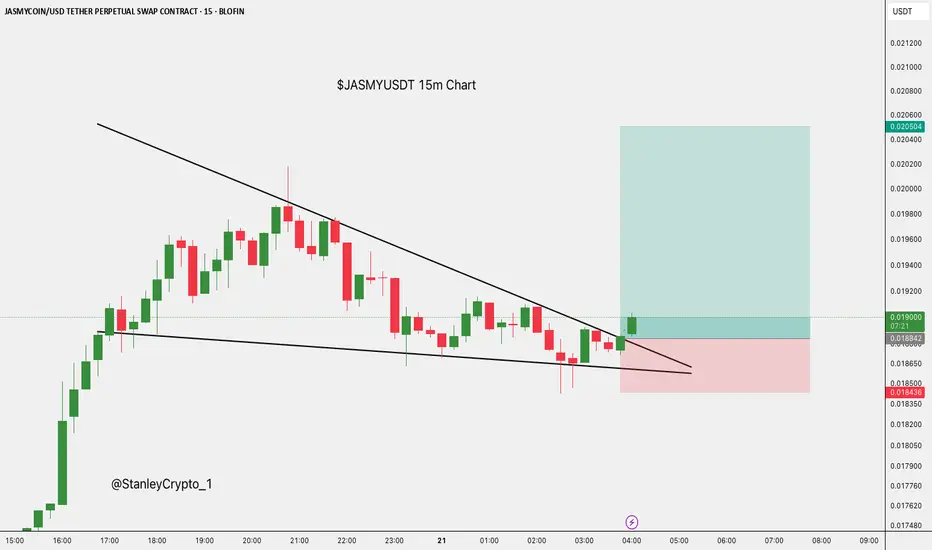
$JASMY 15Min Breakout Setup.$JASMY/USDT – 15Min Breakout Setup
- Entry: CMP
- SL: $0.018432
- Targets:
- TP1: $0.019604
- TP2: $0.020505
Wedge breakout forming.
DYOR, NFA
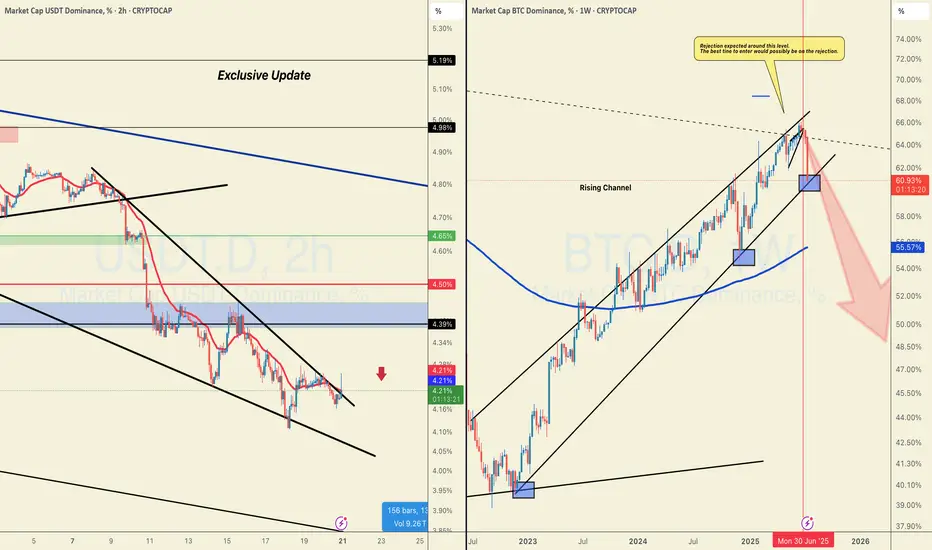
#BTC.D Just Hit the DAILY SUPPORT, WILL THERE BE A PULLBACK?CRYPTOCAP:USDT is breaking out on LTF while BTC.D just hit support that looks ready to break down.
Not a short call, but if you've been trading well, this is when you reduce margin and cut leverage.
Although I could be wrong about USDT here but profit-taking matters.
We will probably get a pullback this week to enter again.
It's better to watch coins rise a few more waves without you than to give it all back in a few reckless trades.
Spot bags? HODL and DCA.
Futures? Trade cautiously.
DYOR. NFA.
Do show your support with your likes if this post adds any value, and hit the like button.
Thank You
#PEACE
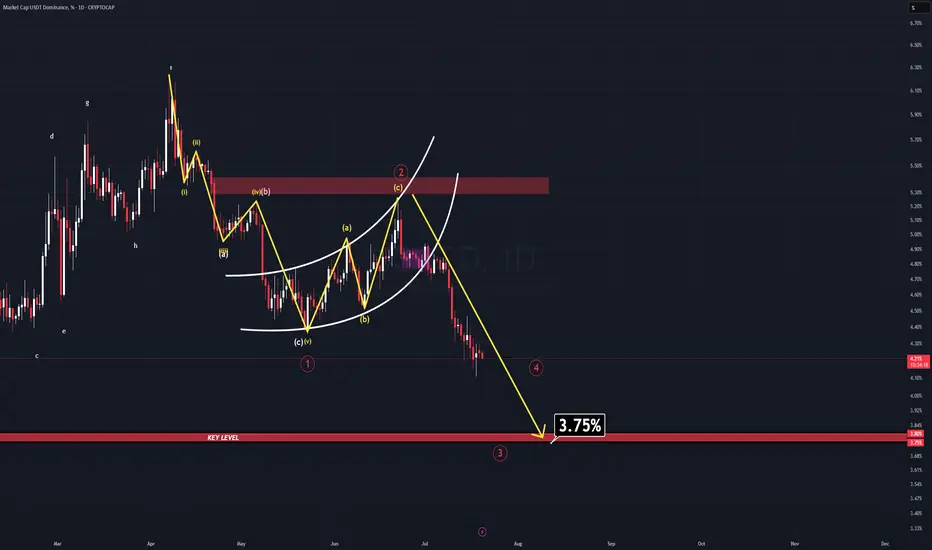
USDT DOMINANCE NEW UPDATE (1D)In a previous analysis, I mentioned that the long-term outlook for this parameter (USDT.D) remains extremely bearish. At the time, a bear flag was clearly visible—but it hadn’t been broken yet.
Well, now it has.
The breakdown confirms the bearish continuation, and there’s still more room to fall. As USDT.D continues to descend towards the projected target for Wave 3, we are likely to see a new All-Time High in Bitcoin, accompanied by a strong rally in many altcoins.
The main target for Wave 3 sits at 3.75%—a historically critical level. For years, USDT.D has never fallen below this zone, making it an extremely strong support area.
⚠️ Reminder: Consider taking profits when USDT.D approaches the 3.80–3.75% region. A reversal or temporary bounce is highly likely there.
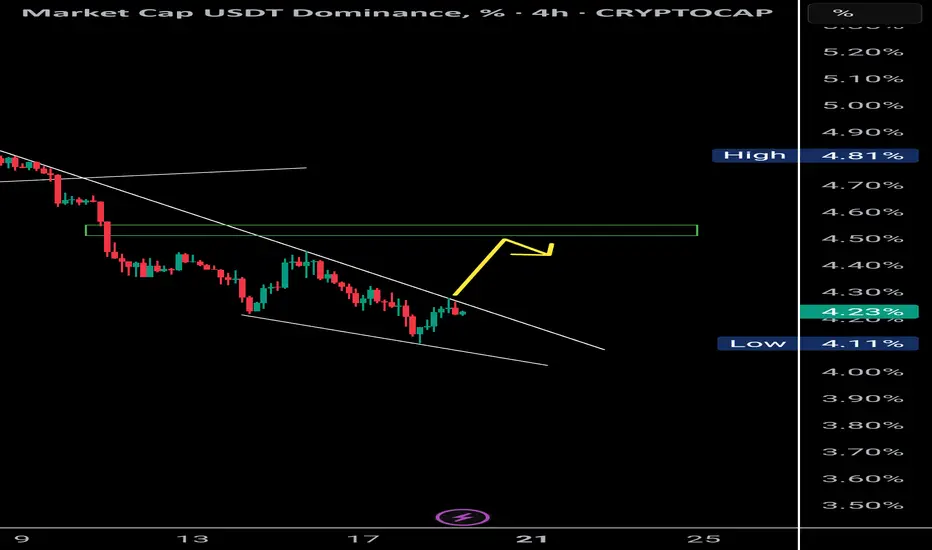
USDT Dominance Forming Bullish Divergence | Altcoins May Retest 📉 USDT Dominance (4H):
Currently forming a bullish divergence with RSI, supported by a falling wedge structure. Price is respecting a clear supply OB (resistance zone) and might retest the 4.55% level.
🔁 Historically, a rise in USDT.D signals short-term corrections in BTC and altcoins, creating opportunities for OB/supply fills and long setups.
📊 This could be the retest phase for major crypto assets before resuming upward momentum.
🧠 Use this phase wisely — it’s where strong setups begin to form.
$SUSDT (or S , ex FANTOM): good entry for a long setupCrypto Market Outlook
The overall crypto market is in a clear uptrend.
The money printer is running, and USD dominance is dropping — all signs pointing to a potential continuation of the rally in the coming months.
Unless a black swan event hits, it's not too late to position yourself if you’re still on the sidelines.
⚠️ Always manage your risk with a proper stop loss — altcoins move fast and can reverse just as quickly.
One interesting setup: $S
✅ Relatively new
✅ Didn’t pump too hard
✅ Broke out of its downtrend
✅ Found solid support
The Fib levels offer good targets for take profit zones.
🔍 Ideal entry: within the green box or lower.
Let the pump cool off — it could offer a perfect entry opportunity. Be patient and wait for a good position.
If $S pumps from here without retrace:
→ Jump in with a tight stop loss
→ Or look elsewhere for a better risk/reward setup.
DYOR.
#Crypto #Altcoins #Bitcoin #ETH #Trading #CryptoMarket #TechnicalAnalysis #RiskManagement #DYOR

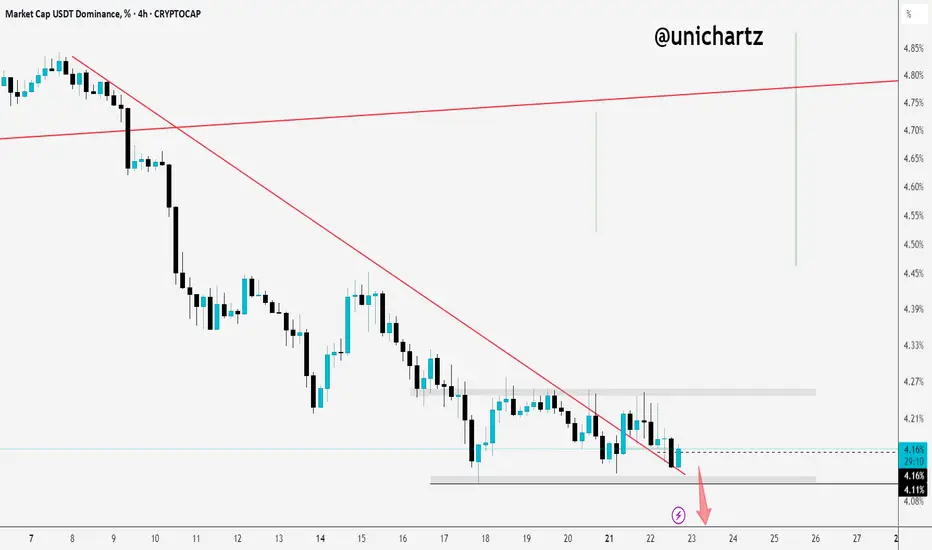
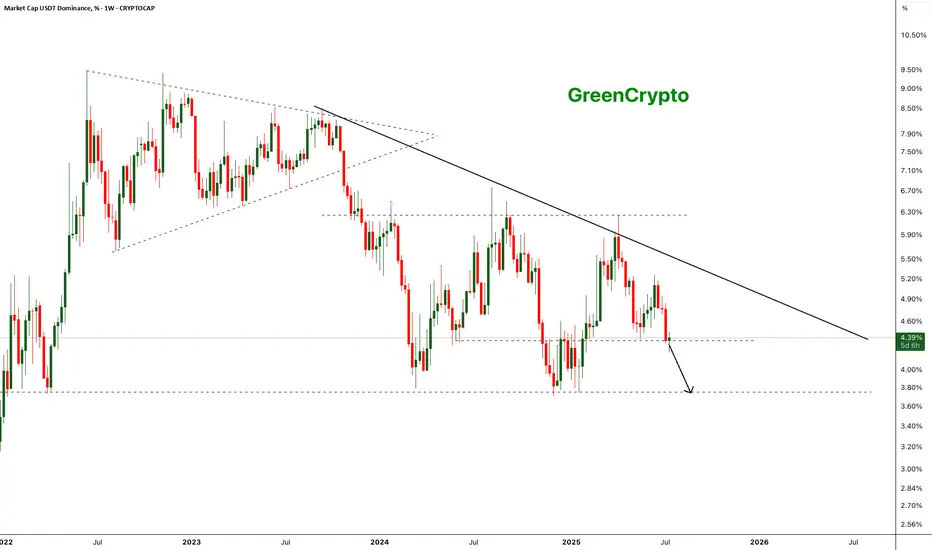
Bearish Breakdown in USDT Dominance - Altseason Loading?The chart shows a clear long-term descending trendline acting as resistance since mid-2023. After multiple failed attempts to break this trendline, USDT dominance has broken below a key horizontal support around ~4.35% on strong bearish momentum.
- Weekly close below the ~4.35% horizontal support.
Next key support zone: ~3.65–3.70% (marked by previous 2023 lows).
- Strong bearish engulfing candle confirming breakdown.
- Bearish continuation expected if dominance remains below 4.35%.
Further drop of the usdt dominance will start the altseason
Cheers
GreenCrypto
$SXP in falling wedge and retested weekly supportSaw this oldie in my watch list and seems like a good risk-reward setup on weekly chart. Held support, now needs to flip that smaller resistance in the wedge (white line) then break out.
Long term play (swing long)

$HEIUSDT Bullish Setup.$HEI/USDT has broken out of a long-term downtrend on the daily chart.
After a successful retest, it’s showing bullish momentum with a potential 170% upside toward the $0.8000 zone.
DYOR, NFA

$NOT Trade Setup 4H Chart. GETTEX:NOT Trade Setup (4H)
- Long Entry: CMP
- Stop Loss: 0.001965
- TP1: 0.002272, TP2: 0.002453, TP3: 0.002675
Retest of trendline support.
Low leverage.
DYOR. NFA.

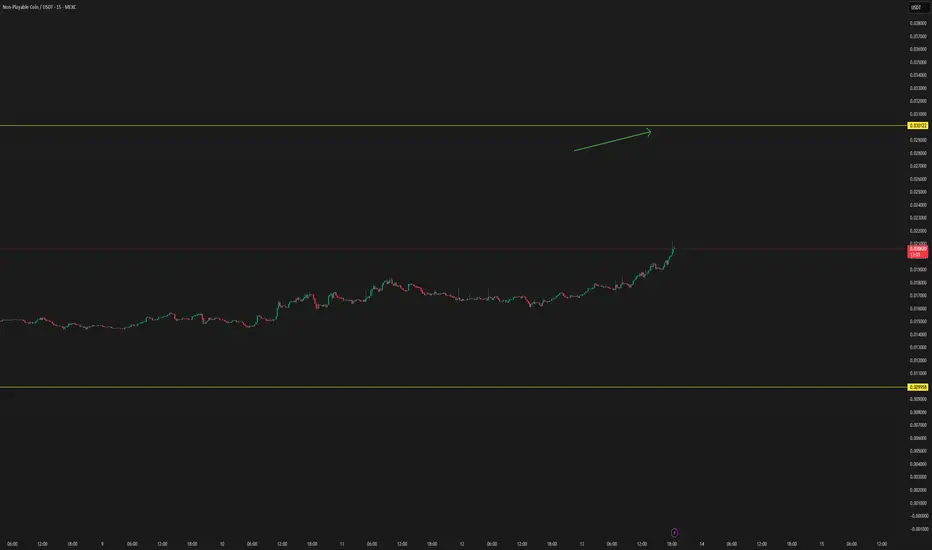
NPC/USDT NEW VOLUME WAVENew volume wave seems to start on this coin, which can get confirmed in the coming hours.
If there is new updates depending on data or volume, the chart will be updated here.
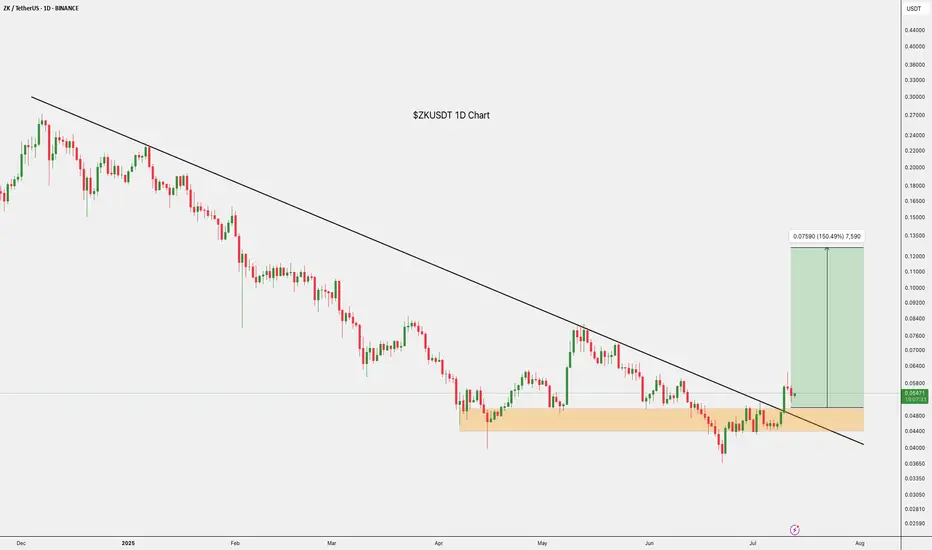
$ZKUSDT Trade Setup 1D ChartBINANCE:ZKUSDT Trade Setup
Entry: CMP
TP 1: $0.07027
TP 2: $0.8028
TP 3: $0.10841
TP 4: $0.12670
SL:- 0.04774
Breakout confirmed.
Hold above the trendline with a bullish bias.
DYOR, NFA
BTC & USDT.D => Bullish Correction Incoming?Hello TradingView Family / Fellow Traders. This is Richard, also known as theSignalyst.
Both BTC and USDT.D are sitting around key rejection zones.
💰 BTC is hovering near the $100,000 level — a major previous low and a psychological round number.
📊 Meanwhile, USDT.D is testing the 5% resistance — a supply zone and another critical round number.
As long as $100,000 holds as support on BTC and 5.1% holds as resistance on USDT.D, we could expect a bullish correction across the crypto market.
What do you think? Will these levels hold or break? 🤔
📚 Always follow your trading plan regarding entry, risk management, and trade management.
Good luck!
All Strategies Are Good; If Managed Properly!
~Rich

100% Win Rate on BTC & Alts! Where’s the Next Breakout?USDT Dominance Update:
While the herd chases the latest hype, we called this before it even unfolded. BTC’s recent surge was lightning-fast.
These were the trades shared in the last 30 days. I'm just saying we could've had more wins!
Our setups didn’t just hit targets…
They exploded through them 🚀
These are spot gains, imagine trading wth leverage with these.
There's more to come in the next week.
✅ MIL:ENA +53%
✅ HOSE:VIC +50%
✅ $CHILLGUY +40%
✅ NASDAQ:HUMA +35%
✅ CRYPTOCAP:XRP +34%
✅ $VOXEL +32%
✅ OMXTSE:MAGIC +30%
✅ CRYPTOCAP:RENDER +25%
✅ CRYPTOCAP:AVAX +24%
✅ SEED_DONKEYDAN_MARKET_CAP:FLOKI +25%
✅ CRYPTOCAP:LINK +17.65%
✅ CRYPTOCAP:SUSHI +17.3%
✅ AMEX:MBOX +15%
✅ $MAVIA +14.7%
✅ TVC:MOVE +11.66%
✅ $EPT +11%
✅ BME:ETC +10.3%
✅ PSX:POL +20%
✅ CRYPTOCAP:SUI +20%
✅ LSE:ONDO +7.5%
✅ SET:PORT +6.17%
✅ CRYPTOCAP:TON +3%
📈 These aren’t just simple trades; they’re alpha-backed calls.
If you’re still watching from the sidelines…
You’re watching others print.
Be patient and precise with your entries and exits. Never FOMO.
The market will bait you into bad timing if you let it.
A 4.4% drop in USDT dominance marks the start of a new altcoin season, but remember, BTC will steer this cycle.
More setups on the way.
Stay tuned.
Do hit the like button and share your views in the comments.
Thank you
#PEACE

$USDT Dominance CRYPTOCAP:USDT dominance just broke down from a key pattern, and that’s a big signal.
It means people are likely moving money out of stablecoins and back into altcoins and Bitcoin.
If this drop continues, we could see a strong altcoin rally soon.
Keep an eye on it, altseason might be around the corner.
DYOR. NFA

MIGGLES/USDT THE BREAK RETURN TO THE MOONMIGGLES/USDT THE BREAK RETURN TO THE MOON
We are following with live data on this coin for the next volume trend, which can have a break in the coming time.
At this moment, this coin is showing signs of an increase. When it gets confirmed, we will follow it with live updates.
