USDT Dominance – Chart Update. USDT Dominance – Chart Update
USDT.D is currently holding an ascending trendline support
A short-term bounce or pullback is possible from this area
Overall structure still shows a bearish bias
Resistance: 6.10% – 6.20%
Major Support / Demand Zone: 5.60% – 5.55%
Rejection from 6.10–6.20% → Positive for altcoins
Break and hold above resistance → Market may turn risk-off short term
USDT Dominance is gradually showing downside pressure.
A clean breakdown below 5.60% could signal a strong altcoin rally.
For educational purposes only. Not financial advice.
Usdtd

USDT Dominance (USDT.D) USDT Dominance (USDT.D)
USDT.D has broken below the rising trendline & short-term MAs, showing weakness in stablecoin dominance.
Current level: ~6.01%
5.6% – 5.8% (highlighted red zone)
This is a critical support. If it fails, downside may accelerate.
Downside Targets (if support breaks):
5.2%
4.8%
Major support near 4.3% – 4.4% (long-term trendline)
Falling USDT.D = money moving from stablecoins into crypto
Supports BTC & altcoin bullish continuation
Higher probability of altcoin momentum if the breakdown continues
USDT Dominance is bearish, favoring risk-on sentiment. As long as it stays below the broken trendline, bullish pressure on crypto remains intact.

USDT.D – 1D Chart UpdateUSDT.D – 1D Chart Update
Structure forming a rising wedge
Rejection near 6.6% resistance
Momentum weakening below trendline
Breakdown scenario: drop toward 4.4%–4.2% zone (marked)
👉 Falling USDT dominance = bullish for BTC & Altcoins
Wait for confirmation. Not financial advice.

USDT Dominance USDT Dominance
Still trading inside a long-term descending channel
Price is at the upper trendline resistance (~6.3%)
Key support: 4.8–5.0%
Rejection from here → Liquidity rotates into BTC & Alts (Bullish)
Break & hold above resistance → Risk-off, alt pressure
👉 Watch rejection vs acceptance at this level
Patience over prediction 📊
DYOR | NFA

USDT Dominance – Chart Update and Analysis. USDT Dominance – Chart Update and Analysis (Weekly)
Current Level: ~6.32%
Structure: Rising Wedge / Long-Term Compression
USDT dominance is trading within a contracting wedge.
The price is approaching the upper trendline resistance (Zone 3).
Previous tops (1 → 2 → 3) show lower highs → upward momentum is weakening.
Rejection near the upper trendline would be bullish for BTC and Altcoins.
Clean breakout + hold above resistance = temporary risk-off / market pullback.
Resistance: 6.4% – 6.7%
Support: 4.8% – 5.0%
Rejection from resistance → relief for Altcoins.
Invalidation: Strong weekly close above the wedge → caution on long positions.
⚠️ Use USDT dominance in conjunction with the BTC chart + TOTAL market cap for confirmation.
This is not financial advice | Manage your risk.

USDT Dominance (USDT.D) – 4H Chart AnalysisUSDT Dominance (USDT.D) – 4H Chart Analysis
Price compressing inside a symmetrical triangle
Ichimoku: Price moving inside / above the cloud → neutral to slightly bullish bias
Major Resistance Zones: 6.45% – 6.60% (strong supply area)
Support Zone: 6.20% – 6.10%
Trendlines are squeezing → volatility expansion soon
Bearish for Crypto (Altcoin Bullish):
Rejection + breakdown below 6.20% → USDT.D drops toward 6.00% / 5.85%
Positive for BTC & Altcoins
Risk-Off / Bearish Crypto:
Break & hold above 6.45% → move to 6.60%+
👉 Pressure on BTC & Alts
Market View
USDT dominance at the decision point. The triangle breakout will define the next market leg.
Best strategy: wait for confirmation, avoid over-leverage.

$USDT Dominance Is it really different this time?CRYPTOCAP:USDT has broken a major resistance across multiple timeframes, showing clear strength.
Technically, this is not a positive sign for CRYPTOCAP:BTC and other altcoins.
Tether has been in an uptrend for the last 75 days. A reversal could be around the corner in Q1 2025, but for now, the structure does not favour the bulls.
This is not FUD; it's simply clear observations based on the chart.
There has been no major altcoin season this year. Every KOL, including myself, has been wrong in calling an altseason so far.
Is it really different this time?
Only time will tell.
Do share your views in the comments and hit the like button if you like it.
Thank you
#PEACE

USDT dominance (USDT.D) USDT dominance (USDT.D) remains elevated and is in a major uptrend, indicating that a significant portion of crypto capital is still parked in stablecoins and in a risk-off position.
Current Structure:
USDT.D is around 5-6%, having broken above a long-term descending trendline that had capped dominance since 2022. This is typically a cautionary signal for risk assets when it remains above that breakout level.
From a technical perspective, USDT.D still appears to be in a large corrective pattern, with significant downside support around 4.2% and 3.8%; losing those levels would confirm a new downtrend in dominance and is usually accompanied by a strong rally in BTC and altcoins.
DYOR | NFA,

Critical USDT.D Test: Altcoin Relief or More Pain?USDT dominance is pushing into its long-term trendline resistance again. If this level rejects, it usually signals fresh money rotating back into altcoins.
But if USDT.D breaks out and holds above the trendline, it could put pressure on alts and slow down their momentum.
This is a key spot for the altcoin market.
DYOR, NFA
Please hit the like button if you like it, and share your views in the comments section.

#USDT.D: My expectations and possible scenarios.This metric is very important. It enables us to determine the overall direction of the crypto market.
The higher the USDT.D, the more cash is flowing out of assets.
Conversely, the lower USDT.D is, the more cash is flowing into assets.
My expectations are as follows:
A further decline in USDT.D will cause the entire crypto market to grow, albeit only locally.
However, there is one caveat: technically, the previous high has not been surpassed. We could easily return to that level and remove it, and only then continue the decline in dominance. Moreover, the Fed is meeting soon, and they may make a similar move by then. However, I am optimistic that the market will show local growth and that USDT.D will continue its downward trend.

USDT.D: Smart Money Indicator for Bitcoin & Altcoin CyclesUSDT.D Dominance: The Hidden Cycle Behind Crypto Bull & Bear Markets (2021–2026)
The USDT.D dominance chart offers a clear window into the underlying market sentiment: when stablecoin dominance rises, the market tends to weaken, and when it falls, risk-on assets thrive.
From late 2021 , USDT.D saw a steady rise, signaling capital flowing out of risk assets . This climaxed in late 2022 , aligning with Bitcoin’s historic drop from $69k to $15k (~-74%).
Following this, USDT.D entered a downtrend and consolidated for over a year, a period that coincided with multiple altcoin bull runs , highlighting the inverse relationship between USDT.D and alt markets.
Recent months have shown breakout dynamics , as USDT.D reclaimed its long-term downtrend resistance. The market now faces a crucial retest around 5–5.1% , which could act as a springboard for the next major rally.
🔹 Market Implications:
Short-term: Bitcoin & Ethereum likely to see significant upward momentum during early 2026.
Mid-term: USDT.D may form a Bullish Cup & Handle , targeting 8–9% by late 2026 , signaling potential market corrections.
Key takeaway: Stablecoin dominance is a leading indicator —tracking its patterns can provide insight into market cycles, risk periods, and optimal entry/exit windows.
💡 Pro Tip: Always combine dominance analysis with price action and volume for better timing in crypto markets.

FireHoseReel | USDT.D 4H Analysis🔥 Welcome FireHoseReel !
Let’s jump into the Tether Dominance Analysis , one of the most Popular Crypto Index .
👀 USDT Dominance – 4H Timeframe
USDT dominance has reached a major resistance level after a very strong upward rally. At this point, I personally have a bearish bias, expecting a rejection and the completion of a multi-timeframe secondary trend. This view is also supported by my mentor, Arshia Azizpour.
📉 RSI Analysis
Since volume isn’t very reliable on dominance charts, we use the RSI oscillator instead.
RSI has just rejected from the 81 zone, which is a strong static resistance inside the overbought area.
This rejection suggests potential cooldown, pullback, or loss of momentum.
📌 Key Levels to Watch
USDT dominance currently has three major levels:
🔺 6.623% – major top resistance
🔸 6.427% – multi-timeframe trend-shift zone
🔸 6.148% – secondary multi-timeframe trend-shift zone
A clean break and candle close below these levels can give us a bearish bias on dominance, which naturally creates a bullish bias for crypto assets.
⚠️ Important Note
USDT dominance still has strong trend momentum.
If it breaks above the current top, it could trigger another wave of downward pressure on Bitcoin and altcoins.
Historically, these dominance spikes hit BTC and ETH the hardest, while altcoins don’t always fall as aggressively.
🛞 Risk Management & Disclaimer
Please remember to always use proper risk management and position sizing. Nothing in this analysis is financial advice. The market can change quickly, so always trade based on your own strategy, research, and risk tolerance. You are fully responsible for your own trades.

Critical Moment for USDT.D, Massive Gap AboveI want to stay bullish since the structure is still bullish with clear lower highs. But if USDT.D climbs all the way up to fill that FVG, where do you think BTC will be trading?

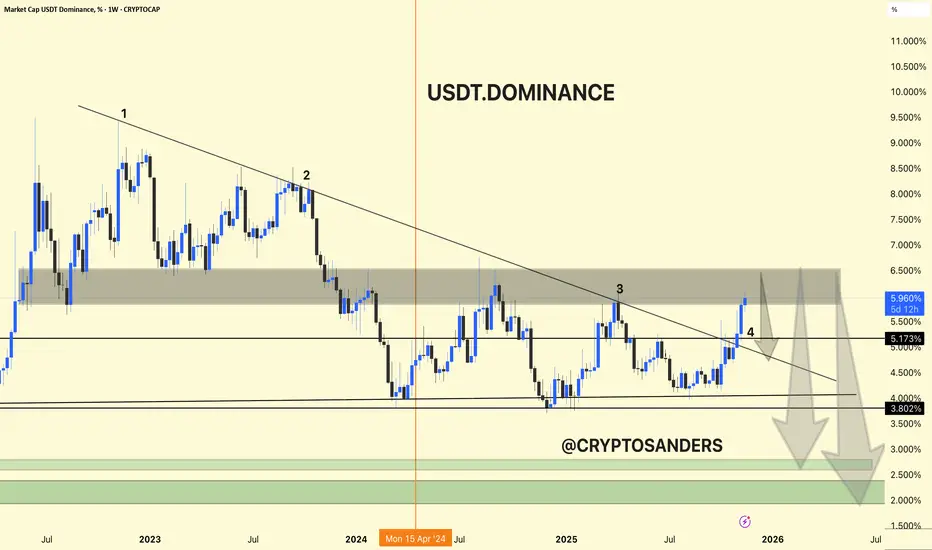
USDT Dominance Weekly Chart Analysis. USDT Dominance Weekly Chart Analysis
USDT dominance has been in a wide downtrend since mid-2022, repeatedly making lower highs along a major descending trendline.
Resistance Test: The dominance index is currently retesting the upper boundary of a key supply zone (5.5–6.2%), where it has previously faced sharp rejections (marked 1, 2, 3, 4).
Breakout Risk: Despite the latest rally, the price shows potential for another rejection at this supply zone, with the trendline acting as resistance.
Downside Projections: If rejected, USDT dominance may head for significant support near 4.0% and then 3.8%, with further targets at the green accumulation zone around 2.5–3.0%. This would suggest capital rotation out of stablecoins and back into crypto assets.
USDT dominance is at a major resistance, historically rejecting this trendline and zone. Another rejection here could mean reduced market fear and capital flowing back into riskier crypto assets. A sustained breakout above 6.2% would signal increased stablecoin preference and ongoing risk aversion.
DYOR | NFA
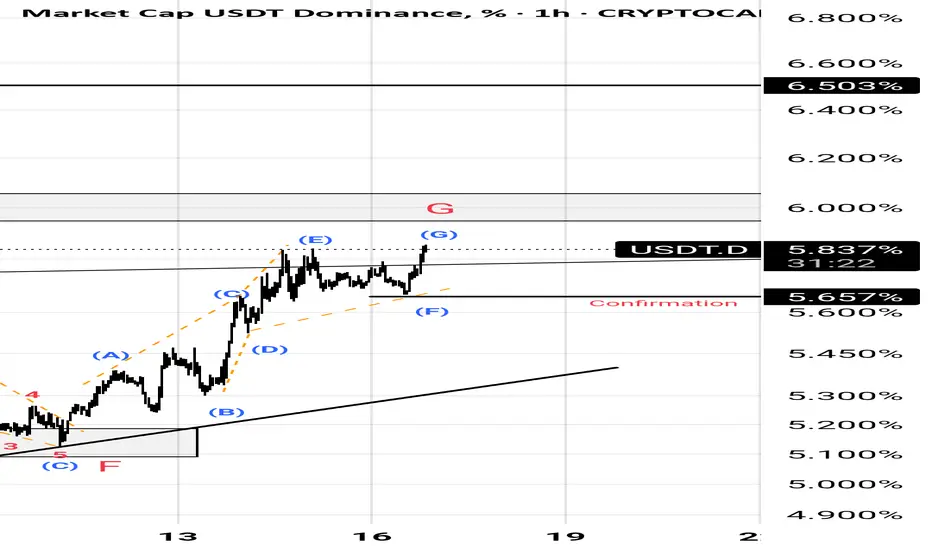
Usdt.d(based on NEo wave)Now 95% of wave G is recognizable and its a bow tie.
Waiting for post pattern confirmation.
#USDT This is the most Crucial Level for ALTCOINS!CRYPTOCAP:USDT is hitting a crucial level right now. How the price reacts here will decide the next market direction.
The blue trendline has been acting as resistance since January 2024, and this level is far more important than most realise.
For now, the best move is to wait and watch how the index behaves over the next few days.
A close above this level could make things ugly, but honestly, I think it’ll get rejected, and the market could go insane in the coming days or weeks.
We’ve already seen maximum pain and liquidation. This is that phase where people are bored and rekt, just before something big happens.
This is just my view; always do your own research.
Invalidation: Close above 5.70%
Let me know what you think in the comments, and don’t forget to hit that like 👍
Peace ✌️
#Altcoins

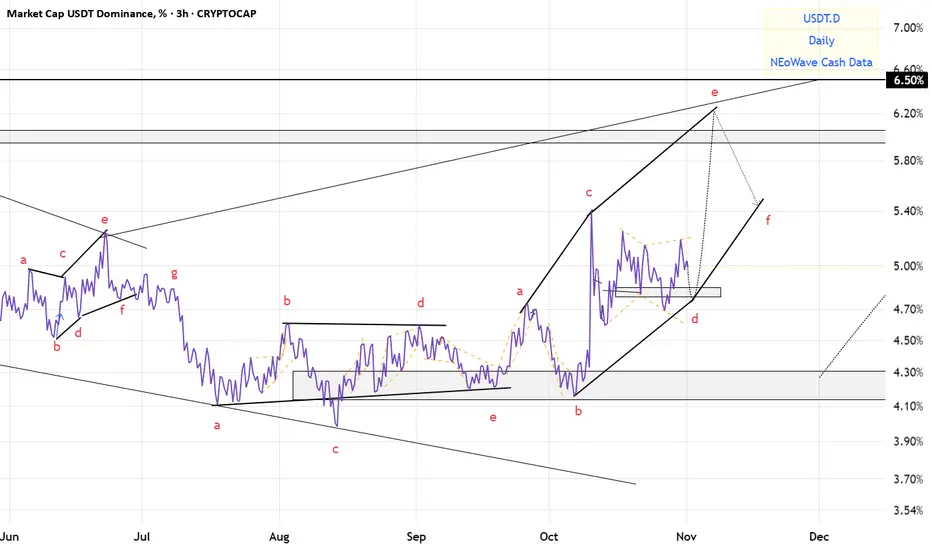
USDT.D(based on NEo wave)I think wave G is showing the pattern.
wave G might be a triangle or a diametric.
Im ready for both scenarios.

Altseason Setup? Dominance Charts Flash Key Confluence!BTC.D & USDT.D Combined Outlook 🧩
BTC Dominance is approaching the 61.8%–62.6% Fibonacci zone, a strong resistance where Bitcoin usually cools off, often leading to a liquidity shift toward altcoins.
USDT Dominance is also heading into the 6% resistance zone, which has historically acted as support for altcoins. A rejection here would signal funds rotating from stablecoins into risk assets, favoring alts.
In short:
If both BTC.D and USDT.D get rejected from their current resistance zones, we could see a strong rebound in altcoins soon. But continued strength in both would keep pressure on alts for now.
DYOR, NFA
Thanks for reading! Appreciate your support and engagement

$USDT.D Cycle Top Indicator HIT !A THIRD CYCLE TOP INDICATOR HAS FLASHED ⚠️
YES this chart is complete chicken scratch, and my mad scientist approach to viewing different trends in USDT Dominance.
I’ve had this November 3rd intersection mapped out for years now.
NO, I do not believe we are anywhere close to the top (see pinned tweet).
Bulls REALLY need to step up big this week with a rally.
We cannot afford two consecutive weeks above 5.5%

USDT.D(based on NEo wave)after this long trading range I think its time to change my counting and its not a triangle.
crypto market will see lower prices and it will continue for 1 month.
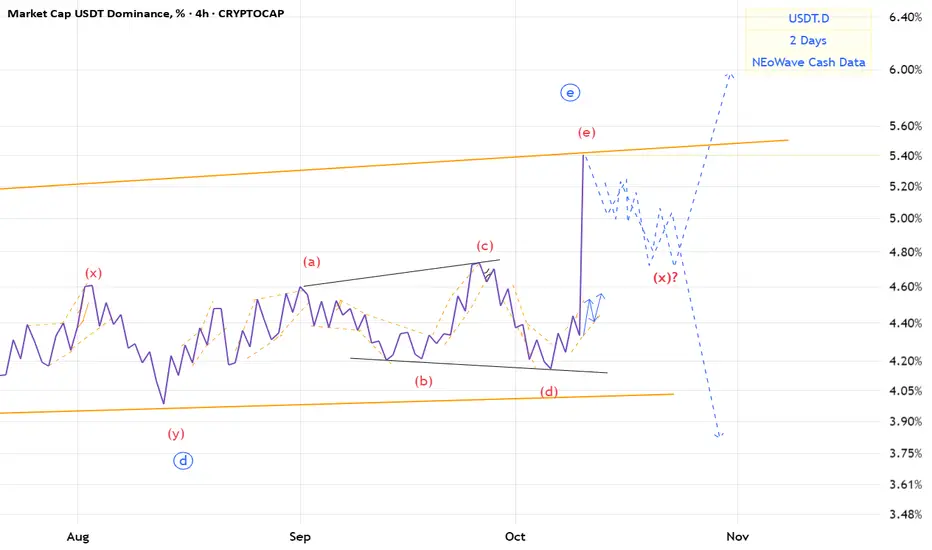
USDT.D(based on NEo wave)The e wave that I wanted made a descending triangle.
we should wait for it becouse it may make an x wave or a post pattern.
USDT.D(based on NEo wave)the bigger degree is a huge triangle and also wave E is a triangle with abcd waves which all are diametrics.
I hope wave e break the curse and change the pattern.
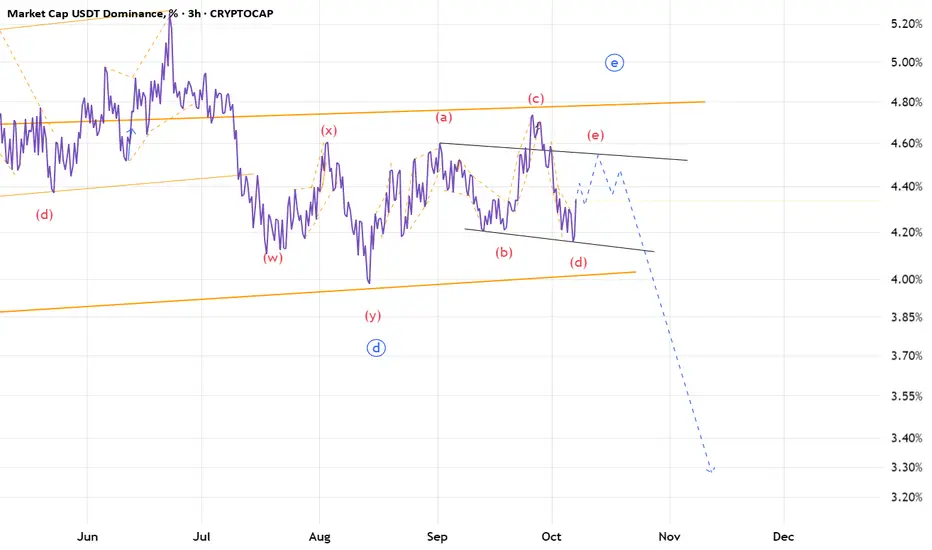
USDT.D - Watch the Blue Zone: Break = Bullish for CryptoUSDT dominance ripped into the 4.55–4.60 supply and stalled. Price is hovering on the blue support zone at 4.44–4.48.
This area is key 🔑. If the blue zone breaks down and holds below 4.44–4.48, that’s bullish for crypto (alts + BTC) as dominance rotates lower toward 4.30–4.25, even 4.22.
If the zone holds and 4.60 is reclaimed, dominance can push higher and keep pressure on risk assets.
What’s your plan => wait for a confirmed break of the blue zone to flip risk-on, or fade the first rejection at 4.60? 🤔
⚠️ Disclaimer: This is not financial advice. Always do your own research and manage risk properly.
📚 Stick to your trading plan regarding entries, risk, and management.
Good luck! 🍀
All Strategies Are Good; If Managed Properly!
~Richard Nasr
