US500 retreated on a hawkish Fed shift and a tech-sector fall
September nonfarm payrolls rose by 119k (cons. 51k), but August was sharply revised down to -4k from 22k, while continuing jobless claims increased by 28k from the prior week. The unemployment rate climbed to 4.4% (prev. 4.3%, cons. 4.3%), the highest in four years, further weighing on sentiment.
Fed commentary added to the pressure. Cleveland Fed President Mester noted that, despite signs of labor-market cooling, inflation remains elevated. Chicago Fed President Goolsbee also cautioned that inflation has not yet reached the 2% target, signalling reluctance toward additional rate cuts.
Today’s PMI and consumer expectations data will be key indicators of current US economic conditions.
US500 broke below the lower boundary of the ascending channel, extending its sharp decline. The diverging bearish EMAs indicate a potential continuation of the downtrend.
If US500 breaks below 6500, the index could retreat toward the next support at 6430.
Conversely, if US500 closes above 6650, where EMA21 intersects, the index may advance toward the following resistance at 6700.
Usindices

AI-bubble fears dragged USTEC lower.
Alphabet (GOOGL) CEO Sundar Pichai added to the cautious mood, noting that the current AI boom shows signs of irrationality and warning that no company would be immune if the bubble bursts.
Meanwhile, ADP data showed private-sector jobs falling by roughly 2.5k per week over the four weeks to Nov 1, fueling worries about a labor-market slowdown. Fed Governor Waller reiterated his support for a December rate cut, citing ongoing softness and stagnation in the labor market.
This week’s NFP release may shape expectations for further Fed easing and add to market volatility.
USTEC extended its downtrend, breaking below 24525. The diverging bearish EMAs indicate a potential expansion of the bearish structure.
If USTEC breaks below 24300, the index could decline further toward the next support at 24000.
Conversely, if USTEC closes back above 24525, the index may advance toward the next resistance at 25200.

US500 slipped on AI-bubble fears and the Hawkish Fed
Stocks weakened last week as the Fed’s revived hawkish tone and mounting concerns over stretched AI valuations outweighed strong earnings from major AI names.
Despite upbeat 3Q results, fears of an AI bubble continued to build. AMD CEO Su highlighted insatiable demand for AI chips, projecting the data-center market to reach 1tln USD by 2030 and forecasting an average annual growth rate of 35% for AMD over the next five years.
Morgan Stanley warned of an impending power shortage within a year as AI expansion accelerates. while Microsoft CEO Nadella pointed out that the biggest bottleneck is not compute capacity but power, noting that parts of the company’s GPU inventory lack sufficient power connectivity.
US500 briefly retested the support at 6650 before rebounding. EMA21 has death-crossed EMA78, indicating a potential shift toward a bearish structure.
If US500 fails to close above the support at 6700, the index could retreat toward 6650. Conversely, if US500 breaches above both EMAs and the resistance at 6800, the index may advance toward the following resistance at 6920.

The S&P500 paused on AI valuation concerns and trade fears
The US equity rally, driven by optimism over AI momentum, Fed rate-cut expectations, and solid consumer data, lost steam after President Trump’s combative remarks toward China. Delta Air Lines beat 3Q estimates with profit up 4.1% YoY and EPS at 1.71 USD, while Costco’s (COST) Sep sales rose 8% YoY, underscoring resilient US consumption. However, Trump’s threat of steep tariff hikes triggered the S&P; 500’s sharpest one-day drop in three months.
US500 extended its sharp decline, briefly testing the support at 6530. The index broke below the ascending channel's lower bound, suggesting a potential shift toward bearish momentum. If US500 breaks below the support at 6530 again, the index may retreat toward the next support at 6420. Conversely, if US500 breaches above EMA21 and the resistance at 6700, the index may advance toward the psychological resistance at 6800.

Despite AI valuation pressures, US500 outlook remains positive.
Robust US data tempered Fed rate-cut bets, dragging equities lower for a third day, though investors expect the pullback to be short-lived. Nvidia’s (NVDA) 100 bln USD investment in OpenAI has raised questions over vendor financing risks, deepening worries over elevated valuations. Still, institutions expect US equities to hold a tactical bullish stance. JPMorgan (JPM) projected that while a government shutdown and fragile sentiment may trigger midweek weakness, solid economic growth, a resilient labor market, and AI momentum could drive the S&P; 500 to 7,000 by year-end.
US500 remains within the ascending channel, sustaining its steady uptrend. After briefly testing EMA21 and the channel’s lower bound, the index rebounded, indicating the potential extension of a bullish structure. If US500 continues to hold within the channel, the index may gain upward momentum toward the resistance at 6700. Conversely, if US500 breaks below the channel’s lower bound and EMA21, the index could retreat toward the support at 6530.

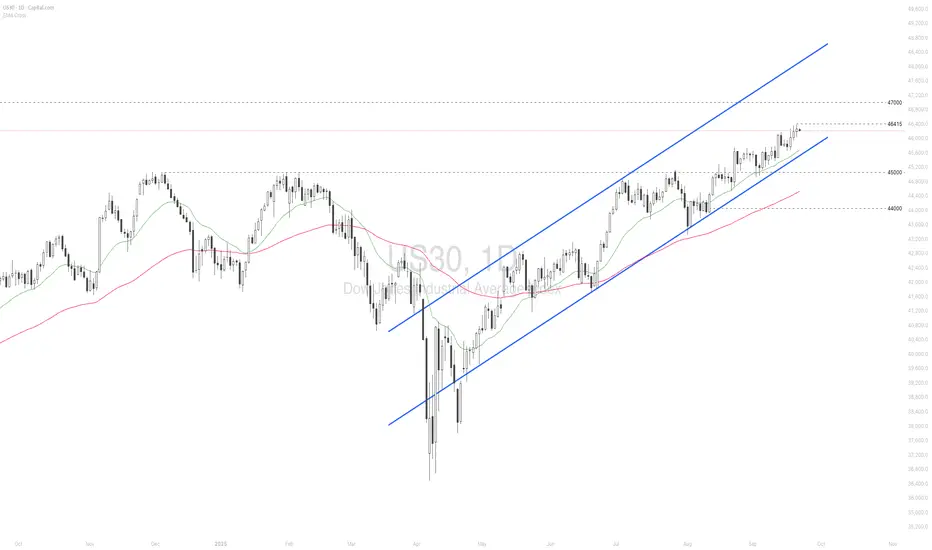
US30 hits new all-time high amid robust AI fever
US equities rallied to fresh record highs, fueled by the Fed’s rate cut, resilient US economic data, and optimism over progress in US-China trade negotiations. Ongoing enthusiasm for AI also boosted technology stocks.
Nvidia (NVDA) drove the strongest market reaction after announcing a \$5 bln purchase of more than 4% of Intel (INTC). Sentiment was further buoyed by reports that Chinese regulators halted their antitrust probe into Google (GOOGL), ending a long-running investigation into Android’s dominance.
US30 maintained a solid uptrend within the ascending channel, setting a new high. The index holds above both EMAs, indicating the potential continuation of the bullish momentum. If US30 breaches above the 46415 high, the index may gain upward momentum toward the psychological resistance at 47000. Conversely, if US30 breaks below EMA21 and the channel’s lower bound, the index could retreat toward 45000.
Nasdaq100, DJIA & S&P500 - Quick technical analysisThe top three US indices are near their all-time highs. Will we see new all-time highs?
Let's take a look.
MARKETSCOM:US100
MARKETSCOM:US30
MARKETSCOM:US500
Let us know what you think in the comments below.
Thank you.
75.2% of retail investor accounts lose money when trading CFDs with this provider. You should consider whether you understand how CFDs work and whether you can afford to take the high risk of losing your money. Past performance is not necessarily indicative of future results. The value of investments may fall as well as rise and the investor may not get back the amount initially invested. This content is not intended for nor applicable to residents of the UK. Cryptocurrency CFDs and spread bets are restricted in the UK for all retail clients.

Rate-cut optimism fueled risk-on mood, lifting US equities
July CPI showed little inflationary impact from tariffs, amplifying expectations for a September Fed cut. Optimism also returned for small-cap firms, previously seen as most vulnerable to tariff pressures. Headline CPI rose 2.7% YoY in July, 0.1% lower than a year earlier, with a 1.1% MoM drop in energy prices contributing to the overall decline.
BlackRock CIO Rick Rieder noted that shelter costs, the largest CPI component, slowed to their lowest since 2021, significantly boosting the odds of a September cut. He added that the Fed could take a more aggressive approach, with a 50bp cut at the September FOMC.
USTEC extended its sharp uptrend after breaching above the 23700 high. The widening gap between both EMAs indicates the potential continuation of bullish momentum. If USTEC holds above 23700, the index may gain upward momentum toward the psychological resistance at 24000. Conversely, if USTEC breaks below 23700, the index could retreat toward 23300.

Russell 2000 - C wave to complete correction?I have been bearish on the Russell for a long time. nothing has changed. the wave count is getting clearer... at least for now.
price action as of late has been like watching paint dry on the wall, still waiting for a catalyst... coming soon, i believe.
this count would only be invalidated with a sustained break above resistance zone.
**minor change from my previous charts - i have simplified the wave counts from a (WXYZ) to (ABC).

Russell 2000 - Sell till late May & Buy in Early June?
Wave (ii) is still in progress. Slight update to the primary wave count from the previous one below.
200 & 100 SMA's are sloping firmly to the downside therefore I will continue to keep selling at technical levels. Late May or early June would be a good time to go long...
Support levels are shown in green.

Russell 2000 - one more drop to complete the correction?Looking for the double zig zag correction to complete (Y) leg in the blue zone. Will be looking for five waves to the downside for the target.
Updated the wave count from my previous chart below...
This drop from the 25th November 2024 to the expected target zone would be more or less similar to the Covid drop in terms of percentage.

Russell 2000 - time to Buy pullbacks...Shorts were good while it lasted... looks like a good time to buy pullbacks.
It would be wise to wait for a clear 3 wave correction though.
Elliot Wave Analysis shows a larger degree wave IV was completed in March 2020.
Since then, the Russell 2000 has been nesting within a bullish rectangle chart pattern, possibly working its way up to the larger degree wave V.
Seasonality Chart shows a bullish April with a possible correction in May.
Nevertheless, I will not commit to long trades till the chart clearly shows that we are out of the woods. A clear 3 waves move down closer to 1800 in the hourly/4 hourly time frame would be a good setup.

The Nasdaq 100 nears a big breaking pointThe Nasdaq 100 has continued declining, attempting to find some support after breaking below the August 2024 lows on 4 April. The next obvious support levels lie around the late 2021 and 2022 highs, which, for now at least, are offering some stability. It would not be surprising to see the index test that region during the trading session.
However, a break below support at 16,700 could be a negative signal for the Nasdaq, suggesting the index may head even lower. The next level of technical support would not appear until the July 2023 highs at 15,750. If that level breaks, the next area of support lies at the October 2023 low of 14,100, effectively erasing all gains made over the past 18 months.
The problem for the Nasdaq is that several areas on the chart will likely offer little to no support should it break under its 2021 highs, with numerous lower gaps remaining unfilled. This suggests the potential for further declines, which could extend to the 1.618% level around 14,510, especially as we’ve only seen a full extension of the initial bear flag so far.
If the Nasdaq can find support at the November 2021 highs, there is room for a rally back to 17,265, which marks the August lows, and potentially further to 18,360. However, a complete reversal back to the previous highs seems highly unlikely, given that the market may now reprice risk and reassess how much it is willing to pay for it.
Written by Michael J Kramer, founder of Mott Capital Management
Disclaimer: CMC Markets is an execution-only service provider. The material (whether or not it states any opinions) is for general information purposes only and does not take into account your personal circumstances or objectives. Nothing in this material is (or should considered to be) financial, investment or other advice on which reliance should be placed.
No opinion given in the material constitutes a recommendation by CMC Markets or the author that any particular investment, security, transaction, or investment strategy is suitable for any specific person. The material has not been prepared in accordance with legal requirements designed to promote the independence of investment research. Although we are not specifically prevented from dealing before providing this material, we do not seek to take advantage of the material prior to its dissemination.

S&P500 - Possible Short Term Top in. OANDA:SPX500USD is looking like its in the end of the move higher. Thursday/Friday were very slow after the early week rally even with NFPs giving things a spike.
now we look for Monday to give us some clues for the next move.
Option 1 - We get a move down to 5320 before one more high up to 5400 area.
Option 2 - The top is in on this run from the April low and we get a deeper PB down towards 5200 followed by another ATH around 5500.
Option 3 - But less likely, it holds Fridays lows and we get one more run up to 5400 then a deeper correction.
Things to watch going into this week with Inflation data Wednesday/Thursday and the next Interest rate decision out of the US Wednesday were they are expected to keep things at the same level.
I will also post expected intra-day movements throughout the week.
Enjoy the week, watch for Monday clues.

DOW JONES - Completed Pattern. OANDA:US30USD While the OANDA:SPX500USD & OANDA:NAS100USD have been hitting new highs the DOW has struggled and has completed a Double ABCD Gartley pattern on friday and sold off into the close.
Setting up potential downside targets of 38300, 37800 & to complete the bigger pattern @ around 37k.
If we start heading lower on Monday then that could put the wheels in motion for the bigger correction.
Big data out mid week will send it one way or the other.
Enjoy the week.
I will post shorter time frame areas to watch with potential intraday turns points.

Dow Jones Industrial Averages Weekly Technical Analysis(1) We have witnessed a sharp fall from 29,500 level in Feb’20. This was almost 38% fall from the top. Market had gone in a oversold zone.
(2) Around 18,300 level, price found a support and bounced back from this level.
(3) With an upside rally, price managed to breakout its previous resistance.
(4) After the breakout, we have seen a sharp upside rally further and the price reached at 36,950 level.
(5) A corrective decline has been seen from there and the price started making lower highs and lower lows at reached to 28,800 level.
(6) Price again bounced back from there and gave a upside move.
(7) In this entire consolidation phase, a Cup & Handle chart pattern has been formed, which gave us positive indication.
(8) With a strong breakout of the Cup & Handle pattern, price started its journey upside.
(9) Currently the price is standing near its All Time High. More upside move is expected from here.

Whats Next for NAS?NAS makes a balanced range on the 4H chart, we are now at the extreme boundary of it, we are now either going to see mean reversion back to 17800 or a break higher towards 19k! will post an update into next week.

S&P 500 H4 / Bearish Market Structure Idea ✅Hello Traders!
This is my idea related to S&P 500 H4. I would like to see another ATH set, and after that, I will look for a short entry. I expect that the S&P 500 will reach the resistance level, and if confirmed, I will execute a short trade. I will look for a short entry in the smaller time frame. The target is the FVG at the price of 5000-4980.
Traders, if my proposal resonates with you or if you hold a divergent viewpoint regarding this trade, feel free to share your thoughts in the comments. I welcome the opportunity to hear your perspectives.
____________________________________
Follow, like, and comment to see my content:
www.tradingview.com

US500 M15 / Expecting a rise until the price of 5000 💲Hello traders!
This is my idea related to the US500 M15. The sellers' sentiment is still strong, and I expect a new ATH until the price of 5000 after that, I will look for a shot trade entry.
It represents a good opportunity to look for a long trade entry.
Traders, if you liked my idea or if you have a different vision related to this trade, write in the comments. I will be glad to see your perspective.
____________________________________
Follow, like, and comment to see my content:
www.tradingview.com

US100 M30 / Short Trade Opportunity on US indices ✅ Hello Traders!
This is my Idea related to UA100. I expect a bearish move if confirms the breakout of the mentioned BOSS. It also will be a sign of a bearish market structure.
I expect that FVG H1 will be closed, this area represents also my target.
Traders, if you liked my idea or if you have a different vision related to this trade, write in the comments. I will be glad to see your perspective.
____________________________________
Follow, like, and comment to see my content:
www.tradingview.com

US30 H1 / TWO POINTS OF INTEREST / POSSIBLE SCENARIOS FOR LONG✅Hello Traders!
This is my idea related to US30 H1. I see two possible scenarios where I will look for a long entry in case of confirmation of retracement.
You can see two resistance zones from where I expect US30 will go bearish. In case of confirmation of retracement from the resistance zones, I will execute long trades until the price of 37760.
Traders, if you liked my idea or if you have a different vision related to this trade, write in the comments. I will be glad to see your perspective.
____________________________________
Follow, like, and comment to see my content:
www.tradingview.com

US Indices: Possible Short AreasI'm looking for a short across the US stock market. Possible market alignment on marked s/r zones. Not a bad idea to check DXY too before opening a position.

Wave 3 in S&P500 materials indexThe S&P 500 Materials index set out an impulse move(1) in October last year and completed the up move move by Jan 2023.
The index thereon was in a corrective phase throughout most of the current year until recent oct. low.
The correction according to Elliot wave model can be categorized as a "flat". The constantly rising dollar index can also be linked to the underperformance of this sector throughout 2023.
The projected wave 3 target for the index should be(min.) close to 600 zone(20% from current levels).
Note*- This is not a buy/sell advice. The chart is for educational purpose only.
