QQQ Weekly Outlook – Week 4 of 2026 (Jan 26–30)QQQ Weekly Outlook – Week 4 of 2026 (Jan 26–30)
Technical Look
QQQ moved exactly as expected on the bearish side, hitting its downside targets with the Tuesday open last week and finding a bounce from those levels.
In the Mid Week Update I shared afterward, I highlighted that the structure had shifted into a bullish phase and that price was now more likely to target higher levels. I’m also linking last week’s outlook on the side for reference.
Scenarios – Prediction
Scenario 1: Bullish Scenario (Likely)
With the current bullish structure established during the week, I expect price to continue higher and potentially target all time highs. Overall bullish sentiment remains strong, which makes this continuation reasonable.
That said, risks remain on the table. Escalation around Iran or a potential 100% tariff on Canada could quickly flip market structure back to bearish, so staying cautious is important.
This bullish scenario can play out in two ways:
1-A direct gap-up open followed by continuation toward bullish targets
2-A pullback toward the 687 area, a brief deviation, then a bounce with a strong close above that level, leading to higher targets
Bullish scenario targets:
626 – 629.5 – 636.5
Scenario 2: Bearish Scenario
Geopolitical tension around Iran or a potential tariff shock could still trigger a bearish shift, keeping this scenario in play.
A strong break and close below 618.5 would activate the bearish scenario for me. On any retest, price should fail to reclaim and close back above 618.5. If that happens, I would look to actively trade this scenario using puts.
Potential bearish targets:
607 and 599.5
Position Management Notes
I manage risk by scaling out of positions at key reaction levels and adjusting exposure as structure confirms. Partial profit taking at major levels is a core part of my approach.
I share deeper SPY-QQQ breakdowns and weekly scenario updates on Substack. Link is in my profile.
This analysis is for educational purposes only and reflects my personal opinion. It is not financial advice.
Ustech

QQQ Mid Week Update (22-23 JAN)QQQ Mid Week Update
Technical Look:
Price opened with a strong breakdown, exactly as I expected in my Weekly Outlook from Sunday. After the initial move, we got a retest, and price continued lower into the bearish target. (Checked the linked idea.)
Then before the market close, Trump’s tariff cancellation comments shifted sentiment, and the structure flipped back to a bullish setup.
With Wednesday’s close, QQQ has fully transitioned into a bullish structure. Price action confirms that the bullish scenario is currently active and in control.
As long as there is no major sentiment shift (such as a cancellation of the Greenland deal), I expect the market to maintain its bullish structure.
Given the current momentum, price may reach upper targets relatively quickly.
Bullish Scenario (Active):
As long as the bullish structure remains intact, I expect price to continue higher.
Upside targets:
Target 1: 630
Target 2: 637
If price breaks the 610 level aggressively due to a sentiment shift, this bullish idea would be considered invalidated.
Bearish Scenario (Unlikely):
A bearish scenario would come into play only if Trump reintroduces EU tariff rhetoric and signals that the Greenland deal has been canceled.
In that case, a decisive break below 610 would open the door for put positions, and a downside continuation could follow.
The first downside target in this scenario would be 600.
I share deeper US Market breakdowns and weekly scenario updates on Substack. Link is in my profile.
This analysis is for educational purposes only and reflects my personal opinion. It is not financial advice.

USTEC | Symmetrical Triangle pattern | Wait for BreakoutMacro theme:
- Headlines this Jan are dominated by geopolitical friction, specifically the US-Eurozone trade tensions over Greenland, painting a picture of imminent fragility. However, a rigorous look at the latest data reveals a stark disconnect between news-flow and economic reality.
- While the market frets over potential tariff wars, the fundamental macro backdrop has quietly settled into a "Goldilocks" zone. Despite the alarming rhetoric, the data points to a resumption of steady global GDP growth and continued disinflation in 2026.
- We are witnessing a classic divergence between perceived risk and actual economic health.
. Growth is Robust: Far from a recession, Oxford Economics has actually raised its 2026 US GDP forecast to 2.8%, the top end of the forecaster range, driven by AI-related investment and productivity gains.
. The "Worst-Case" isn't Fatal: Even if the US-Eurozone trade dispute escalates to a full "trade war" (currently a 20% probability), modelling suggests a hit to US GDP of only 0.5%. The economy would remain resilient, with growth at ~2.3%.
- Credit Conditions are Green: The proprietary credit conditions index has turned positive for the first time since late 2021, signaling ample liquidity.
- For asset allocators, retrenching into cash due to headline fear is likely over cautious. The strategy now requires precision, not retreat.
Technical approach:
- USTEC is consolidating within a broader range. The index bounced off EMA78 on retest and closed above EMA21. The index is still in a sideways phase captured by a Symmetrical Triangle pattern, awaiting an apparent breakout to determine the next trend.
- If USTEC breaches above the Symmetrical Triangle and the resistance at 26100, the index may surge to test the 100% Fibonacci Extension at 26620.
- On the contrary, remaining below 26100 may prompt a retreat toward the support at 25150.
Analysis by: Dat Tong, Senior Financial Markets Strategist at Exness

QQQ Weekly Outlook – Week 3 of 2026 (Jan 19–23)QQQ Weekly Outlook – Week 3 of 2026 (Jan 19–23)
Technical Look:
Last Monday, price pushed into 629.25, which I marked as Bullish Target 1 in last week’s outlook, but failed to secure a close above that level. As mentioned in my Sunday outlook, with CPI scheduled for Tuesday, I did not expect sustained upside continuation beyond those levels before the data release.
QQQ tapped 629.25, failed to hold above it, and began its retracement exactly as anticipated.
Since QQQ was the stronger index relative to SPY, it found support earlier and did not need to reach its full downside target at 610.25. SPY had already reached its key support zone, which allowed QQQ to stabilize sooner.
(Please refer to the linked idea for visual confirmation.)
Scenarios – Prediction:
At this stage, I am tracking two potential scenarios.
Scenario 1: Bearish Scenario (Higher Probability)
This is currently the more likely scenario due to the macro environment, particularly Trump–EU tensions and potential EU tariffs related to Greenland.
I believe price may open the week with a sharp downside move.
My bearish targets are:
614.5 – 610.25 – 599.5
If price breaks 614.5 decisively and closes a 4H candle below it, I would expect a move toward 610.25.
Likewise, if 610.25 is broken aggressively and holds below, price could extend toward 599.5.
Each of these bearish targets also represents a potential bounce or reversal zone, so I prefer taking partial profits (around 1/3) at each level.
If price breaks 614.5 decisively, I would look to engage on the short side using put options.
Scenario 2: Bullish Scenario
This scenario becomes valid only if Trump–EU tensions ease before the market opens (with Monday being a holiday and trading resuming on Tuesday).
The 626 level acts as a call wall in options positioning for QQQ. If price breaks above 626 aggressively, I would look to buy calls on a retracement, targeting 629.5 and 636.5.
Position Management Notes:
I rely on confirmation-based entries around key levels. Once in a position, I manage risk by taking partial profits at reaction zones and adjusting exposure as price structure develops.
I share deeper US Market breakdowns and weekly scenario updates on Substack. Link is in my profile.
This analysis is for educational purposes only and reflects my personal opinion. It is not financial advice.

CrowdStrike undecidedCRWD seems rather undecided whether to follow through with ist corrective path or whether to make new highs. However, we still assign only a 36% probability that the high for wave alt. in green may already be in place; this alternative scenario would be confirmed by a drop below the support level at $402.66.
For now, though, our primary outlook allows for further upside, with the potential for green wave to complete above the resistance at $517.98—and possibly above the current all-time high of $566.90.
Regardless of which scenario unfolds, a move down to the green target zone (ranging from $114.02 to $33.73) appears likely—either sooner (in the alternative scenario) or later (in the primary scenario)—to complete the larger wave II correction.
Once this significant low is established, we expect the stock to move toward new record highs as part of a beige wave III to follow.

Nasdaq crashes but recovering: Buy the dip or sell the break?The NASDAQ has taken a serious hit, dropping 1.6% to test 25,280 after failing to break the double top at 25,900. The market is caught in a crossfire of 25% AI chip tariffs, China export bans, and tensions in Iran. But technically, we might be forming an ascending triangle that suggests a breakout to 27,500 is still possible.
Read as we analyse the clash between bearish headlines—US-China escalation and the Iran crisis—and bullish technicals. We break down the ascending triangle pattern with higher lows at 23,860, 24,660, and now 25,170, and explain why the 50 RSI reset on the daily chart could signal a perfect "buy the dip" opportunity.
Key topics covered:
Trade war escalation: How 25% tariffs on AI chips and China’s retaliatory bans on dual-use items and cybersecurity companies are hitting tech giants.
Iran tensions: The impact of Trump's remarks and their effect on investor confidence and "risk-off" sentiment.
Technical setup: The critical ascending triangle formation. A hold at 25,200 keeps the bullish bias alive for a measured move to 27,500 (100% Fib extension).
Two scenarios:
Bullish : De-escalation in Iran/trade war + triangle hold = breakout to 26,500 and 27,500.
Bearish : Escalation + break below 25,200 = failure of the triangle, targeting 24,650 and lower.
Are you buying the triangle dip or shorting the double top? Let us know in the comments!
This content is not directed to residents of the EU or UK. Any opinions, news, research, analyses, prices or other information contained on this website is provided as general market commentary and does not constitute investment advice. ThinkMarkets will not accept liability for any loss or damage including, without limitation, to any loss of profit which may arise directly or indirectly from use of or reliance on such information.

SPY Weekly Outlook – Week 2 of 2026 (12-16 JAN 25)SPY Weekly Outlook – Week 2 of 2026
Technical Look:
Price followed the bullish scenario from last week’s SPY outlook, and the expectation played out as planned. I’ve shared the linked idea below so you can clearly review the expectation versus the actual price action.
SPY is currently trading around the area where it has just printed new highs, and attempting to predict price flow ahead of CPI carries elevated risk.
Scenarios – Prediction:
Pre-CPI / Range Expectation:
With CPI data scheduled for Tuesday, market direction is likely to become clearer after the release. For Monday, my base expectation is a range bound session.
If SPY attempts an upside move ahead of CPI, the level I am watching for a potential early expansion is 700. However, I would expect a retracement after a move into the 700 area, rather than immediate continuation. For this reason, 700 remains my primary bullish target ahead of CPI.
Bearish Scenario (CPI-driven):
If CPI data comes in bearish for risk assets, I will be watching the following support zones for a potential reversal or bounce:
687.5 – 679.75 – 669.50
I expect price to react at these levels. For a bullish reversal confirmation, price must tap one of these zones and then close a daily candle above it. This daily close would be my confirmation trigger.
Bullish Scenario (CPI-driven):
If CPI data comes in bullish, I expect price to target the 700 level first.
If 700 is broken decisively, with a daily close above the level, I would expect price to continue higher toward upper levels. Call positions can be considered only after this confirmation.
Position Management Notes:
During high impact macro weeks, I focus strictly on confirmation based entries. Once in a position, I manage risk by scaling at key reaction zones and adjusting exposure based on daily market structure.
I share deeper US Market breakdowns and weekly scenario updates on Substack. Link is in my profile.
This analysis is for educational purposes only and reflects my personal opinion. It is not financial advice.

QQQ Weekly Outlook – Week 2 of 2026 (12-16 JAN 25)QQQ Weekly Outlook – Week 2 of 2026
Technical Look:
Price followed last week’s bullish scenario from my previous weekly outlook, and the expectation played out as planned. I’ve shared the linked idea below, where you can clearly review the expectation versus the actual price action.
QQQ is currently trading near a resistance zone and finished Friday’s session in a position that allows for a potential bullish continuation.
Scenarios – Prediction:
Bullish Scenario:
If price continues higher, my bullish targets are:
629.25 – 636.5
However, since the market is likely waiting for the CPI data release on Tuesday, one or both of these targets could be reached through an early expansion on Monday, but I do not expect sustained upside continuation beyond those levels until CPI is released.
Because price is near resistance and close to all time highs, I do not expect Monday to be very active. In my view, a cleaner market structure is more likely to form after Tuesday’s CPI data.
If CPI comes in supportive and price breaks and closes strongly above 636.5, we could see a bullish expansion that continues throughout the rest of the week.
Bearish Scenario:
If CPI data comes in bearish (higher than expected inflation), I expect a short term bearish move.
In that scenario, the key support zones where price may find a bounce or reversal are:
610.25 – 599.50
Trades should only be taken with confirmation at these levels. If price taps one of these zones and closes a daily candle above it, I would look to engage in bullish call options.
Position Management Notes:
I prefer confirmation-based entries around key levels. Once in a position, I manage risk by taking partial profits at reaction zones and adjusting exposure as price structure develops.
I share deeper US Market breakdowns and weekly scenario updates on Substack. Link is in my profile.
This analysis is for educational purposes only and reflects my personal opinion. It is not financial advice.

QQQ Weekly Outlook – Week 1 of 2026QQQ Weekly Outlook – Week 1 of 2026
Technical Look:
Price moved exactly as planned in my December 21 Weekly QQQ outlook (you can check the linked idea). The market bottomed on December 17, as anticipated in my December 14 Weekly QQQ prediction, and then started to move higher. Price reached both of my targets and began retracing from those levels. (Please refer to the linked post for details)
Currently, QQQ is retracing from the highs and appears to be seeking additional liquidity and energy before any continuation higher. This consolidation phase may take longer than initially expected.
Scenarios – Prediction:
Scenario 1: Bullish Scenario
I am looking for price to break and close above the 614.5 level on the 4H timeframe.
A confirmed 4H close above 614.5 would indicate that the bullish scenario is in play, and I would consider engaging on the long side.
Potential upside targets for this scenario:
621.75 – 629.5
Scenario 2: Bearish Scenario
If price fails to break above 614.5, I would consider that QQQ is shifting into a bearish flow and seeking lower prices. In that case, I would look to engage on the short side.
Downside targets for this scenario:
610 – 606.25 – 600 – 588.5
The 588.5 level represents the most extended bearish scenario. If price breaks 600 aggressively , I would then expect a move toward 588.5.
Position Management Notes:
Each target level may trigger significant pullbacks or reversals. Personally, I take partial profits at these levels and keep the remaining position open toward the next targets, while trailing the stop loss to breakeven. This is how I manage my positions.
I share deeper US Market breakdowns and weekly scenario updates on Substack. Link is in my profile.
This analysis is for educational purposes only and reflects my personal opinion. It is not financial advice.

APPL (APPLE) BUY IDEAAPPL (APPLE) BUY IDEA
📊 Market Sentiment
Market sentiment is bullish, driven by expectations of the FED’s potential rate cut in December. In addition, Trump’s likely nominee for the new FED Chair is Kevin Hassett a strong supporter of aggressive rate cuts.
This possibility has pushed markets higher as participants began pricing in earlier and more aggressive cuts for 2026.
📈 Technical Analysis
AAPL remains one of the most bullish stocks in the U.S. market. All higher timeframes are strongly bullish.
We are currently seeing a retracement from recent all time highs, which in my opinion is simply a healthy pullback to build momentum for higher prices.
📌 Game Plan
I have two key Points of Interest for potential long entries. Both support a bullish continuation thesis, and I do not expect a major bearish shift for AAPL anytime soon.
Scenario 1:
Price taps 276.25 and bounces.
I will wait for a daily bullish close to confirm the continuation.
Scenario 2:
Price dips into 271 and bounces.
I will again look for a daily bullish close as confirmation.
Note:
The FED’s rate decision will be released on Wednesday at 2 PM.
Until then, I expect price to potentially move into an accumulation or range phase.
If I see strong movement earlier in the week, I won’t hesitate to take a long position.
💬 For deeper sentiment and strategy insights, subscribe to my Substack free access available.
⚠️ This analysis is for educational purposes only and does not constitute financial advice. Always conduct your own research before trading or investing.

QQQ (NQ-US100) Weekly Prediction – Outlook (21 DEC)QQQ (NQ-US100) Weekly Prediction – Outlook (21 DEC)
📊 Market Sentiment
Market sentiment turned fully bullish after the CPI data came in significantly lower than expected on Thursday. While the consensus expectation was 3.1%, the actual CPI print came at 2.7%, representing a meaningful downside surprise.
This data does not directly determine the outcome of the January FED meeting, as another CPI report will be released on January 13, 2026, which will be far more critical for the FED’s decision making process. However, the current soft inflation trend increased the probability of another lower CPI reading in January, which positively impacted risk sentiment across markets.
📈 Technical Analysis
Last week’s QQQ analysis played out perfectly. I hope you were able to capitalize on it. Price reversed precisely from the levels we anticipated following the CPI release. I am linking last week’s QQQ weekly analysis below for reference.
After the CPI data, price transitioned back into a clean bullish structure on both the daily and weekly timeframes. On Friday, QQQ rallied impulsively and closed the week with strong bullish momentum.
Overall, I think the market structure supports bullish continuation.
📌 Game Plan
I think QQQ may directly test 618.5 (Target 1) early in the week, followed by a move toward 625.75. These are the two bullish targets I expect to be reached within this week.
Price may also move toward these targets without any meaningful retracement. I plan to close one third of my call options at 618.5 and the remaining portion at 625.75 from the positions I am holding since Thursday.
If price pulls back to 611.75 or 607 before reaching 625.75 and prints strong 1H or 4H bullish candle closes, I will look to add new call option positions targeting 625.75.
In the event of a developing bearish structure, I will provide updates. However, at this stage, I do not see any clear bearish signals.
💬 For deeper sentiment and strategy insights, subscribe to my Substack free access available.
This analysis is for educational purposes only and does not constitute financial advice. Always conduct your own research before trading or investing.

SPY (ES-US500-SPX) Weekly Prediction – Outlook (21 DEC)SPY (ES-US500-SPX) Weekly Prediction – Outlook (21 DEC)
📊 Market Sentiment
Market sentiment turned fully bullish after the CPI data came in significantly lower than expected on Thursday. While the expectation was 3.1%, the actual CPI print came at 2.7%, which was a meaningful downside surprise.
This data does not directly determine the outcome of the January FED meeting, as another CPI report will be released on January 13, 2026, which will be far more critical for the FED’s decision making process. However, the current soft inflation trend increased the probability of another lower CPI reading in January, which positively impacted risk sentiment across markets.
📈 Technical Analysis
In my previous SPY analysis last week, I clearly outlined the expectation of an early week pullback followed by a precise reversal level. That scenario played out exactly as anticipated.
Following the CPI release, price completed its reversal and closed the week with very strong bullish price action on Friday. In my opinion, this behavior suggests that the corrective phase has likely ended and price is now preparing for continuation to the upside.
📌 Game Plan
I think price may target the 683.5 level early in the week.
For call options and long positions, the key lower timeframe reaction zones I will be monitoring are 678.25 and 675.25.
If price rallies directly toward 683.5, I plan to sell the majority of my existing call positions around that level. However, if price first tests 678.25 or 675.25 before reaching 683.5, I am considering adding additional call exposure from those zones.
That said, my decision to enter will strongly depend on 1H and 4H candle closes. I will not enter positions in a market that simply breaks through these levels. If price tests these zones and prints strong bullish 1H or 4H closes, that is when I will begin executing call option entries.
💬 For deeper sentiment and strategy insights, subscribe to my Substack free access available.
This analysis is for educational purposes only and does not constitute financial advice. Always conduct your own research before trading or investing.

WEEKLY QQQ (NQ-US100-USTECH) Outlook - Prediction (14 DEC)WEEKLY QQQ (NQ-US100-USTECH) Outlook - Prediction (14 DEC)
📊 Market Sentiment
Market sentiment has turned slightly bullish again following the FED’s rate cut decision. We saw the market react quickly after Powell’s speech. QE has restarted, and the FED stated it will buy $40 billion of Treasury bills over the next 30 days. This narrative supports the bullish case; however, $40B is relatively small compared to the overall size of the U.S. market.
At the same time, the bearish narrative is strengthening. Powell stated that “rates are now in a plausible range of neutral,” and the FED emphasized that it will assess incoming data until the January meeting. No decision has been made for January yet.
This keeps the market in a state of uncertainty and when the market lacks a clear narrative, it often turns bearish. Keep this in mind.
📈 Technical Analysis
QQQ hit the 629 level, as I pointed out last week. I am linking last week’s QQQ prediction below for reference.
Price ran the 629 level but could not close above it. After that, we saw selling pressure due to SPY and YM hitting all time highs and getting rejected. QQQ was the weaker index last week, which explains why we did not expand as much as SPY and why QQQ failed to reach all time highs.
I believe the expansion higher will resume, but first price needs to gather more energy before continuing upward.
📌 Prediction – Outlook
I am tracking three different scenarios:
Scenario 1 (Black Line) – Bullish:
Price runs the 610.5 level and closes above it. If this occurs, I will be buying calls, targeting 617.5 first, with a runner for higher levels.
Scenario 2 (Orange Line):
Price retraces to 610.5 and closes below, creating a deeper pullback. Price then reaches 605.5 and closes back above it. This would likely initiate bullish momentum.
In this case, I would be buying calls, targeting 610.5 first and 617.5 as the second target.
Scenario 3 (Red Line) – Bearish:
Price retraces to 610.5 and aggressively closes below. Price then continues lower toward 597.5 without showing strength.
If price later closes back above 597.5, I will look to buy calls.
Initial profit targets would be 605.5 and 610.5.
💬 For detailed insights and broader market context, please check my Substack link in profile.
For educational purposes only. This is not financial advice.

QQQ (US100 – USTECH – NQ) WEEKLY PREDICTION - (08 DEC)QQQ (US100 – USTECH – NQ) WEEKLY PREDICTION
📊 Market Sentiment
Market sentiment remains bullish, supported by expectations of a potential FED rate cut in December.
Additionally, Trump’s likely nominee for the next FED Chair Kevin Hassett, a strong advocate of aggressive rate cuts has strengthened this bullish outlook.
Markets have already begun pricing in the possibility of earlier and more aggressive cuts throughout 2026, fueling continued upside momentum.
📈 Technical Analysis
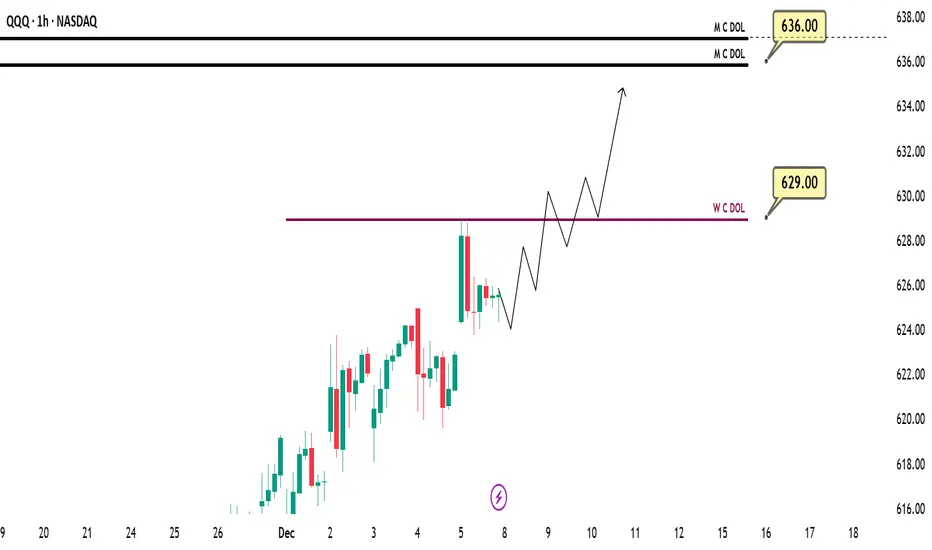
QQQ is strongly bullish at the moment.
In my opinion, as long as SPY continues pushing toward all time highs, QQQ is unlikely to experience any meaningful retracement.
📌 Game Plan – Prediction
I expect QQQ to reach 629 this week at minimum.
A strong move may occur right after the market opens however, since the FED decision will be released on Wednesday, the early part of the week may show some choppy or ranging price action.
💬 For deeper sentiment and strategy insights, subscribe to my Substack free access available.
⚠️This analysis is for educational purposes only and does not constitute financial advice. Always conduct your own research before trading or investing.
Weekly SPY (ES-US500-SPX) Outlook - Prediction (23 NOV)Weekly SPY (ES-US500-SPX) Outlook - Prediction
📊 Market Sentiment
Market sentiment is driven by fear at the moment. In my opinion, we are trading inside a bearish zone. Unless we get meaningful data or positive news, I expect the market to continue declining. Core PPI will be released on Tuesday at 08:30, which could create a small bullish reaction; however, I personally do not think this will shift overall sentiment. PPI is not a strong catalyst for a major sentiment change, so bearish conditions are likely to remain in play.
📈 Technical Analysis
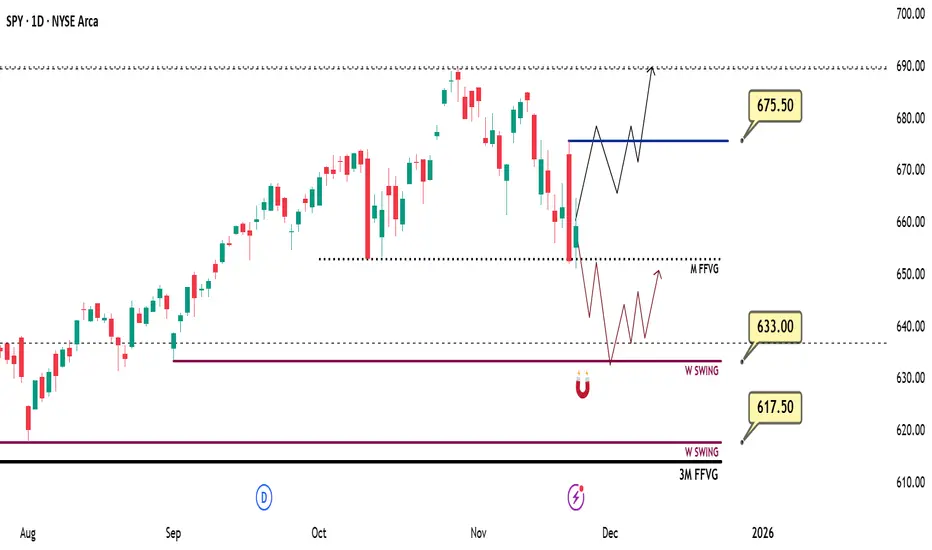
Price ran 675.5, trapped the bulls, and then reversed sharply to the downside exactly as I anticipated in my previous weekly outlook. Price tapped 653 and bounced from that level, which aligned with Friday’s projection.
📌 Outlook – Prediction
Scenario 1 (Bearish Scenario):
I think this scenario is more likely early in the week. Price may retrace toward 633, which is a significant institutional liquidity pool for me. From there, price could gather energy for a higher expansion or bounce.
Scenario 2 (Bullish Scenario):
If price aggressively reprices back to 675, I will consider the bias short-term bullish. In that case, I will be buying after a retracement to 667.
Follow me for daily SPY–QQQ updates. I will update the idea based on evolving price action.
💬 For detailed insights and broader market context, please check my Substack link in profile.
⚠️ For educational purposes only. This is not financial advice.
Weekly QQQ (US100-NQ) Outlook - Prediction (16 NOV)Weekly QQQ (US100-NQ) Outlook - Prediction (16 NOV)
📊 Market Sentiment
Market sentiment appears bearish right now, in my opinion. The FED may pause rate cuts in December, which has contributed to recent selling pressure and possible hedging flows. However, with the U.S. government reopening last week, we will start receiving updated economic data again. If employment data weakens and CPI comes in low or stable, it could trigger a renewed bullish momentum.
NVDA will report earnings this Wednesday after market close. I will be watching closely in my view, if NVDA were to miss expectations, QQQ and SPY could see a strong retracement. However, I think this is unlikely. I expect solid earnings growth and believe the AI cycle continues to support upside.
Additionally, U.S. Treasury Secretary Scott Bessent stated that the Trump administration aims to finalize its trade agreement with China by Thanksgiving (November 27). This could add further bullish sentiment to the market.
📈 Technical Analysis
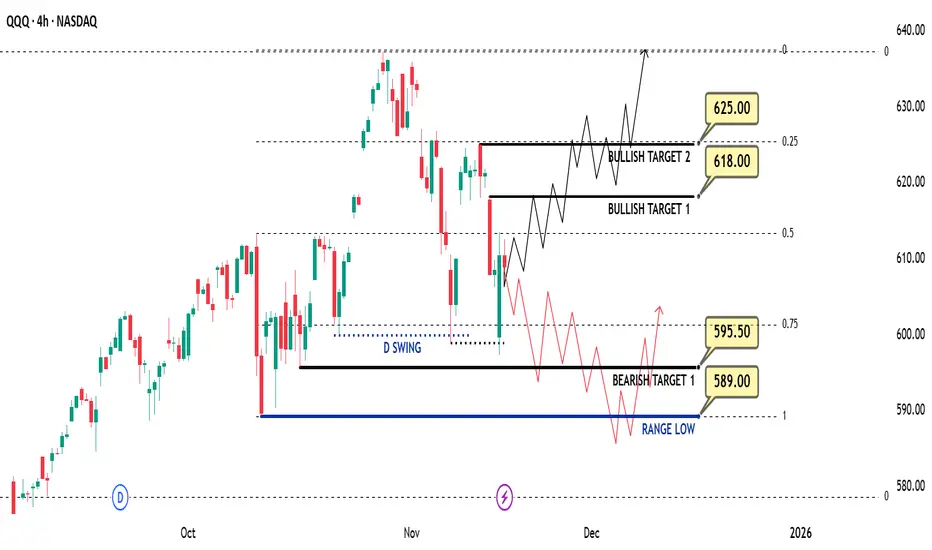
The market showed a strong bounce on Friday after tapping the 599 level. RSI has also reset, meaning price is no longer overbought. We remain inside the weekly range, and price has reached the 0.75 max discount zone for the second time.
📌 Game Plan – Prediction
Bullish Scenario (Black Line):
I think this scenario is more likely. I want to see price close a 4H candle above 613. If that happens, I will be targeting 618 next. Price may run 618, pull back slightly, then eventually push toward 625 and potentially all-time highs around 637.
Bearish Scenario (Red Line):
If we see strong selling on Monday, I will assume price may follow the bearish path. In that case, I expect a move toward 595.5 and then the range low at 589. From there, we could see a bounce and a reclaim of 595.5.
💬For detailed insights and broader market context, please check my Substack link in profile.
⚠️ For educational purposes only. This is not financial advice.
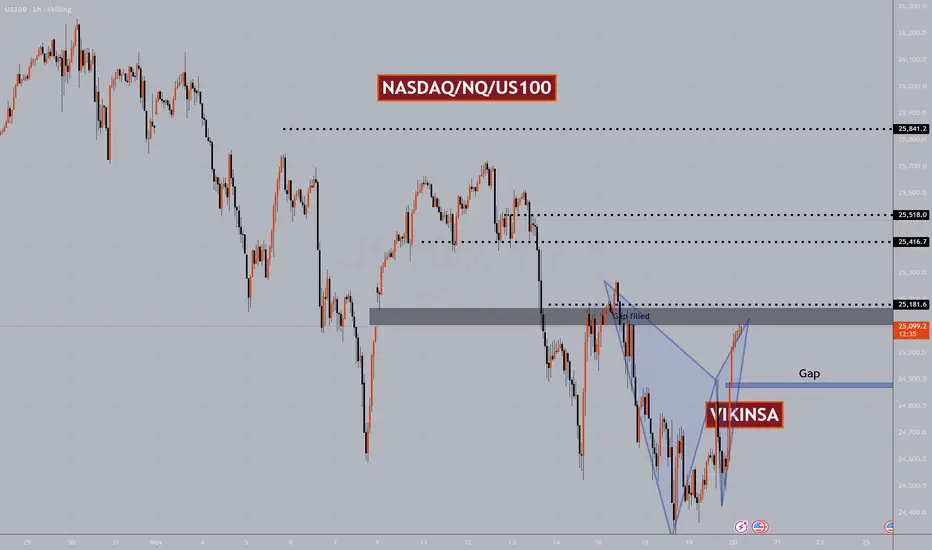
NASDAQ $NQ US100 Major Levels And PatternsNasdaq bounced yesterday heavily and completed a W pattern. I personally have been able to capture majority of this move. You can consider yesterday's W pattern a sort of double bottom which means hat more bullishness is expected in the medium term.
On a short term, now that it has completed a W pattern and reached previous important zone which had a gap, so we can expect a correction here but this may not be a big one. In a rare case there may not be any correction here at all because NASDAQ is forming a pattern which when forms usually ignores all the smaller W and M patterns.
For that reason my Bias is bullish and I will look for buying opportunities mostly.
There are certain Higher time frame levels that I am watching closely which you will find on the chart.
Trade what you see, manage the risk.
Follow for more. Please support this analysis by liking, commenting, and sharing with friends, colleagues, traders, and trading communities. Thanks👍🙂
Daily QQQ (US100-NQ) Outlook - Prediction (19 NOV)Daily QQQ (US100-NQ) Outlook - Prediction (19 NOV)
📊 Market Sentiment
Market sentiment appears bearish right now, in my opinion. The FED may pause rate cuts in December, which has contributed to recent selling pressure and possible hedging flows. However, with the U.S. government reopening last week, we will begin receiving updated economic data again. If employment data weakens and CPI comes in low or stable, it could trigger renewed bullish momentum.
NVDA earnings will be released today after market close. If NVDA beats expectations, this could trigger an impulsive bullish move for both QQQ and SPY. If earnings miss, that may create strong bearish sentiment across the market.
📈 Technical Analysis
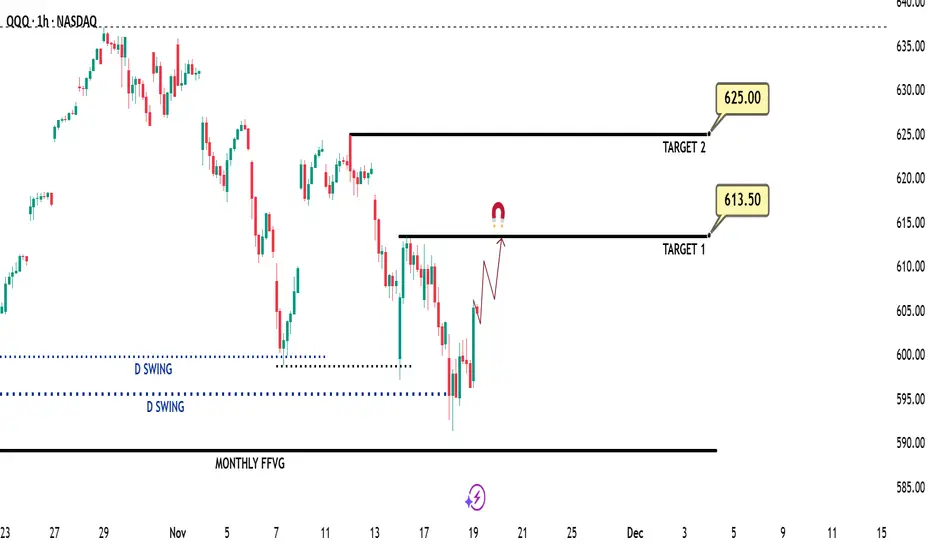
Price tapped the 595.5 level and bounced cleanly from there. A strong bullish candle close has appeared on NQ, indicating solid upward momentum for the day.
📌 Game Plan – Prediction
I am buying calls targeting 613.5 first. I will also keep a runner for a potential move toward 625 in case NVDA reports strong earnings. That could generate significant bullish momentum, potentially pushing price toward new all-time highs. My runner is positioned for that potential after hours continuation.
💬For detailed insights and broader market context, please check my Substack link in profile.
⚠️ For educational purposes only. This is not financial advice.
Daily QQQ (US100-NQ) Outlook - Prediction (NOV 18)Daily QQQ (US100-NQ) Outlook - Prediction (18 NOV)
📊 Market Sentiment
Market sentiment appears bearish right now, in my opinion. The FED may pause rate cuts in December, which has contributed to recent selling pressure and possible hedging flows. However, with the U.S. government reopening last week, we will start receiving updated economic data again. If employment data weakens and CPI comes in low or stable, it could trigger renewed bullish momentum.
NVDA will report earnings this Wednesday after market close. I will be watching closely in my view, if NVDA were to miss expectations, both QQQ and SPY could see a strong retracement. However, I think this is unlikely. I expect solid earnings growth and believe the ongoing AI cycle continues to support upside.
Additionally, U.S. Treasury Secretary Scott Bessent stated that the Trump administration aims to finalize its trade agreement with China by Thanksgiving (November 27). This could bring further bullish sentiment into the market.
📈 Technical Analysis
The market showed a strong bounce on Friday after tapping the 599 level. RSI has also reset, meaning price is no longer overbought. We remain inside the weekly range, and price has now touched the 0.75 max discount zone for the second time.
📌 Game Plan – Prediction
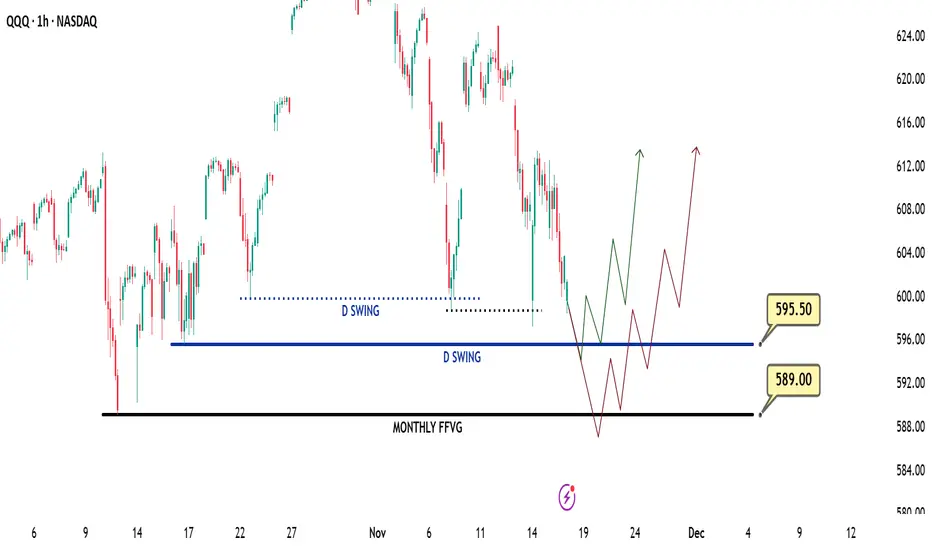
There are 2 different expectations outlined on the chart.
S cenario 1 (Green line): Price to hit 585.5$ then close 1H above the level, bringing it back to us for a bounce.
Scenario 2 (Red line): Price retraces till 579 and gets a bounce from there. I believe 579 is the strongest zone for buyers. I will be buying calls once we hit there.
💬 For detailed insights and broader market context, please check my Substack link in profile.
⚠️ For educational purposes only. This is not financial advice.
Daily QQQ (US100-NQ) Outlook - Prediction (17 NOV)Daily QQQ (US100-NQ) Outlook - Prediction (17 NOV)
📊 Market Sentiment
Market sentiment appears bearish right now, in my opinion. The FED may pause rate cuts in December, which has contributed to recent selling pressure and possible hedging flows. However, with the U.S. government reopening last week, we will start receiving updated economic data again. If employment data weakens and CPI comes in low or stable, it could trigger renewed bullish momentum.
NVDA will report earnings this Wednesday after market close. I will be watching closely in my view, if NVDA were to miss expectations, both QQQ and SPY could see a strong retracement. However, I think this is unlikely. I expect solid earnings growth and believe the ongoing AI cycle continues to support upside.
Additionally, U.S. Treasury Secretary Scott Bessent stated that the Trump administration aims to finalize its trade agreement with China by Thanksgiving (November 27). This could bring further bullish sentiment into the market.
📈 Technical Analysis
The market showed a strong bounce on Friday after tapping the 599 level. RSI has also reset, meaning price is no longer overbought. We remain inside the weekly range, and price has now touched the 0.75 max discount zone for the second time.
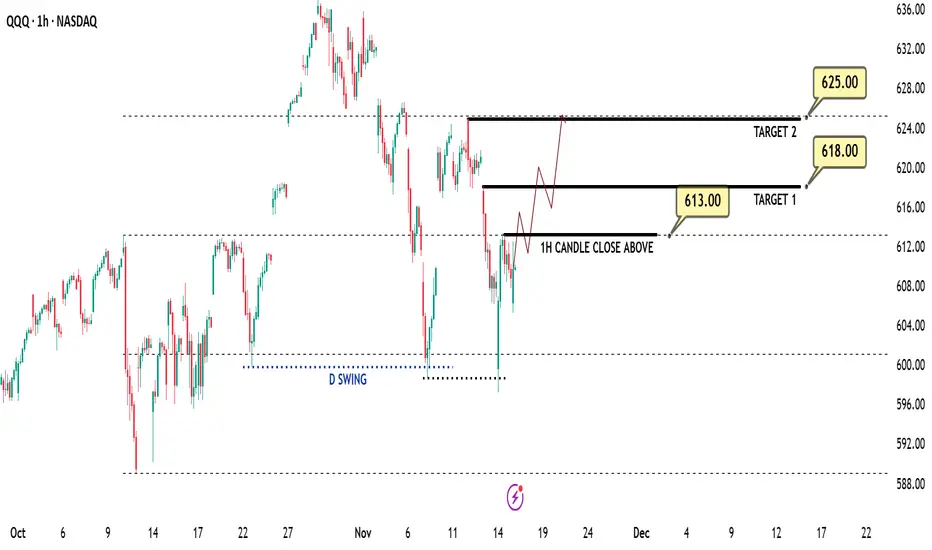
📌 Game Plan – Prediction
A 1H candle close above 613 on QQQ will confirm bullish momentum, setting the next target at 618. If we get a clean 1H close above 613, I will be buying calls. After hitting 618, price may pull back slightly before eventually pushing toward 625 and potentially all-time highs around 637.
💬For detailed insights and broader market context, please check my Substack link in profile.
⚠️ For educational purposes only. This is not financial advice.
Daily SPY (US500-ES-SPX) Outlook - Prediction (14 NOV)Daily SPY (US500-ES-SPX) Outlook - Prediction (14 NOV)
📊 Market Sentiment
Market sentiment appears neutral, in my opinion. The U.S. government is expected to reopen soon; however, officials have decided not to release previous economic data. This creates uncertainty for traders — without key data, it becomes difficult to anticipate the FED’s next policy decision.
📈 Technical Analysis
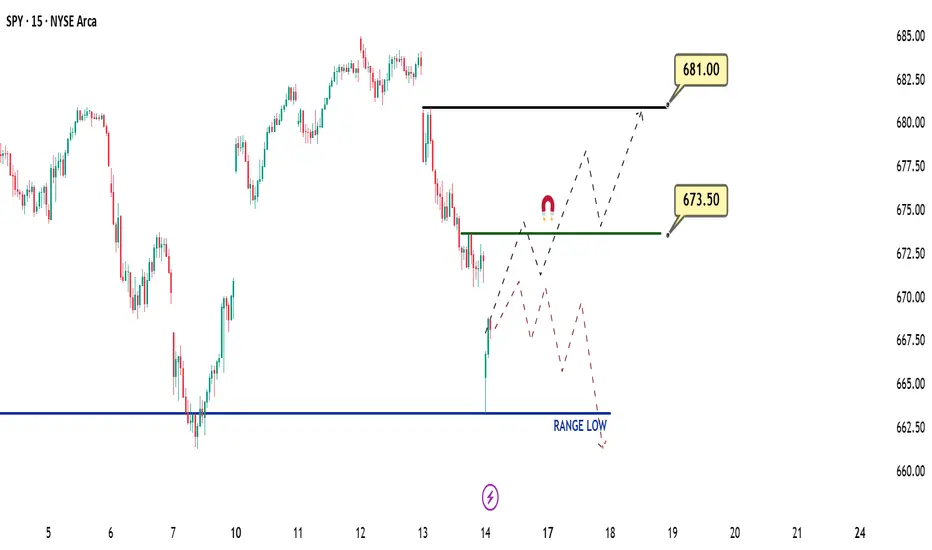
QQQ ran the weekly swing low at the 687 level and was rejected there. SPY retested the 637 zone, which is the range low for me, and reacted perfectly with a strong bounce. At the moment, price is showing clear upward momentum, suggesting that a stronger move may develop into the afternoon session. NVDA and AAPL are currently leading the market higher.
📌 Game Plan
Bullish Scenario: I bought calls and I’m targeting a minimum of 673.5. My second target is 681 for a runner. Once price reaches 673.5, I will move my stops to break-even.
Bearish Scenario: If price gets rejected at the 671 level, I will exit my calls and switch to puts, targeting the 661 zone.
💬For detailed insights and broader market context, please check my Substack link in profile.
⚠️ For educational purposes only. This is not financial advice.
Daily QQQ (US100-NQ) Outlook - Prediction (14 NOV)Daily QQQ (US100-NQ) Outlook - Prediction (14 NOV)
📊 Market Sentiment
Market sentiment appears neutral, in my opinion. The U.S. government is expected to reopen soon; however, officials have decided not to release previous economic data. This creates uncertainty for traders without key data, it becomes difficult to anticipate the FED’s next policy decisions.
📈 Technical Analysis
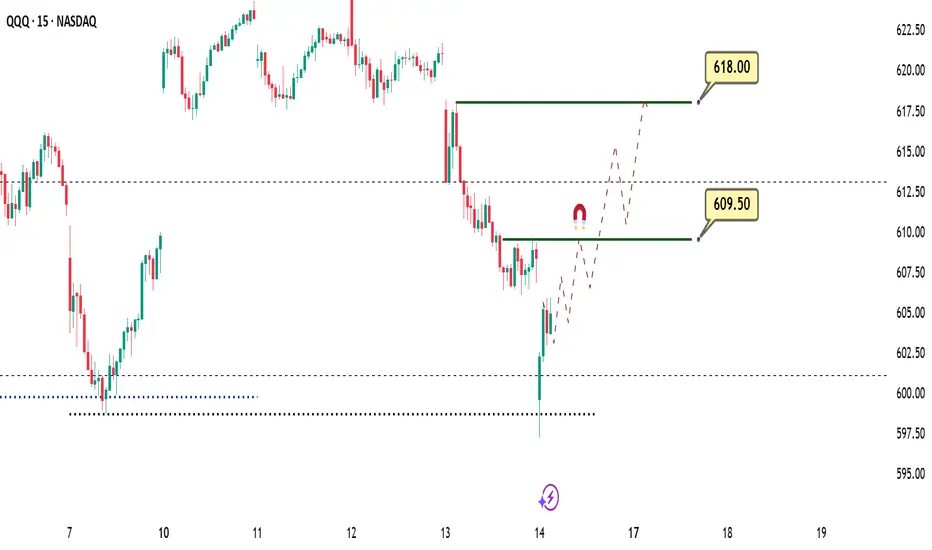
QQQ tapped the weekly swing low at 687 and was rejected from that level. SPY retested the 637 zone, which is the range low for me, and reacted with a strong bounce. At the moment, price is showing clear upward momentum, suggesting that a stronger move may develop into the afternoon session. NVDA and AAPL are currently leading the market higher.
📌 Game Plan
I bought calls around 601, and I expect to see 609.5 first, and if we get a strong continuation, possibly the 618 level.
At 609.5, I will close half of my position, trail my stop-loss to breakeven, and target 618 for the remainder.
💬For detailed insights and broader market context, please check my Substack link in profile.
⚠️ For educational purposes only. This is not financial advice.
Daily SPY (US500-SPX) Outlook - Prediction (13 NOV)Daily SPY (US500-SPX) Outlook - Prediction (13 NOV)
📊 Market Sentiment
Market sentiment appears neutral, in my opinion. The U.S. government is expected to reopen soon; however, officials have decided not to release previous economic data. This adds uncertainty for traders without data, it becomes difficult to gauge the FED’s next policy decision.
📈 Technical Analysis
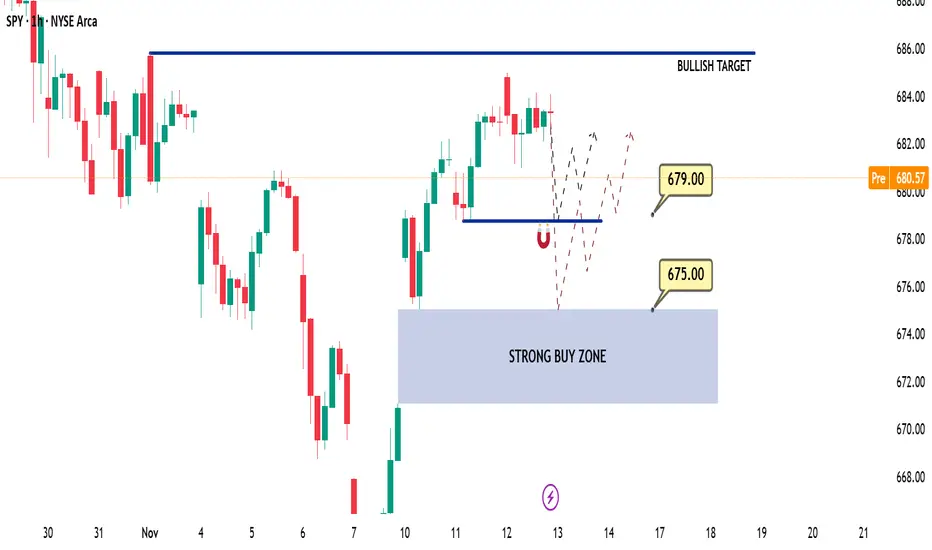
SPY experienced a range-bound session yesterday, consolidating between 680 and 685. On higher timeframes, price action still suggests a desire to expand higher, but momentum has temporarily slowed.
📌 Game Plan
In my opinion, the market may show slight bearish pressure early in the session, followed by a moderate bullish bounce.
Scenario 1: SPY may drop to 679 and bounce from there, returning to the 682–685 range.
Scenario 2: If SPY breaks 679 aggressively, I expect a retracement toward 675. At that level, I plan to load calls for a potential bullish move.
💬 For detailed insights and broader market context, please check my Substack link in profile.
⚠️ For educational purposes only. This is not financial advice.