Ustech100

NSDQ100 resistance retest?Risk appetite extended for a second session as easing geopolitical anxiety and strong US data supported growth assets. The broader risk-on tone pushed the S&P 500 +0.55% back within 1% of record highs, and that backdrop remains constructive for the NASDAQ 100, with volatility continuing to compress. The VIX fell to 15.64, now below pre-tariff-announcement levels, reinforcing demand for high-beta and duration-sensitive equities.
Rates were a mild headwind but not yet restrictive: 2yr Treasury yields rose to a 6-week high at 3.61%, reflecting confidence in near-term growth rather than renewed policy fears. For now, that yield move is consistent with tech leadership rather than a rotation away from it, particularly as credit markets signal little stress, with US HY spreads tightening to 250bps, the tightest since 2007.
That said, positioning is not complacent. Gold surged to fresh highs near $5,000/oz, highlighting lingering demand for geopolitical hedges amid unresolved uncertainty around Greenland and broader NATO tensions. This acts as a reminder that headline risk could still trigger sharp intraday reversals, even as equities grind higher.
Bottom line: The near-term setup for the NASDAQ 100 remains supportive, with falling volatility and tight credit spreads favouring upside continuation. However, rising front-end yields and persistent geopolitical hedging argue for tactical caution rather than outright chase, especially near recent highs.
Key Support and Resistance Levels
Resistance Level 1: 25540
Resistance Level 2: 25707
Resistance Level 3: 25840
Support Level 1: 24714
Support Level 2: 24590
Support Level 3: 24436
This communication is for informational purposes only and should not be viewed as any form of recommendation as to a particular course of action or as investment advice. It is not intended as an offer or solicitation for the purchase or sale of any financial instrument or as an official confirmation of any transaction. Opinions, estimates and assumptions expressed herein are made as of the date of this communication and are subject to change without notice. This communication has been prepared based upon information, including market prices, data and other information, believed to be reliable; however, Trade Nation does not warrant its completeness or accuracy. All market prices and market data contained in or attached to this communication are indicative and subject to change without notice.

Will NAS100 Sustain Its Bullish Momentum After the Pullback?NAS100 🚀 Bullish Swing Setup | SuperTrend Pullback & Layered Entry Strategy
🎯 TRADE IDEA: NAS100 (US100) BULLISH SWING
Capitalize on a structured pullback in the NASDAQ 100! This plan leverages a proven indicator confluence for a high-probability long opportunity.
📊 ANALYSIS & CONFIRMATION:
Trend: Primary Bullish Trend is intact. ✅
Trigger: Price is pulling back into a demand zone, offering a favorable risk-to-reward entry.
Indicator: The SuperTrend ATR Line is acting as dynamic support on the 4H/Daily timeframe. A bounce from this level confirms our bullish bias.
⚡ STRATEGY: "THE THIEF" LAYERED ENTRY
This method uses multiple limit orders to average into a position, perfect for volatile markets like the NASDAQ.
Entry Zone: Look for entries between 25,200 - 25,600
Layer Example:
🟢 Limit Order 1: 25,600
🟢 Limit Order 2: 25,400
🟢 Limit Order 3: 25,200
👉 You can adjust the number of layers and prices based on your capital and risk appetite.
❗ RISK MANAGEMENT:
Stop Loss (SL): A decisive break below 24,800 would invalidate the bullish structure.
⚠️ IMPORTANT NOTE: This is MY protective stop. Dear Thief OG's 👑, you MUST adjust your position size and SL based on your personal risk management strategy. Protect your capital first!
🎯 PROFIT TARGETS:
Primary Target: 25,600 (Initial resistance & profit-taking zone).
Key Reasoning: We anticipate a reaction here due to:
Moving Average resistance.
Potential overbought conditions on lower timeframes.
A "trap" for late buyers.
👉 Smart Move: Consider taking partial profits at 25,600 and trailing your stop for the remainder. Escape the trap with your profits! 💰
⚠️ REMINDER: Dear Thief OG's 👑, your Take Profit (TP) is your own decision. Secure gains based on your trading plan and market behavior.
🔍 RELATED ASSETS & MARKET CORRELATION:
Watching these related instruments can provide confirmation and a broader market view.
TVC:DXY (U.S. Dollar Index): 🟡 NEGATIVE CORRELATION
A weakening Dollar ( TVC:DXY DOWN) is generally bullish for Nasdaq. If the Dollar is falling, it adds confidence to this long thesis.
USTECH (CFD on Nasdaq 100): 🟢 DIRECT CORRELATION
Moves in sync with NAS100. Perfect for cross-verifying price action and volume.
NASDAQ:AAPL , NASDAQ:MSFT , NASDAQ:TSLA (Mega-Caps): 🟢 HIGH IMPACT
These heavily weighted Nasdaq components drive the index. Bullish momentum in these stocks supports a rising NAS100.
FOREXCOM:SPX500 (S&P 500): 🟢 POSITIVE CORRELATION
A strong S&P 500 often lifts the Nasdaq. Monitor for overall U.S. market strength.
💬 Let me know your thoughts in the comments!
What's your entry strategy for the NAS100 this week?
#NAS100 #US100 #TradingView #SwingTrading #Bullish #SuperTrend #TradingStrategy #IndexTrading #LayeredEntry #ThiefStrategy

CrowdStrike undecidedCRWD seems rather undecided whether to follow through with ist corrective path or whether to make new highs. However, we still assign only a 36% probability that the high for wave alt. in green may already be in place; this alternative scenario would be confirmed by a drop below the support level at $402.66.
For now, though, our primary outlook allows for further upside, with the potential for green wave to complete above the resistance at $517.98—and possibly above the current all-time high of $566.90.
Regardless of which scenario unfolds, a move down to the green target zone (ranging from $114.02 to $33.73) appears likely—either sooner (in the alternative scenario) or later (in the primary scenario)—to complete the larger wave II correction.
Once this significant low is established, we expect the stock to move toward new record highs as part of a beige wave III to follow.

Nasdaq100OANDA:NAS100USD
After retesting the main trendline on the daily Timeframe.
Nasdaq 100 went back and it is going back to last weeks highs.
Since it is January Nasdaq100 could be preparing for a BIG SELL-OFF
before BUYING stronger again for 2026.
What do you think from Indices traders?

NSDQ100 tone is cautious to slightly negativeUS equities softened, with risk sentiment pressured by continued bank underperformance. Financials were again the main drag after JPMorgan fell sharply on weaker-than-expected investment banking fees, keeping focus on upcoming earnings from Bank of America and Citigroup today, and Goldman Sachs and Morgan Stanley tomorrow. While this mainly hits the S&P 500, it weighs on broader risk appetite for Nasdaq-100 trading.
Mega-cap tech underperformed slightly, but overall market breadth was not too weak, with defensive and energy sectors leading. This suggests Nasdaq downside is more about sentiment than aggressive tech selling.
Metals continued to surge, with gold and silver at record highs, reinforcing expectations of US rate cuts and improved China growth. This supports a lower-yield environment, which is medium-term supportive for growth and tech stocks, even if near-term risk appetite is fragile.
Political and regulatory uncertainty remains a headwind, particularly Trump’s push for a 10% cap on credit card rates and tensions around Fed independence, which keeps volatility elevated but does not directly target Nasdaq heavyweights.
Bottom line: Near-term Nasdaq-100 tone is cautious to slightly negative due to weak financials and policy noise, but deeper downside is limited as tech selling remains contained and falling-rate expectations provide underlying support.
Key Support and Resistance Levels
Resistance Level 1: 25975
Resistance Level 2: 26182
Resistance Level 3: 26568
Support Level 1: 25375
Support Level 2: 25206
Support Level 3: 25000
This communication is for informational purposes only and should not be viewed as any form of recommendation as to a particular course of action or as investment advice. It is not intended as an offer or solicitation for the purchase or sale of any financial instrument or as an official confirmation of any transaction. Opinions, estimates and assumptions expressed herein are made as of the date of this communication and are subject to change without notice. This communication has been prepared based upon information, including market prices, data and other information, believed to be reliable; however, Trade Nation does not warrant its completeness or accuracy. All market prices and market data contained in or attached to this communication are indicative and subject to change without notice.

NSDQ100 consolidation below resistance at 25922Key Support and Resistance Levels
Resistance Level 1: 25922
Resistance Level 2: 26166
Resistance Level 3: 26400
Support Level 1: 25220
Support Level 2: 25090
Support Level 3: 24940
This communication is for informational purposes only and should not be viewed as any form of recommendation as to a particular course of action or as investment advice. It is not intended as an offer or solicitation for the purchase or sale of any financial instrument or as an official confirmation of any transaction. Opinions, estimates and assumptions expressed herein are made as of the date of this communication and are subject to change without notice. This communication has been prepared based upon information, including market prices, data and other information, believed to be reliable; however, Trade Nation does not warrant its completeness or accuracy. All market prices and market data contained in or attached to this communication are indicative and subject to change without notice.

NSDQ100 resistance breakout required for a leg higherUS equities extended their rally, but Nasdaq 100 performance lagged as weakness in mega-cap tech offset broader risk-on sentiment. The S&P 500 made a new record, yet the Mag 7 declined (-0.36%), weighing on the index. Tesla led losses (-4.1%), while Nvidia slipped following CES-related headlines, keeping pressure on tech leadership.
Outside of mega caps, market breadth was strong, with small caps outperforming, highlighting a rotation away from concentrated tech exposure. This divergence is a near-term headwind for the Nasdaq 100.
Rates moved higher, with Treasury yields rising across the curve, reinforcing valuation pressure on growth stocks. Fed commentary leaned dovish but offered nothing new to shift policy expectations.
Macro and geopolitical developments added cross-currents: easing oil prices and weaker precious metals signal some cooling in risk assets, while Venezuela, China–Japan trade tensions, and renewed US geopolitical rhetoric add background volatility.
Bottom line: Nasdaq 100 strength is being capped by mega-cap fatigue and higher yields, despite strong overall equity momentum. Leadership rotation remains the key theme for near-term trading.
Key Support and Resistance Levels
Resistance Level 1: 25922
Resistance Level 2: 26166
Resistance Level 3: 26400
Support Level 1: 25220
Support Level 2: 25090
Support Level 3: 24940
This communication is for informational purposes only and should not be viewed as any form of recommendation as to a particular course of action or as investment advice. It is not intended as an offer or solicitation for the purchase or sale of any financial instrument or as an official confirmation of any transaction. Opinions, estimates and assumptions expressed herein are made as of the date of this communication and are subject to change without notice. This communication has been prepared based upon information, including market prices, data and other information, believed to be reliable; however, Trade Nation does not warrant its completeness or accuracy. All market prices and market data contained in or attached to this communication are indicative and subject to change without notice.

US100 M15 FVG Reaction and Bullish Continuation Setup📝 Description
US100 on M15 is trading inside a corrective phase after a clear impulse. Price has dipped into a 15M FVG and is showing early signs of support and absorption, suggesting this move is a liquidity-driven pullback rather than a trend reversal.
________________________________________
📈 Signal / Analysis
Primary Bias: Short-term bullish continuation while holding above 25,540–25,560
Long Setup (Preferred):
• Entry (Buy): 25,560
• Stop Loss: Below 25,530
• TP1: 25,597
• TP2: 25,620 (15M FVG)
• TP3: 25,657 (BSL / range high)
________________________________________
🎯 ICT & SMC Notes
• Clean pullback into 15M FVG
• Signs of absorption, not acceptance lower
• Market structure still bullish on LTF
• BSL resting above recent highs
________________________________________
🧩 Summary
This looks like a classic pullback-to-continue setup. As long as US100 holds the current FVG, odds favor a push higher to collect buy-side liquidity near the highs. Acceptance below the FVG invalidates the long idea.
________________________________________
🌍 Fundamental Notes / Sentiment
With US indices still sensitive to macro headlines and rate expectations, shallow pullbacks into liquidity zones often resolve with continuation. Trade reactions, keep risk tight, and scale out into targets.
________________________________________
⚠️ Risk Disclosure
Trading involves substantial risk and may result in capital loss. This analysis is for educational purposes only and does not constitute financial advice. Always apply proper risk management, predefined stop-loss levels, and disciplined position sizing aligned with your trading plan.

Bearish Supply Zone On NASAQTwo Supply Zones, one in the extreme at the External high, and the other in the Internal High.
Could get a reaction from the internal high and continue to plough through to the extreme zone, or we could get a confirmation signal from that zone and continue with the bearish trend.

NSDQ100 Resistance retest at 25370Key Support and Resistance Levels
Resistance Level 1: 25370
Resistance Level 2: 25660
Resistance Level 3: 25866
Support Level 1: 24820
Support Level 2: 24640
Support Level 3: 24430
This communication is for informational purposes only and should not be viewed as any form of recommendation as to a particular course of action or as investment advice. It is not intended as an offer or solicitation for the purchase or sale of any financial instrument or as an official confirmation of any transaction. Opinions, estimates and assumptions expressed herein are made as of the date of this communication and are subject to change without notice. This communication has been prepared based upon information, including market prices, data and other information, believed to be reliable; however, Trade Nation does not warrant its completeness or accuracy. All market prices and market data contained in or attached to this communication are indicative and subject to change without notice.

NSDQ100 Corrective pullback support at 24820Key Support and Resistance Levels
Resistance Level 1: 25370
Resistance Level 2: 25660
Resistance Level 3: 25866
Support Level 1: 24820
Support Level 2: 24640
Support Level 3: 24430
This communication is for informational purposes only and should not be viewed as any form of recommendation as to a particular course of action or as investment advice. It is not intended as an offer or solicitation for the purchase or sale of any financial instrument or as an official confirmation of any transaction. Opinions, estimates and assumptions expressed herein are made as of the date of this communication and are subject to change without notice. This communication has been prepared based upon information, including market prices, data and other information, believed to be reliable; however, Trade Nation does not warrant its completeness or accuracy. All market prices and market data contained in or attached to this communication are indicative and subject to change without notice.

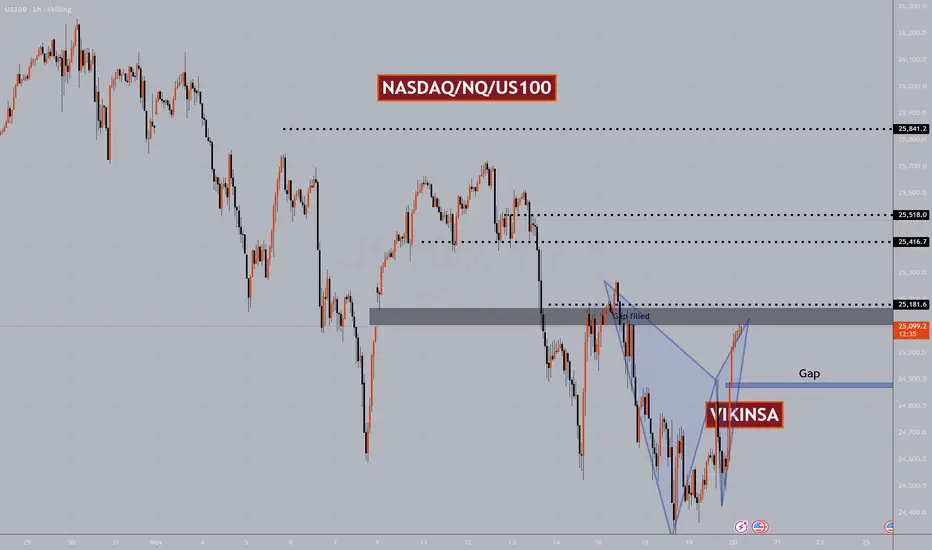
$NQ NASDAQ/US100 Bearish W Pattern Target Hit, Next Quick UpdateHi
The W pattern completed as expected and after that it fell. It reached the first bearish target. I personally am not looking for any more bearishness. I an bullish from the current levels. However I trade what I see and will plan after seeing the latest price action.
There was a big gap let. All these gaps may or may not get filled but they are important levels. So if the markets becomes bullish again, it may try to go higher from the current levels o fill that gap to the upside.
These is a previous gap level which can also provide support if the market falls from the current levels.
Trade what you see, wait for the confirmations and manage the risk as always.
Follow for more. Please support this analysis by liking, commenting, and sharing with friends, colleagues, traders, and trading communities. Thanks👍🙂

NSDQ100 renewed cautionThe Nasdaq-100 saw mixed but resilient performance as the index worked through a heavy tech news cycle:
Tech drag early in the session:
The index opened weak after a sharp tech selloff, led by Oracle (-10.83%), which plunged on missed revenue and higher-than-expected capex, stoking concerns about whether AI-related spending is beginning to show fatigue.
Broader tech sentiment remained cautious with Broadcom slipping after underwhelming AI-related expectations.
Recovery driven by macro tailwinds:
Despite early weakness, the broader US market mood improved, helping the Nasdaq-100 stabilise as investors continued to digest the Fed’s rate cut and easing inflation pressures.
2-yr inflation swaps hit a 13-month low, reinforcing the view that the Fed’s easing cycle is intact—supportive for duration-sensitive tech names.
Global backdrop supportive:
European equities rallied strongly as markets pared back the probability of an ECB hike next year, adding to the global risk-on tone.
Global indices moved closer to record highs on confidence that monetary easing will continue through 2025.
Stock-specific movers with Nasdaq implications:
UBS reached a 17-year high (banking sentiment supportive but not directly Nasdaq-linked).
Lululemon surged pre-market on CEO departure news—boosting retail sentiment within the consumer discretionary components of tech-heavy indices.
Dollar outlook: Strategists at Deutsche Bank and Goldman see the USD weakening in 2025 as the Fed cuts further. A softer dollar typically supports large-cap growth and tech.
Geopolitical noise:
Comments from Donald Trump about guaranteeing Ukraine’s security added volatility in the defense complex globally, but impacts on Nasdaq-100 were indirect and limited.
Takeaway for Nasdaq-100 traders
Early tech weakness (Oracle, Broadcom) signalled renewed caution around AI-driven capex trends.
However, macro easing tailwinds dominated, allowing the index to recover from the weak open.
The path of least resistance remains upward as long as the Fed easing narrative holds, though AI-spending scrutiny may introduce pockets of volatility within the megacap tech complex.

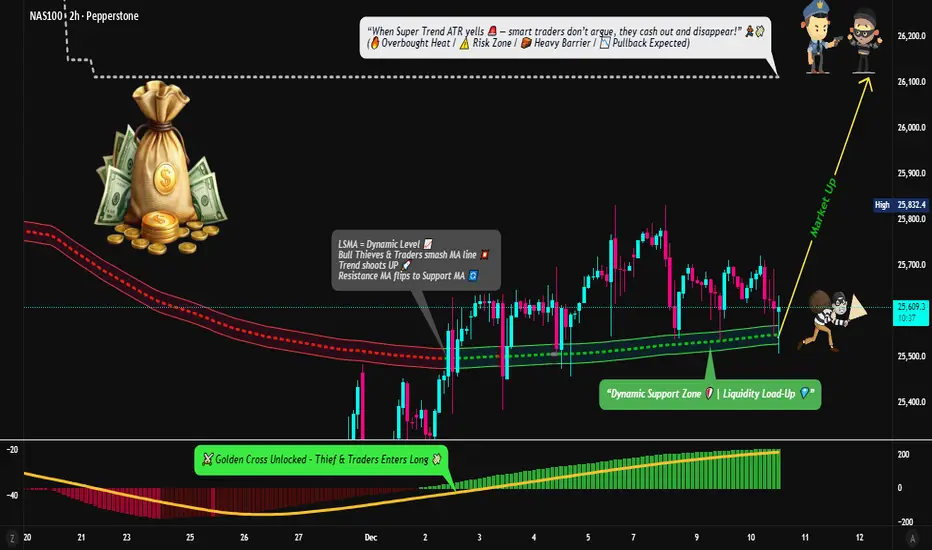
NASDAQ100 Strong Bullish Momentum — Clean Entry & Exit Blueprint⚡ THIEF STRATEGY ALERT: Golden Cross Breakout Setup
📈 TRADE PLAN OVERVIEW
Asset: NAS100 (NASDAQ 100 Index)
Timeframe: Day/Swing Trade
Market Bias: 🟢 BULLISH (Moving Average Breakout + MACD Golden Cross Confirmed)
Strategy Type: Layered Entry Approach (Multi-Level Limit Orders)
🎯 ENTRY STRATEGY - "THIEF LAYERING METHOD"
Multiple Limit Order Entry Points (Build Position Gradually):
📍 Layer 1: 25,400 (First Entry)
📍 Layer 2: 25,500 (Second Entry)
📍 Layer 3: 25,600 (Third Entry)
💡 Pro Tip: Adjust layer levels based on your capital allocation & risk tolerance. This pyramiding approach reduces average entry cost and limits downside risk.
Why This Method? The layered entry reduces emotional trading, averages down your entry price, and ensures you're not all-in on one level.
🛑 STOP LOSS - "THIEF OG PROTECTION"
Suggested SL Level: 25,200
⚠️ IMPORTANT DISCLAIMER: This is a reference level only. Adjust your stop loss based on:
Your personal risk tolerance
Account size & position sizing
Technical support levels on your timeframe
🔴 Remember: Risk management is YOUR responsibility. Set stops that protect YOUR capital.
🎁 PROFIT TARGET - "POLICE BARRICADE RESISTANCE"
Primary Target: 26,100
📊 Technical Confluence:
SUPERTREND ATR Line = Strong Dynamic Resistance
Overbought Zone Alert = Potential Reversal Risk
Resistance Trap = Take profits before reversal occurs
⚠️ CRITICAL NOTE: Partial profit-taking recommended. Don't be greedy at target levels—accumulate gains gradually:
🟢 Take 30-40% profit at 26,100
🟢 Move SL to breakeven, trail remaining position
🟢 Exit second half on additional resistance or SUPERTREND reversal
💰 YOUR DECISION: Profit targets are YOUR choice. Trade at your own risk and manage your exit strategy.
🔗 CORRELATED PAIRS TO WATCH (Risk/Opportunity Indicators)
1. SPY (S&P 500 ETF) - USD Strong Correlation (0.95)
Key Point: Leads or confirms NAS100 moves
Watch For: If SPY breaks below key support, NAS100 pullback likely
Action: Use SPY strength to confirm NASDAQ100 breakout validity
2. QQQ (NASDAQ 100 ETF) - Perfect Mirror (1.0 Correlation)
Key Point: Direct tracker of your asset
Watch For: Volume spikes, divergence patterns
Action: Cross-reference QQQ volume with NAS100—lack of volume = weak breakout
3. DXY (US Dollar Index) - Inverse Correlation (-0.75)
Key Point: Strong dollar = tech selloff risk
Watch For: DXY rejection at key levels
Action: If DXY rallies hard, NAS100 bullish bias weakens—be cautious
4. TLT (20-Year Treasury ETF) - Indirect Inverse (-0.60)
Key Point: Rising rates pressure growth stocks (NASDAQ)
Watch For: TLT breakdown = rate hike concerns = tech pressure
Action: Monitor TLT support; if breaks, expect NAS100 resistance
5. GLD (Gold ETF) - Risk-On Indicator (0.40)
Key Point: Flight-to-safety alternative
Watch For: Sharp gold strength = risk-off environment forming
Action: Gold spike with NAS100 move down = sell signal confirmation
6. VIX (Volatility Index) - Fear Gauge (-0.80)
Key Point: Rising VIX kills bullish momentum
Watch For: VIX above 20 = caution on long positions
Action: If VIX spikes during entry, wait for stabilization before scaling in
✅ CHECKLIST BEFORE ENTRY
Moving Average crossover confirmed (golden cross visible)
MACD histogram turned positive
Price closed above key moving average
Volume supporting the move
Correlated pairs (QQQ/SPY) confirming bullish setup
DXY not in strong uptrend (tech-unfriendly)
VIX stable or declining
🎯 TRADE MANAGEMENT RULES (THIEF OG STYLE)
Scale In: Use limit orders—don't chase price
Protect Profits: Move stop to breakeven after first target hit
Trail Stops: Let winners run while protecting gains
Take Partials: Secure profits incrementally—greed kills traders
Monitor Correlations: Watch correlated pairs for early warning signals
Respect Risk: NEVER risk more than 2% per trade
⚠️ RISK DISCLAIMER
This is an Educational Guide Only for trading strategy examples.
🔴 NOT Financial Advice: I am not a financial advisor, and this does NOT constitute investment advice.
🔴 Your Responsibility: All entry, exit, and stop-loss decisions are YOUR choice and YOUR responsibility.
🔴 Past Performance ≠ Future Results: Market conditions change; strategies may fail.
🔴 Risk Capital Only: Trade only with money you can afford to lose completely.
Trade at your own risk. Always do your own research (DYOR).
💪 THIEF OG'S MINDSET
Dear Ladies & Gentlemen (Thief OG's),
Success in trading isn't about following someone else's exact setup—it's about understanding the WHY behind each decision, adapting to YOUR risk tolerance, and executing with DISCIPLINE.
This guide provides the framework. You provide the execution. Make your profits, protect your capital, and trade smart. 🎯
Now go earn those tendies, OG's! 💰📈
Last Updated: December 2025
Strategy Type: Day/Swing Trade | Timeframe: 4H-Daily
NSDQ100 wait-and-see mode ahead of tonight’s FOMCMarkets remained in wait-and-see mode ahead of tonight’s FOMC decision, keeping equity moves muted. The S&P 500 slipped -0.09%, with futures flat this morning, signalling no strong pre-Fed risk appetite for US equities, including tech.
Key Macro Drivers for NDX
US 10yr yields rose +2.4bps to a 3-month high, continuing the global bond selloff.
Higher yields remain a headwind for long-duration tech stocks, keeping upside in the NASDAQ capped.
Australia’s 10yr yield hit a late-2023 high, confirming that the global tightening in bond markets is still broad-based.
Elsewhere, Franco-German spreads tightened, offering limited relief for global risk sentiment.
Fed in Focus
Markets are pricing a ~90% probability of a 25bp Fed rate cut tonight, which would be the third consecutive cut since September.
Since the last meeting, unemployment has risen to 4.4%, reinforcing the case for near-term easing.
However, inflation concerns are creating deep policy divisions, meaning forward guidance for 2025 is likely to remain intentionally vague.
Powell is unlikely to clearly signal additional cuts, especially with succession uncertainty growing as Kevin Hassett is seen as a leading candidate to replace him.
Implications for NASDAQ 100
Near-term direction hinges on Powell’s tone, not the cut itself.
Dovish guidance → NDX upside via yields pullback.
Cautious / inflation-focused tone → further yield pressure and likely NDX consolidation or downside.
Until the press conference, NDX is likely to remain range-bound with headline-driven volatility tonight.
This communication is for informational purposes only and should not be viewed as any form of recommendation as to a particular course of action or as investment advice. It is not intended as an offer or solicitation for the purchase or sale of any financial instrument or as an official confirmation of any transaction. Opinions, estimates and assumptions expressed herein are made as of the date of this communication and are subject to change without notice. This communication has been prepared based upon information, including market prices, data and other information, believed to be reliable; however, Trade Nation does not warrant its completeness or accuracy. All market prices and market data contained in or attached to this communication are indicative and subject to change without notice.

NSDQ100 positive lead from futures and improving risk sentimentUS markets saw a modest risk-on tone yesterday as stronger-than-expected labour data pushed investors to price in fewer Fed rate cuts for next year. That supported equities, with the S&P 500 extending its winning streak, and futures are pointing to further upside this morning. This provides a supportive near-term backdrop for the Nasdaq 100 into today’s session.
However, the hawkish repricing in rates is a growing headwind for tech. The 10-year Treasury yield rose to a two-week high of 4.10%, and global bond yields continued to climb, amplified by renewed expectations of a Bank of Japan rate hike. Rising long-end yields typically pressure rate-sensitive growth stocks, which could cap upside in the Nasdaq despite positive futures.
The drop in jobless claims to 191k reinforces the view that the US labour market remains resilient, supporting risk appetite but also reducing the urgency for Fed easing. That combination often favours cyclicals over long-duration tech when yields are rising.
On the corporate side, Netflix is in focus following reports of exclusive talks to acquire Warner Bros. Discovery’s studios and HBO Max. This could drive sector-specific volatility across streaming and media names, with potential spillovers into Nasdaq sentiment.
Broader risk sentiment remains constructive, with the VIX slipping to a two-month low, and the continued rally in US transport stocks signalling confidence in economic momentum. That supports equities overall, but the Nasdaq’s direction today is likely to hinge on bond yields:
Stable or lower yields would allow tech to participate in the broader rally.
Further yield upside risks triggering profit-taking in mega-cap growth.
Bottom line: The Nasdaq 100 opens with a positive lead from futures and improving risk sentiment, but rising global bond yields remain the key short-term risk to sustained upside. Streaming and large-cap tech could see elevated volatility today.
This communication is for informational purposes only and should not be viewed as any form of recommendation as to a particular course of action or as investment advice. It is not intended as an offer or solicitation for the purchase or sale of any financial instrument or as an official confirmation of any transaction. Opinions, estimates and assumptions expressed herein are made as of the date of this communication and are subject to change without notice. This communication has been prepared based upon information, including market prices, data and other information, believed to be reliable; however, Trade Nation does not warrant its completeness or accuracy. All market prices and market data contained in or attached to this communication are indicative and subject to change without notice.

NSDQ100 - Soft ADP employment figuresUS equities showed tentative stabilisation, with the S&P 500 up modestly and Nasdaq futures also edging higher this morning. Markets remain cautious ahead of a heavy US data slate and next week’s FOMC, with rate-cut expectations already priced at over 90%, limiting upside momentum for growth stocks.
Focus today is firmly on ADP private payrolls and the ISM services survey, especially the prices paid component, which is seen as an important inflation proxy in the absence of official CPI data. A soft ADP print would reinforce the view of a cooling labour market and be supportive for rate-sensitive Nasdaq tech, while any upside surprise risks pressuring the index via higher yields.
Treasury yields are drifting lower, offering some support to mega-cap tech, but overall trading conditions remain fragile. Crypto volatility continues to spill into risk sentiment after sharp moves in Bitcoin and crypto-related equities.
Geopolitics adds background risk, with no breakthrough on Ukraine talks and renewed threats from Russia, but for Nasdaq traders the near-term direction is likely to hinge almost entirely on today’s US data and its implications for Fed policy next week.

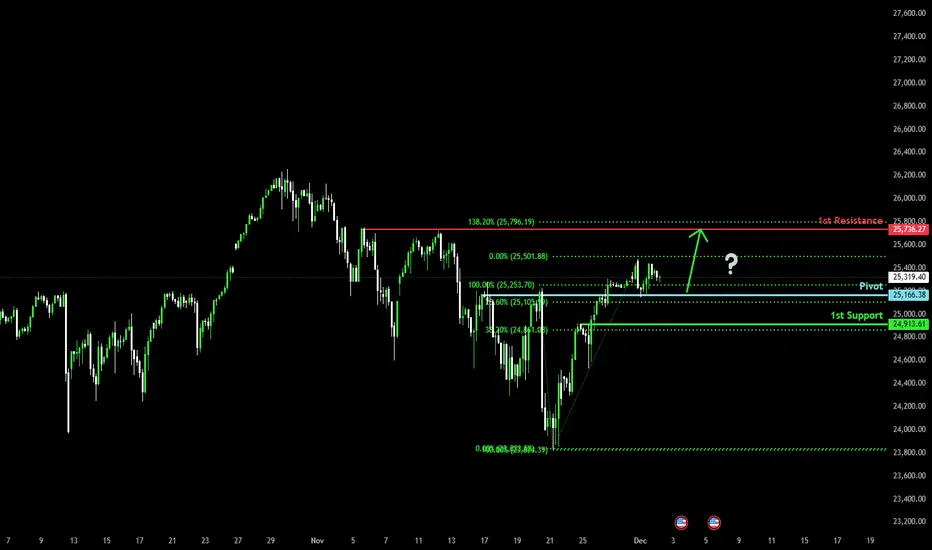
Bullish continuation setup?USTEC has bounced off the pivot and could potentially rise to the 1st resistance.
Pivot: 25,166.38
1st Support: 24,913.61
1st Resistance: 25,736.27
Disclaimer:
The opinions given above constitute general market commentary and do not constitute the opinion or advice of IC Markets or any form of personal or investment advice.
Any opinions, news, research, analyses, prices, other information, or links to third-party sites contained on this website are provided on an "as-is" basis, are intended to be informative only, and are not advice, a recommendation, research, a record of our trading prices, an offer of, or solicitation for, a transaction in any financial instrument and thus should not be treated as such. The information provided does not involve any specific investment objectives, financial situation, or needs of any specific person who may receive it. Please be aware that past performance is not a reliable indicator of future performance and/or results. Past performance or forward-looking scenarios based upon the reasonable beliefs of the third-party provider are not a guarantee of future performance. Actual results may differ materially from those anticipated in forward-looking or past performance statements. IC Markets makes no representation or warranty and assumes no liability as to the accuracy or completeness of the information provided, nor any loss arising from any investment based on a recommendation, forecast, or any information supplied by any third party.
NSDQ100 head into Thanksgiving on a strong noteUS markets head into Thanksgiving on a strong note, with the S&P 500 rising for a fourth straight session (+0.69%) and now sitting just over 1% below its record high. The index has delivered its biggest four-day rally (+4.19%) since the US-China trade truce in May, driven by growing expectations of another Fed rate cut in two weeks and supported by resilient US data.
Trading was disrupted after a technical failure caused a major outage at the Chicago Mercantile Exchange, halting futures and options activity—including Treasuries and S&P 500 futures—and affecting other platforms such as EBS in FX.
Elsewhere, oil is on track for its worst monthly performance since 2023, and equity momentum faded into month-end as markets contended with volatility and concerns around Fed policy and a potential AI-driven bubble.
On the political front, President Trump escalated rhetoric on immigration following the fatal shooting of a National Guard member, proposing drastic restrictions including a pause on admissions from “third world” countries and revoking some naturalized citizenships. He also increased tensions with South Africa, saying he would bar the country from next year’s G20 summit in Miami—a move that breaks established protocol.
With limited news expected on Friday, markets head into the final stretch of November after a turbulent month for global equities.
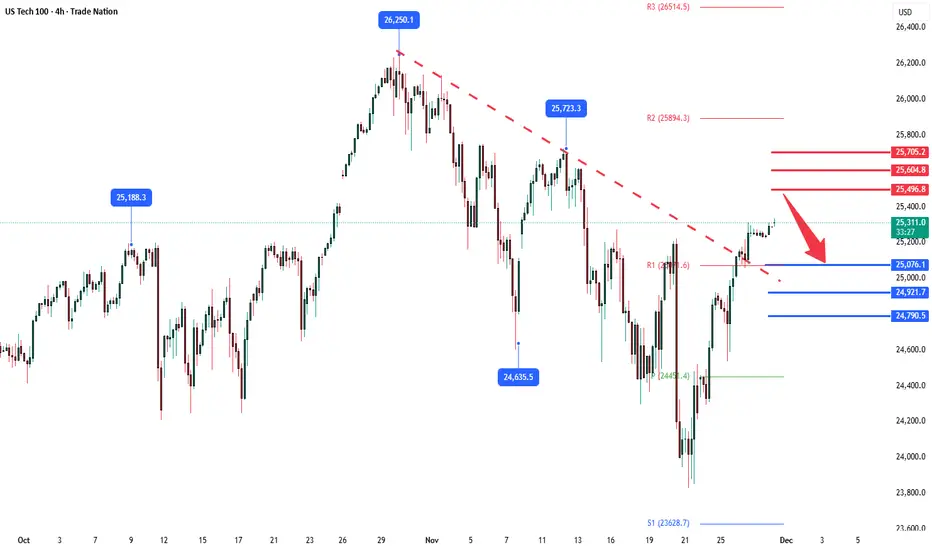
Key Support and Resistance Levels
Resistance Level 1: 25496
Resistance Level 2: 25600
Resistance Level 3: 25700
Support Level 1: 25076
Support Level 2: 25920
Support Level 3: 25790
This communication is for informational purposes only and should not be viewed as any form of recommendation as to a particular course of action or as investment advice. It is not intended as an offer or solicitation for the purchase or sale of any financial instrument or as an official confirmation of any transaction. Opinions, estimates and assumptions expressed herein are made as of the date of this communication and are subject to change without notice. This communication has been prepared based upon information, including market prices, data and other information, believed to be reliable; however, Trade Nation does not warrant its completeness or accuracy. All market prices and market data contained in or attached to this communication are indicative and subject to change without notice.
NSDQ100 oversold rally reaching resistance at 25285Equities:
Risk appetite improved again, with the S&P 500 +0.91% marking a third straight gain, and futures pointing higher this morning (+0.31%). The move was reinforced by a drop in yields, with the 10yr Treasury down to 4.00%, a four-week low.
Drivers of the Rally:
Dovish Fed momentum: Markets leaned further into December rate-cut expectations after softer US data. Bloomberg headlines that Kevin Hassett is now the frontrunner for Fed Chair added to the dovish tilt.
Geopolitics: European equities tracked higher (STOXX 600 +0.91%), supported by reports of progress in Ukraine peace talks.
US Data – All Dovish:
Consumer Confidence (Nov): 88.7, below every estimate and the lowest since April’s turmoil.
ADP private payroll proxy: Averaged –13.5k over the latest four weeks, signalling labour softness.
September revisions:
Retail Sales +0.2% (vs +0.4% expected).
PPI +0.3% (in line), but still consistent with cooling demand.
Stocks in Focus:
Nvidia –2.59% underperformed as Google’s Gemini 3 launch signalled intensifying AI competition.
Geopolitics:
Bloomberg reported the US sent negotiators to meet Putin in Moscow next week to discuss a Ukraine peace proposal, adding to the constructive tone in Europe.
Trading Takeaway
Rates: Further downside bias in yields if today’s data stays soft; the 4.00% level on the 10yr is key support.
Equities: Momentum remains positive, but tech leadership is wobbling—watch for rotation into cyclicals, financials, and Europe.
FX: Dovish Fed expectations should pressure USD on the margins.
Geopolitics: Peace-talk headlines may continue to support European assets and risk sentiment.
Key Support and Resistance Levels
Resistance Level 1: 25285
Resistance Level 2: 25466
Resistance Level 3: 25390
Support Level 1: 24750
Support Level 2: 24600
Support Level 3: 24450
This communication is for informational purposes only and should not be viewed as any form of recommendation as to a particular course of action or as investment advice. It is not intended as an offer or solicitation for the purchase or sale of any financial instrument or as an official confirmation of any transaction. Opinions, estimates and assumptions expressed herein are made as of the date of this communication and are subject to change without notice. This communication has been prepared based upon information, including market prices, data and other information, believed to be reliable; however, Trade Nation does not warrant its completeness or accuracy. All market prices and market data contained in or attached to this communication are indicative and subject to change without notice.

NSDQ100 selling pressure below 24630 resistanceKey Support and Resistance Levels
Resistance Level 1: 24630
Resistance Level 2: 24920
Resistance Level 3: 25100
Support Level 1: 23816
Support Level 2: 23600
Support Level 3: 23300
This communication is for informational purposes only and should not be viewed as any form of recommendation as to a particular course of action or as investment advice. It is not intended as an offer or solicitation for the purchase or sale of any financial instrument or as an official confirmation of any transaction. Opinions, estimates and assumptions expressed herein are made as of the date of this communication and are subject to change without notice. This communication has been prepared based upon information, including market prices, data and other information, believed to be reliable; however, Trade Nation does not warrant its completeness or accuracy. All market prices and market data contained in or attached to this communication are indicative and subject to change without notice.

NASDAQ $NQ US100 Major Levels And PatternsNasdaq bounced yesterday heavily and completed a W pattern. I personally have been able to capture majority of this move. You can consider yesterday's W pattern a sort of double bottom which means hat more bullishness is expected in the medium term.
On a short term, now that it has completed a W pattern and reached previous important zone which had a gap, so we can expect a correction here but this may not be a big one. In a rare case there may not be any correction here at all because NASDAQ is forming a pattern which when forms usually ignores all the smaller W and M patterns.
For that reason my Bias is bullish and I will look for buying opportunities mostly.
There are certain Higher time frame levels that I am watching closely which you will find on the chart.
Trade what you see, manage the risk.
Follow for more. Please support this analysis by liking, commenting, and sharing with friends, colleagues, traders, and trading communities. Thanks👍🙂