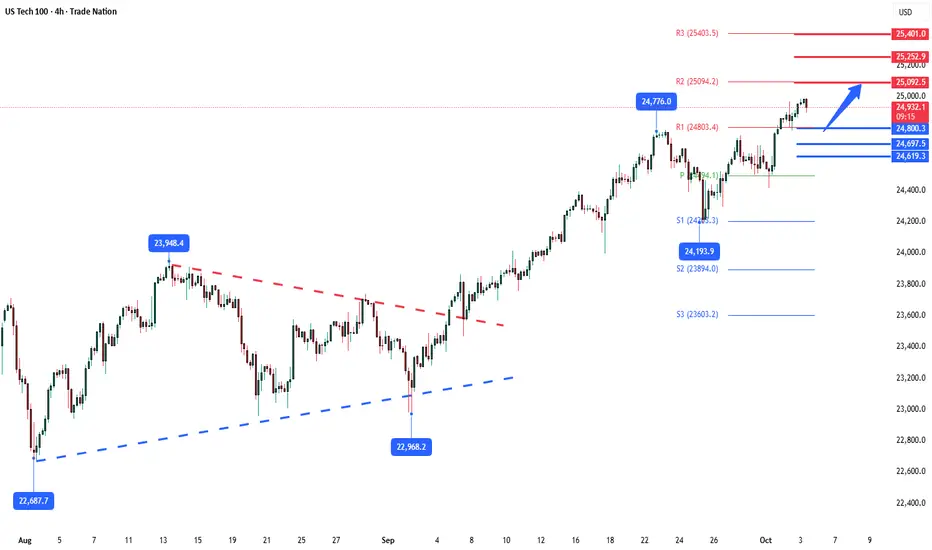
NSDQ100 Key Trading Levels Key Support and Resistance Levels
Resistance Level 1: 25090
Resistance Level 2: 25250
Resistance Level 3: 25400
Support Level 1: 24800
Support Level 2: 24700
Support Level 3: 24620
This communication is for informational purposes only and should not be viewed as any form of recommendation as to a particular course of action or as investment advice. It is not intended as an offer or solicitation for the purchase or sale of any financial instrument or as an official confirmation of any transaction. Opinions, estimates and assumptions expressed herein are made as of the date of this communication and are subject to change without notice. This communication has been prepared based upon information, including market prices, data and other information, believed to be reliable; however, Trade Nation does not warrant its completeness or accuracy. All market prices and market data contained in or attached to this communication are indicative and subject to change without notice.
Ustech100
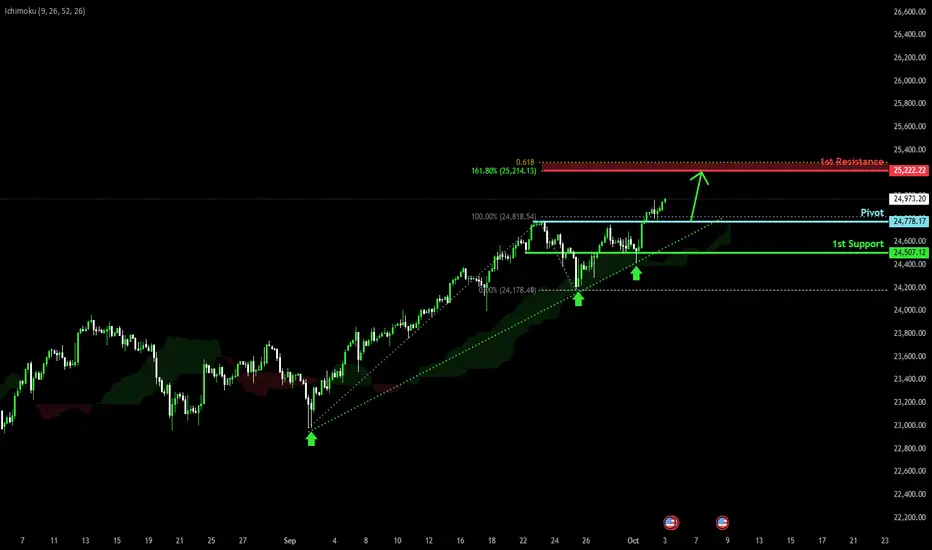
Bullish continuation?USTEC has bounced off the pivot which is a pullback support and could potentially rise to the 1st resistance.
Pivot: 24,778.17
1st Support: 24,507.12
1st Resistance: 25,222.22
Disclaimer:
The above opinions given constitute general market commentary, and do not constitute the opinion or advice of IC Markets or any form of personal or investment advice.
Any opinions, news, research, analyses, prices, other information, or links to third-party sites contained on this website are provided on an "as-is" basis, are intended only to be informative, is not an advice nor a recommendation, nor research, or a record of our trading prices, or an offer of, or solicitation for a transaction in any financial instrument and thus should not be treated as such. The information provided does not involve any specific investment objectives, financial situation and needs of any specific person who may receive it. Please be aware, that past performance is not a reliable indicator of future performance and/or results. Past Performance or Forward-looking scenarios based upon the reasonable beliefs of the third-party provider are not a guarantee of future performance. Actual results may differ materially from those anticipated in forward-looking or past performance statements. IC Markets makes no representation or warranty and assumes no liability as to the accuracy or completeness of the information provided, nor any loss arising from any investment based on a recommendation, forecast or any information supplied by any third-party.
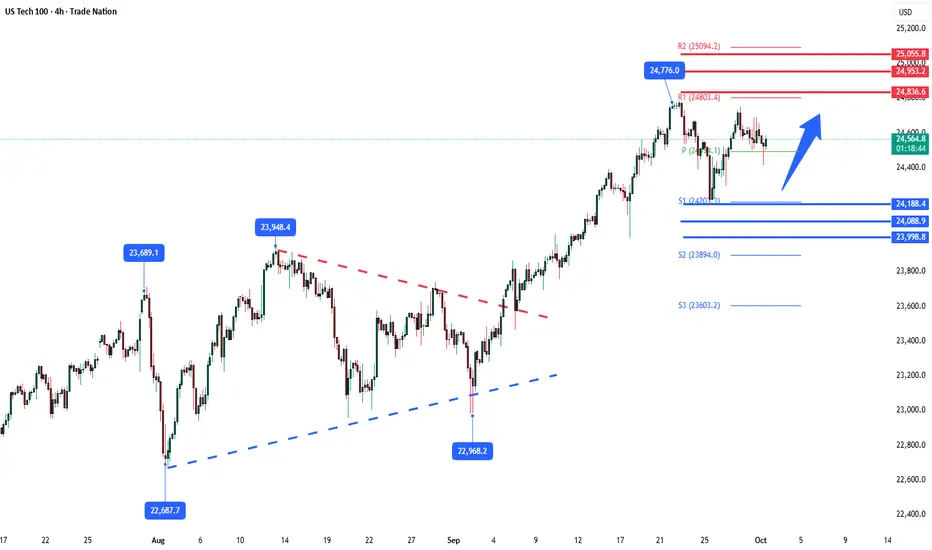
NSDQ100 Key Trading Levels Key Support and Resistance Levels
Resistance Level 1: 24835
Resistance Level 2: 24950
Resistance Level 3: 25055
Support Level 1: 24190
Support Level 2: 24090
Support Level 3: 24000
This communication is for informational purposes only and should not be viewed as any form of recommendation as to a particular course of action or as investment advice. It is not intended as an offer or solicitation for the purchase or sale of any financial instrument or as an official confirmation of any transaction. Opinions, estimates and assumptions expressed herein are made as of the date of this communication and are subject to change without notice. This communication has been prepared based upon information, including market prices, data and other information, believed to be reliable; however, Trade Nation does not warrant its completeness or accuracy. All market prices and market data contained in or attached to this communication are indicative and subject to change without notice.
NASDAQ – Decision Point is Now: Breakout or Breakdown?📈🔍 NASDAQ at Key Inflection – Momentum or Meltdown? ⚠️💥
Hey Traders,
The NASDAQ 100 is now standing right at the make-or-break zone: 22,655. This level marks a critical retest of the recent breakout, and what happens here could define the next major move.
🔵 The Setup:
After a strong bounce and sharp rally from below 18K, we've climbed back into the tight ascending structure. But momentum is slowing…
This zone could produce either a bullish continuation to new highs — or a brutal rejection that unwinds the entire move.
📍 Structure Speaks:
Holding above 22,655 = likely continuation
Breakdown = deeper pullback toward 20,000 and lower channel support
Momentum names like NVIDIA are doing the heavy lifting again — but can they sustain the market alone?
📊 What I'm Watching:
Bullish path = measured target ~25,000+
Bearish path = test of the broader trendline near 20,000 or even the 18,200 region
Macro signals still mixed — stay nimble, not married to one bias
⚠️ Stay Sharp:
Just like in crypto, the Nasdaq can punish both bulls and bears when it enters chop mode. Structure and discipline remain your best defense.
I’ve updated the chart — fresh out the oven 🍞 — and more market ideas are following, including BTC, ETH, and BTC Dominance.
One Love,
The FXPROFESSOR 💙
Disclosure: I am happy to be part of the Trade Nation's Influencer program and receive a monthly fee for using their TradingView charts in my analysis. Awesome broker, where the trader really comes first! 🌟🤝📈

NAS100: CRITICAL BREAKOUT ZONE! 25K Battle Ahead 🚀 NAS100: CRITICAL BREAKOUT ZONE! 25K Battle Ahead 📊
Current Price: 24,507.1 | Date: Sept 27, 2025 ⏰
📈 INTRADAY TRADING SETUPS (Next 5 Days)
🎯 BULLISH SCENARIO
Entry Zone: 24,480 - 24,520 📍
Stop Loss: 24,420 🛑
Target 1: 24,650 🎯
Target 2: 24,800 🚀
🎯 BEARISH SCENARIO
Entry Zone: 24,550 - 24,580 📍
Stop Loss: 24,630 🛑
Target 1: 24,300 🎯
Target 2: 24,150 📉
🔍 TECHNICAL ANALYSIS BREAKDOWN
📊 KEY INDICATORS STATUS:
RSI (14): 58.3 ⚡ *Neutral Zone - Room to Move*
Bollinger Bands: Mid-band Squeeze 🔥
VWAP: 24,465 - Dynamic Support Holding 💪
EMA 50: 24,380 ✅ *Bullish Above Key Level*
Volume: Declining 📊 *Awaiting Catalyst*
🌊 WAVE ANALYSIS:
Elliott Wave: Wave 4 Correction Complete 🌊
Next Target: Wave 5 Extension to 25,200+ 🎯
🔄 HARMONIC PATTERNS:
Bullish Bat Pattern Active at 24,450 ✨
ABCD Completion targeting 24,750 🔄
⚖️ SWING TRADING OUTLOOK (1-4 Weeks)
🚀 BULLISH TARGETS:
Weekly Resistance: 24,850 🏆
Monthly Target: 25,200 🌙
Gann Square of 9: 25,000 ⭐
📉 BEARISH INVALIDATION:
Weekly Support: 24,200 ⚠️
Critical Level: 24,000 🚨
🎭 MARKET STRUCTURE:
Trend: Consolidating Bullish 💪
Momentum: Building Energy 🔥
Wyckoff Phase: Re-accumulation 📈
Ichimoku: Neutral Cloud 🟡
🔥 CRITICAL LEVELS TO WATCH:
Resistance: 24,600 | 24,750 | 25,000 🚧
Support: 24,350 | 24,200 | 24,000 🛡️
Breakout Trigger: 24,580 confirmed close 💥
⚡ RISK MANAGEMENT:
Max Risk per Trade: 1.5% 🛡️
R:R Ratio: Minimum 1:3 ⚖️
Position Size: Conservative in Range 📏
🌍 MARKET CATALYSTS:
Tech Earnings Season Approaching 💼
Fed Policy Impact on Growth Stocks 🏛️
AI/Tech Momentum Driving Index 🤖
🎯 FINAL VERDICT:
NAS100 coiling for EXPLOSIVE MOVE! 🚀
25K psychological level in sight! 💥
Watch for volume spike above 24,580 👀
Trade Management: Scale in on pullbacks to VWAP 📈
Key Decision Zone: 24,500-24,600 battle crucial ⚔️
---
*⚠️ Disclaimer: Trading involves risk. Use proper risk management. This analysis is for educational purposes only.*
For individuals seeking to enhance their trading abilities based on the analyses provided, I recommend exploring the mentoring program offered by Shunya Trade. (Website: shunya dot trade)
I would appreciate your feedback on this analysis, as it will serve as a valuable resource for future endeavors.
Sincerely,
Shunya.Trade
Website: shunya dot trade
🔔 Follow for Daily Updates | 💬 Share Your NAS100 Strategy

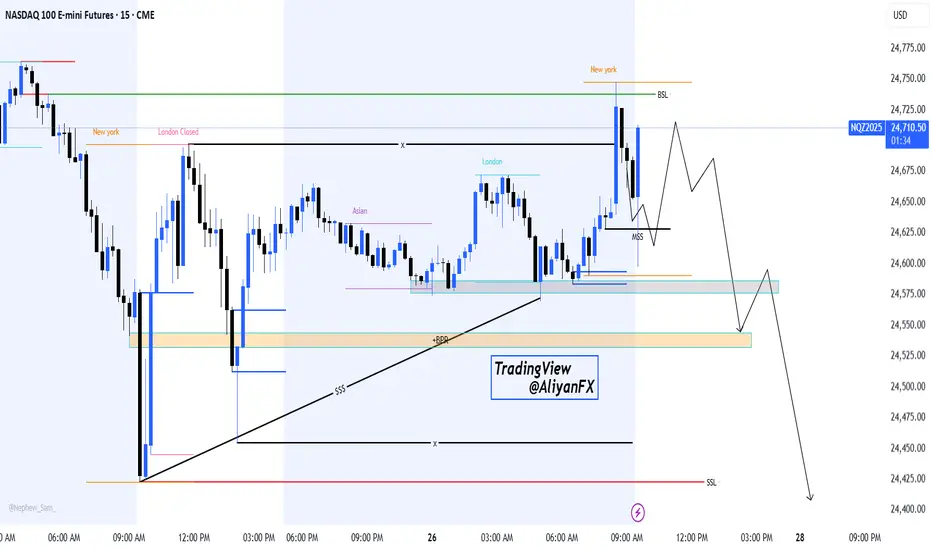
NASDAQ 100 – Potential Liquidity Grab & Bearish Continuation SetHello Billionaires!!
We All know that the Price has swept the New York session high (BSL) and is now showing signs of a potential market structure shift (MSS). If the short-term pullback holds, we may see a deeper retracement toward the demand zone (BPR + Asian range) before another leg down.
🔹Key Levels to Watch:
24,725 – 24,750: Liquidity grab zone (recent NY high)
24,575 – 24,550: Re-test area for possible continuation
24,500 – 24,450: Next downside target if bearish momentum continues
Bias: Short-term retracement followed by potential bearish continuation toward lower liquidity pools (SSL).
📌 This is an educational projection, not financial advice. Trade safe and always manage your risk!
Nasdaq slipped as investors balanced Fed signalsThe Nasdaq 100 (-0.87%) fell as tech stocks weakened. Uncertainty around Nvidia’s $100bn OpenAI deal led the reversal after Monday’s gains.
Powell’s comments added to caution: he repeated that risks remain on both inflation and jobs, but also admitted to “meaningful weakness” in the labour market. This helped bonds rally, but not equities.
Extra pressure came from US government shutdown concerns, while gold hit a record high ($3,764/oz) as investors shifted to a defensive.
Tech momentum cooled, and the Nasdaq slipped as investors balanced Fed signals, policy risks, and stretched valuations.
Key Support and Resistance Levels
Resistance Level 1: 24830
Resistance Level 2: 24950
Resistance Level 3: 25055
Support Level 1: 24412
Support Level 2: 24300
Support Level 3: 24190
This communication is for informational purposes only and should not be viewed as any form of recommendation as to a particular course of action or as investment advice. It is not intended as an offer or solicitation for the purchase or sale of any financial instrument or as an official confirmation of any transaction. Opinions, estimates and assumptions expressed herein are made as of the date of this communication and are subject to change without notice. This communication has been prepared based upon information, including market prices, data and other information, believed to be reliable; however, Trade Nation does not warrant its completeness or accuracy. All market prices and market data contained in or attached to this communication are indicative and subject to change without notice.

NSDQ100 volatility, triple-witching could exaggerate swings.Nasdaq 100 Trading Drivers
Macro backdrop:
US data came in strong:
Jobless claims fell to 231k (vs. 240k exp; prior 264k).
Continuing claims declined to 1.92m (vs. 1.95m exp).
Philly Fed survey surged to 23.2 (vs. 1.7 exp), an 8-month high.
This eased US slowdown fears and reinforced risk-on sentiment.
Equities:
Nasdaq +0.94% → new record high.
Tech/semis led: Intel (+22.8%) strongest S&P performer after Nvidia’s $5bn investment and US gov’t stake news. Philadelphia Semiconductor Index +3.6%.
Momentum broadened → Russell 2000 +2.5%, first record high since 2021.
Rates:
Treasuries sold off on strong data → 10yr yield +1.7bps to 4.11%, 30yr +3.4bps. Higher yields a potential headwind if sustained.
Event risk:
Trump–Xi call (9 a.m. ET): key for TikTok’s US future & broader trade tone. Risk of mixed headlines given tensions (China soybeans skip, Gaza criticism, Taiwan aid freeze).
BoJ surprise: announced unwind of $4.2bn/year ETF holdings → dampened global risk tone.
US triple-witching: options/futures expiries today → elevated intraday volatility likely.
Nasdaq 100 Trading Takeaway
Bullish momentum intact: record highs fueled by tech & semiconductor leadership.
Short-term watchpoints: Trump–Xi headlines and BoJ shift may inject volatility; triple-witching could exaggerate swings.
Key risk: rising US yields may cap upside if bond sell-off deepens.
Bias: Still risk-on / buy dips near-term, but position sizing should account for headline-driven volatility today.
Key Support and Resistance Levels
Resistance Level 1: 24600
Resistance Level 2: 24710
Resistance Level 3: 24800
Support Level 1: 24210
Support Level 2: 24085
Support Level 3: 24940
This communication is for informational purposes only and should not be viewed as any form of recommendation as to a particular course of action or as investment advice. It is not intended as an offer or solicitation for the purchase or sale of any financial instrument or as an official confirmation of any transaction. Opinions, estimates and assumptions expressed herein are made as of the date of this communication and are subject to change without notice. This communication has been prepared based upon information, including market prices, data and other information, believed to be reliable; however, Trade Nation does not warrant its completeness or accuracy. All market prices and market data contained in or attached to this communication are indicative and subject to change without notice.
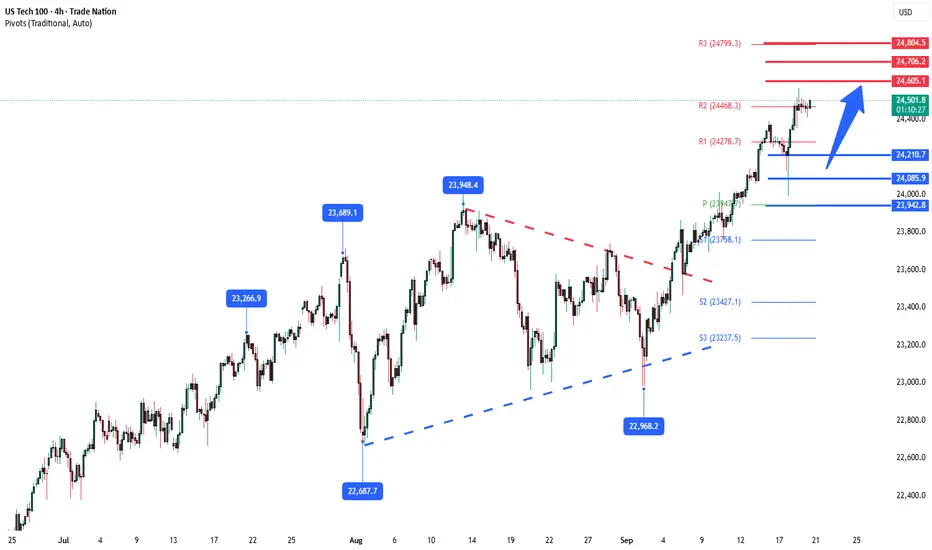
NSDQ100 awaits Fed rate decision supported at 23940Nasdaq 100 Trading Takeaways
Fed in focus: Markets expect a 25bp cut today, though risks of larger/smaller moves exist with potential dissents on both dovish and hawkish sides. Trump’s newly sworn-in appointee Miran may push for 50bp, while Schmid could dissent hawkishly. This adds event risk and volatility for tech stocks.
Macro backdrop: Trump state visit to the UK highlights investment pledges and a potential US-UK tech partnership, which could support sentiment in large-cap tech.
Market moves:
S&P 500 (-0.13%) pulled back from record highs.
Nasdaq leadership held firm: Magnificent 7 (+0.55%) hit a new record, showing resilience even as breadth weakened.
Broader weakness evident – third straight day of more decliners than advancers.
Sector divergence: Energy (+1.73%) outperformed on higher Brent crude (+1.53%), but tech still provided upside leadership.
Implication for Nasdaq 100:
Short-term: Expect heightened sensitivity to Fed outcome – dovish signals/50bp risk would boost mega-cap tech, while hawkish dissent could trigger profit-taking.
Medium-term: Tech remains the relative outperformer, with new highs in the Magnificent 7 signaling continued defensive growth positioning despite weaker breadth.
Key Support and Resistance Levels
Resistance Level 1: 24470
Resistance Level 2: 24600
Resistance Level 3: 24800
Support Level 1: 23940
Support Level 2: 23760
Support Level 3: 23430
This communication is for informational purposes only and should not be viewed as any form of recommendation as to a particular course of action or as investment advice. It is not intended as an offer or solicitation for the purchase or sale of any financial instrument or as an official confirmation of any transaction. Opinions, estimates and assumptions expressed herein are made as of the date of this communication and are subject to change without notice. This communication has been prepared based upon information, including market prices, data and other information, believed to be reliable; however, Trade Nation does not warrant its completeness or accuracy. All market prices and market data contained in or attached to this communication are indicative and subject to change without notice.

NSDQ100 bullish reaction to rate-cut expectationsUS CPI and a sharp rise in jobless claims (+263k vs. +235k expected, Texas-driven distortions aside) reinforced the narrative of a cooling labour market. Equities rallied on the lower rates outlook: S&P 500 (+0.85%) and Nasdaq (+0.72%) closed at fresh records, with the Magnificent 7 up +1.13%. Breadth was strong (436 S&P advancers, Russell 2000 +1.83%). Oracle (-6.23%) was a notable laggard after recent gains. Meanwhile, OpenAI’s potential $100bn+ restructuring with Microsoft and a UK data center buildout highlight continued AI momentum. On the geopolitical front, US-China talks (Bessent–He Lifeng) and a possible Xi-Trump meeting, plus progress with India, suggest tentative thawing in trade and tech relations.
Conclusion (Nasdaq-100):
The combination of softer labour data, rate-cut expectations, and sustained AI optimism is a constructive backdrop for the Nasdaq-100. Short-term pullbacks (e.g., Oracle) appear stock-specific, while breadth and AI-linked capex support further upside. Near-term, dips remain buyable unless geopolitics disrupt risk sentiment.
Key Support and Resistance Levels
Resistance Level 1: 24200
Resistance Level 2: 24380
Resistance Level 3: 24600
Support Level 1: 23500
Support Level 2: 23320
Support Level 3: 23125
This communication is for informational purposes only and should not be viewed as any form of recommendation as to a particular course of action or as investment advice. It is not intended as an offer or solicitation for the purchase or sale of any financial instrument or as an official confirmation of any transaction. Opinions, estimates and assumptions expressed herein are made as of the date of this communication and are subject to change without notice. This communication has been prepared based upon information, including market prices, data and other information, believed to be reliable; however, Trade Nation does not warrant its completeness or accuracy. All market prices and market data contained in or attached to this communication are indicative and subject to change without notice.

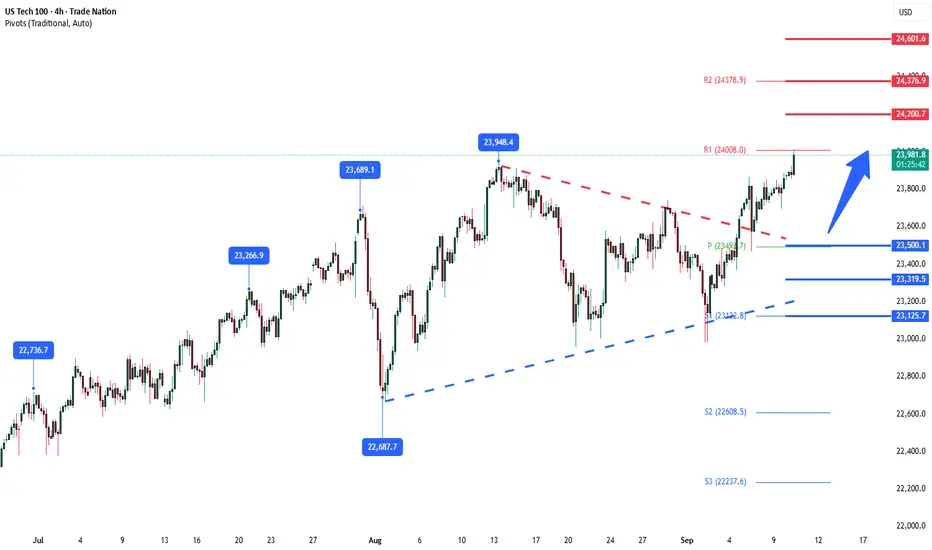
NSDQ100 Bullish breakout support at 23500Key Developments
US labor market revisions: BLS cut payrolls by -911k through March 2025, implying weaker labor conditions than thought. Markets took it in stride, with rate cut pricing steady at ~27bps for next week (-1.5bps on day).
Fed outlook: Treasury Secretary Bessent urged recalibration of policy, echoing Trump’s criticism of “choking off growth.” Governor Lisa Cook remains in her role after a court blocked Trump’s attempt to remove her, ensuring full FOMC participation next week.
Geopolitics:
Middle East: Israel’s strike on Hamas leaders in Qatar drew criticism from Trump, seen as not aiding conflict resolution.
Europe: Poland shot down drones from a Russian strike on Ukraine, escalating tensions with Moscow.
Market Takeaways
Payroll downgrades confirm a weaker labor backdrop but don’t materially change Fed cut expectations for September.
Political noise around the Fed could fuel uncertainty, but markets are treating it as background risk.
Geopolitical tensions remain elevated but had limited immediate market impact.
Conclusion for Nasdaq 100
The Nasdaq 100 is likely to remain steady to slightly supported:
Weaker labor revisions reduce concerns about overheating, reinforcing the Fed cut narrative.
Limited geopolitical spillover into tech equities so far.
Bond yields and Fed pricing, not payroll revisions, remain the key driver.
Key Support and Resistance Levels
Resistance Level 1: 24200
Resistance Level 2: 24380
Resistance Level 3: 24600
Support Level 1: 23500
Support Level 2: 23320
Support Level 3: 23125
This communication is for informational purposes only and should not be viewed as any form of recommendation as to a particular course of action or as investment advice. It is not intended as an offer or solicitation for the purchase or sale of any financial instrument or as an official confirmation of any transaction. Opinions, estimates and assumptions expressed herein are made as of the date of this communication and are subject to change without notice. This communication has been prepared based upon information, including market prices, data and other information, believed to be reliable; however, Trade Nation does not warrant its completeness or accuracy. All market prices and market data contained in or attached to this communication are indicative and subject to change without notice.
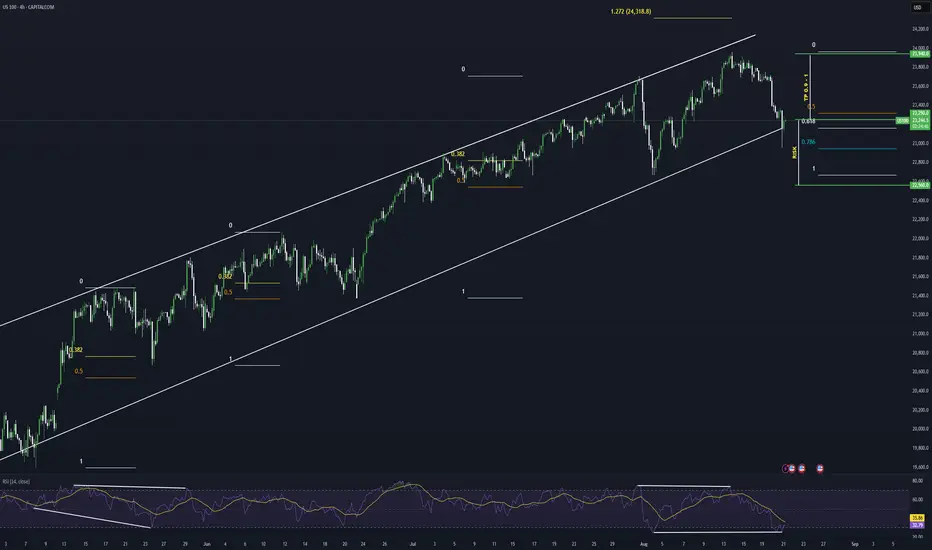
NASDAQ Potential Bullish ContinuationNASDAQ price action seems to exhibit signs of potential Bullish momentum as the price action may form a credible Higher Low with multiple confluences through key Fibonacci and Support levels which presents us with a potential long opportunity.
Trade Plan:
Entry : 23250
Stop Loss : 22560
TP 0.9 - 1: 23870 - 23940
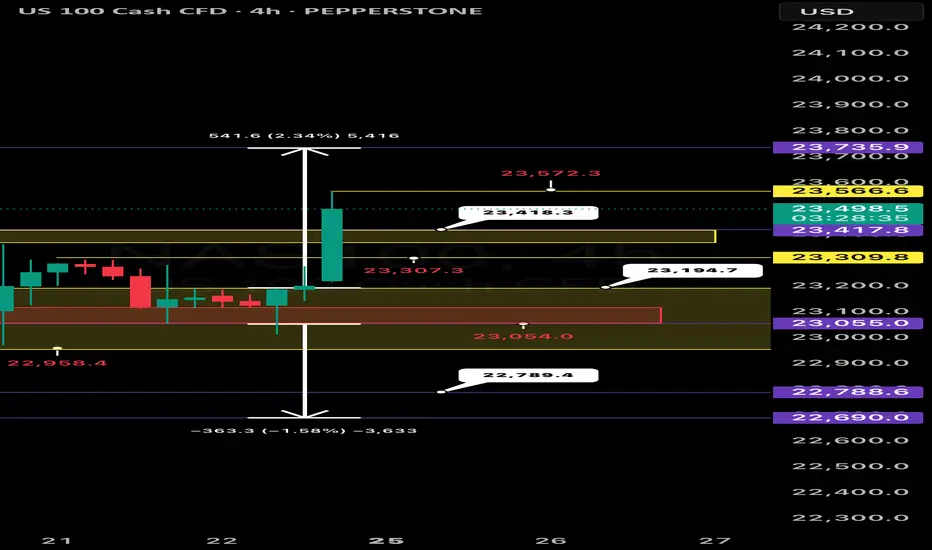
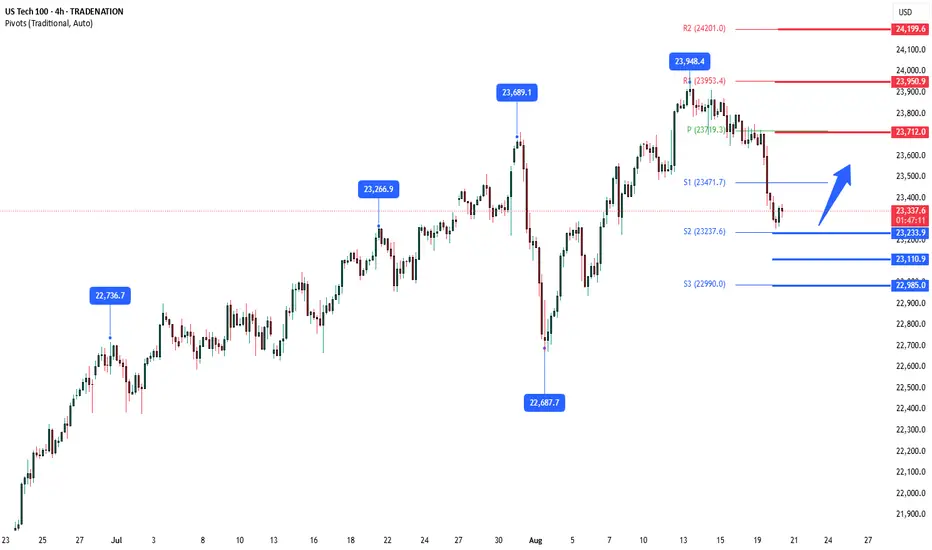
Nasdaq “Tug of war”
Nasdaq 100 has recently shown a significant shift in momentum on the 4hour chart, with bearish pressure taking hold. After a strong upward trend, the index has experienced a sharp decline, now consolidating within a critical range. The key to the next major move lies in the defence or failure of the defined support and resistance levels.
Current Market & Price Action
The price action clearly indicates a period of bearish dominance, marked by a substantial selloff from recent highs. The price is currently contained below a key resistance level at 23,515.6, which had previously acted as support. This consolidation phase is critical and suggests a tug of war between bulls and bears. The current price hovers around 23,406, leaving both a bullish reversal and a bearish continuation as plausible outcomes.
The Bearish Case : Reaching for 23,000
If the price continues to face rejection at the 23,515.6 level, the path of least resistance is to the downside. The next major target for sellers is the significant support zone between 23,000 and 22,900. This level is not only a major psychological number but also represents a strong structural support zone from previous price action.
A confirmed break below the current consolidation range, particularly the 23,331.4 level, would signal a continuation of the downtrend. A move to the 23,000-22,900 zone represents a potential drop of approximately 1.36%, as measured on the chart. Traders should watch for a decisive break of this support, which could trigger a much larger sell off.
The Bullish Case:
Reclaiming Momentum
For the bullish narrative to resume, the index must convincingly break and hold above the 23,515.6 resistance. A strong close above this level on the 4hour chart would invalidate the immediate bearish outlook and signal a potential reversal. If this occurs, the next logical target would be the higher resistance at 23,757.2, marking a potential recovery of the recent losses.
This bullish scenario would likely be fueled by a positive catalyst, such as favorable economic data or dovish comments from the Federal Reserve, which the market is currently anticipating. A successful break and retest of 23,515.6 would serve as a key entry signal for buyers aiming for higher levels.
Key Contextual Factors
Recent economic data and Federal Reserve policy expectations are likely to be major drivers for the Nasdaq's next move. As of early September, a rate cut by the Federal Reserve is heavily priced in, with some analysts predicting a move in the upcoming FOMC meeting. Any surprises to this expectation, either in a more hawkish or unexpectedly dovish direction, could trigger significant volatility. The tech heavy Nasdaq is particularly sensitive to interest rate policy, as it impacts company valuations and financing.
Summary and Outlook
Nasdaq 100 is at a pivotal point. The price is currently trapped between the 23,515 resistance and the 23,331 support.
* Bearish Trigger: A sustained break below 23,331.4 could lead to a test of the 23,000-22,900 support zone.
* Bullish Trigger: A decisive break above 23,515.6 could target the 23,757 resistance.
Given the recent price action and broader market uncertainty, the immediate risk appears to be to the downside. However, the market's direction will be confirmed by which of these critical levels is breached first.

NSDQ100 corrective pullback support at 23420US Macro:
Q2 headline PCE revised down: +2.0% (vs +2.1%), core PCE steady: +2.5%.
Jobless claims: 229k (vs 230k), continuing 1.954m (vs 1.966m).
→ Soft-landing narrative reinforced, easing recession fears.
US Equities:
S&P 500 +0.32% → 3rd straight gain, fresh ATH.
NASDAQ +0.53% led by tech.
Nvidia -0.79% on slowing revenue growth post-earnings.
Europe:
STOXX 600 -0.20%, FTSE 100 -0.42% lagged.
Eurozone econ sentiment index fell to 95.2 vs 96.0 exp. → weaker sentiment backdrop.
What’s next:
US July PCE inflation + spending data (today) → key for Fed path.
Eurozone CPI flash (Germany/France/Italy) → ECB watch.
Japan Tokyo CPI + activity data → BoJ implications.
Alibaba/BYD earnings → China sentiment gauge.
Key Support and Resistance Levels
Resistance Level 1: 23760
Resistance Level 2: 23880
Resistance Level 3: 23760
Support Level 1: 23420
Support Level 2: 23276
Support Level 3: 23050
This communication is for informational purposes only and should not be viewed as any form of recommendation as to a particular course of action or as investment advice. It is not intended as an offer or solicitation for the purchase or sale of any financial instrument or as an official confirmation of any transaction. Opinions, estimates and assumptions expressed herein are made as of the date of this communication and are subject to change without notice. This communication has been prepared based upon information, including market prices, data and other information, believed to be reliable; however, Trade Nation does not warrant its completeness or accuracy. All market prices and market data contained in or attached to this communication are indicative and subject to change without notice.

Bearish drop off?USTEC has rejected off the pivot and could drop to the 1st support which acts as a multi swing low support.
Pivot: 23,523.60
1st Support: 22,967.13
1st Resistance: 23,920.26
Risk Warning:
Trading Forex and CFDs carries a high level of risk to your capital and you should only trade with money you can afford to lose. Trading Forex and CFDs may not be suitable for all investors, so please ensure that you fully understand the risks involved and seek independent advice if necessary.
Disclaimer:
The above opinions given constitute general market commentary, and do not constitute the opinion or advice of IC Markets or any form of personal or investment advice.
Any opinions, news, research, analyses, prices, other information, or links to third-party sites contained on this website are provided on an "as-is" basis, are intended only to be informative, is not an advice nor a recommendation, nor research, or a record of our trading prices, or an offer of, or solicitation for a transaction in any financial instrument and thus should not be treated as such. The information provided does not involve any specific investment objectives, financial situation and needs of any specific person who may receive it. Please be aware, that past performance is not a reliable indicator of future performance and/or results. Past Performance or Forward-looking scenarios based upon the reasonable beliefs of the third-party provider are not a guarantee of future performance. Actual results may differ materially from those anticipated in forward-looking or past performance statements. IC Markets makes no representation or warranty and assumes no liability as to the accuracy or completeness of the information provided, nor any loss arising from any investment based on a recommendation, forecast or any information supplied by any third-party.

NSDQ100 awaits Fed Powwell's tone at Jackson Hole Key Drivers
Powell @ Jackson Hole (10am EST):
July FOMC was hawkish on labour, but payroll revisions weaker since → tone today could soften.
Market focus: whether Powell leans on labour weakness vs still-solid inflation & activity.
Outcome = pivotal for Fed cut expectations and tech valuations.
Macro/Policy Noise:
Halts & policy risks: immigration and visa restrictions could tighten labour supply, indirectly feeding wage/inflation concerns. NIH funding cuts add fiscal uncertainty.
Geopolitical chip tension: Nvidia halting H20 AI chip production under Beijing pressure raises supply-chain risk. Negative for semi names in the NASDAQ-100 (NVDA, AMD, AVGO).
US stance on chipmakers: No forced equity stakes → removes one overhang, but policy risk still high.
NASDAQ-100 Implications
Powell dovish → likely risk-on, tech rally (rate-sensitive growth).
Powell hawkish / inflation-first → risk-off, higher yields weigh on big tech multiples.
Chip news: Nvidia headline is a near-term drag; could spill over to the semiconductor complex (SOX index).
Net read:
Short-term cautious bias into Powell due to Nvidia headline + policy noise.
Direction after 10am EST depends on Fed tone—dovish shift = upside reversal, hawkish = further pressure on NASDAQ-100.
Key Support and Resistance Levels
Resistance Level 1: 23480
Resistance Level 2: 23720
Resistance Level 3: 23950
Support Level 1: 23100
Support Level 2: 22985
Support Level 3: 22740
This communication is for informational purposes only and should not be viewed as any form of recommendation as to a particular course of action or as investment advice. It is not intended as an offer or solicitation for the purchase or sale of any financial instrument or as an official confirmation of any transaction. Opinions, estimates and assumptions expressed herein are made as of the date of this communication and are subject to change without notice. This communication has been prepared based upon information, including market prices, data and other information, believed to be reliable; however, Trade Nation does not warrant its completeness or accuracy. All market prices and market data contained in or attached to this communication are indicative and subject to change without notice.

NSDQ100 corrective pullback supported at 23233Tech drag dominates: The NASDAQ fell -1.46%, its worst day since Aug 1, led by the Magnificent 7 (-1.67%). Nvidia (-3.5%) was the biggest loser and set the tone for semis and AI-linked names.
Index divergence: Despite the cap-weighted S&P falling (-0.59%), the equal-weighted S&P rose (+0.45%), showing the selloff was tech-concentrated rather than broad. That highlights rotation into cyclicals/defensives away from mega-cap tech.
Stock specifics:
Intel (+6.97%) surged on the $2bn SoftBank stake, bucking the chip weakness.
Home Depot (+3.17%) outperformed on earnings, showing consumer/housing resilience—positive for broader equities but less relevant for tech.
Rates backdrop: 10yr UST yields fell -2.7bps to 4.31% after S&P affirmed the US AA+ rating. Lower yields normally support growth/tech, but today’s positioning and rotation outweighed rate relief.
Fed/policy watch:
Treasury Sec. Bessent hinted at Fed Chair decision timing (Powell’s replacement watch).
Markets remain priced for a jumbo cut in September, with focus shifting to Jackson Hole this week—key risk event for Nasdaq given rate-cut sensitivity.
Geopolitics: Noise around Ukraine security guarantees and Switzerland’s peace-talk stance was not market-moving for tech.
Relevance for NASDAQ100 traders:
Yesterday’s selloff was tech-specific, not broad market weakness, implying concentration risk in mega-caps.
Intel’s rally shows idiosyncratic catalysts can break correlation.
Watch Jackson Hole & Fed rate-cut pricing → likely main driver for Nasdaq100 short-term.
Rotation risk: If the equal-weighted S&P keeps outperforming, the Nasdaq may underperform further unless big tech regains leadership.
Key Support and Resistance Levels
Resistance Level 1: 23710
Resistance Level 2: 23950
Resistance Level 3: 24200
Support Level 1: 23233
Support Level 2: 23110
Support Level 3: 22985
This communication is for informational purposes only and should not be viewed as any form of recommendation as to a particular course of action or as investment advice. It is not intended as an offer or solicitation for the purchase or sale of any financial instrument or as an official confirmation of any transaction. Opinions, estimates and assumptions expressed herein are made as of the date of this communication and are subject to change without notice. This communication has been prepared based upon information, including market prices, data and other information, believed to be reliable; however, Trade Nation does not warrant its completeness or accuracy. All market prices and market data contained in or attached to this communication are indicative and subject to change without notice.
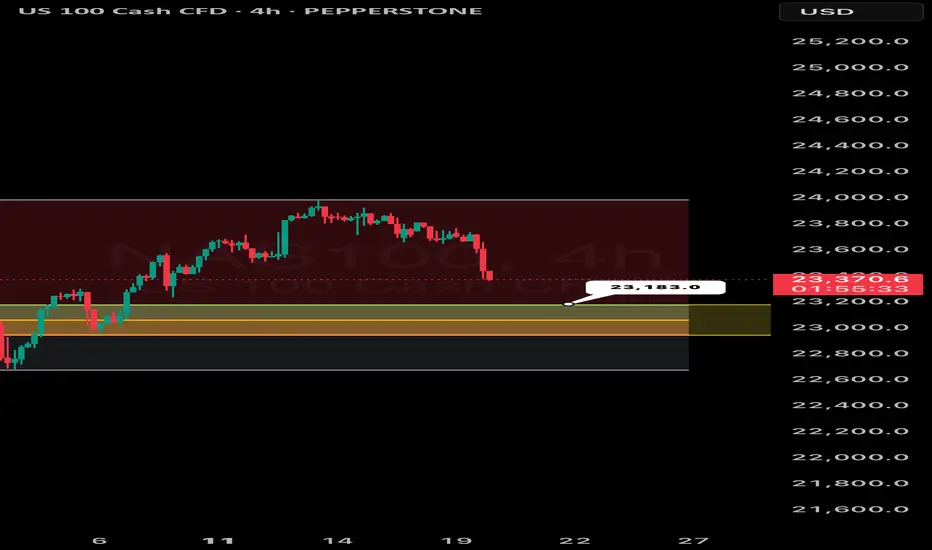
NASDAQ 100 (NAS100) potential reversal The NASDAQ 100 (NAS100 ) on the H4 timeframe it appears to be undergoing a period of consolidation within a defined range. As of approximately 20:46 (based on the timestamp), the index is trading around 23,383.6, having experienced a decline of -1.41% or 334.3 points.
Key Observations:
Recent Downtrend and Support Zone : The price action shows a clear downtrend leading into the current consolidation. The highlighted yellow zone around the 23,100 - 23,300 level seems to be acting as a support zone, preventing further immediate declines.
Resistance Zone : Conversely, an upper red zone around the 23,800 - 24,000 level is acting as resistance, capping the upside for the time being.
Range Bound Movement : The price is currently oscillating between these two defined zones, indicating a period of indecision in the market.
Potential Reversal Area : The fact that the support zone is holding after a significant down move suggests the possibility of a short-term reversal if buyers step in with conviction. However, this needs confirmation with a break above the resistance zone.
Breakout Scenarios :
Bullish Breakout: A sustained break above the 24,000 level could signal a continuation of an upward trajectory, potentially targeting previous highs.
Bearish Breakdown : Possibly, a break below the 23,100 level would likely confirm further downside pressure and could lead to testing lower support levels.
Technical Considerations :
Traders and investors should closely monitor price action within these zones. Look for confirmation signals such as strong candlestick patterns (e.g., bullish engulfing, bearish engulfing) or increasing volume on breakouts to gauge the strength and validity of potential moves.
Conclusion :
NASDAQ 100 is currently in a critical juncture. The consolidation within a potential reversal zone after a downtrend warrants careful observation. The direction of the next significant move will likely be determined by whether the support or resistance zone is broken decisively.
USTECH Long Opportunity USTECH has been making some bullish strides and continues the overall bullish trend. Last week, price broke above the major pivot level at $23680 and seems to be maintaining its bullish structure
Price is currently in a retracement and is testing the $23680 level where i am expecting a bounce to the upside in continuation with the bullish trend.
From the higher timeframes price is trading above all 3 SMA and in the bullish region of the RSI. on the 1 hour timeframe, price is maintaining its position above the Bullish support trendline and the 200 SMA which adds to the bullish move i am looking at.
Alternatively if price continues to move down, i am targeting the support level at $23520 where buyers are sitting and having enough momentum to push the market higher.
Looking for long positions from either the $23680 or alternatively the $23520 level.

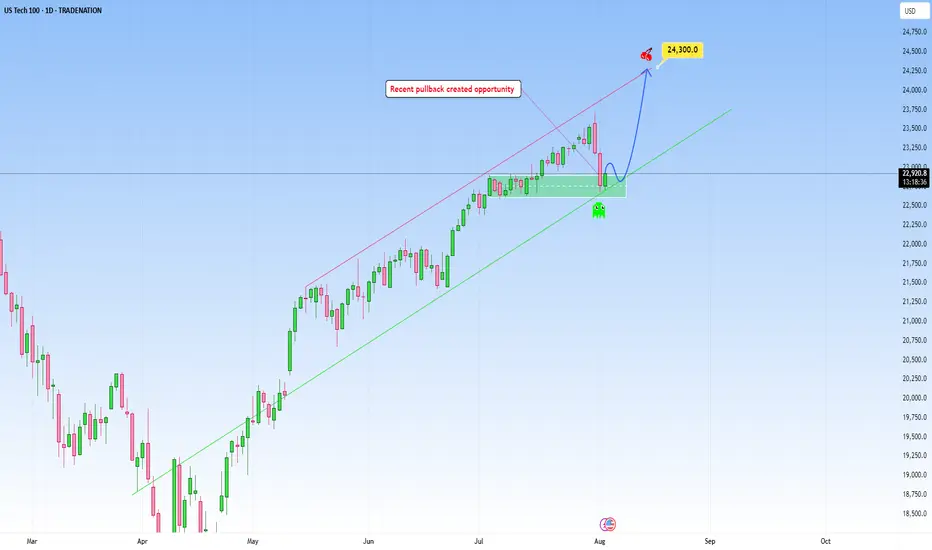
USTEC: Likely continuation following pullbackNAS100 climbed a steep uptrend and my expectation is for a continuation as marked on my chart, with an upside target at around 24,300.
This area here is where it can become a decision point, either price finds support and bounces, or it breaks below, and that’s when we might see the move start to extend lower.
If I were to take a side here, I would definitely choose more upside, but again only price action should determine next move.
But if price breaks below the trendline with conviction, it would invalidate the bullish scenario, suggesting that the uptrend may pause or could even reverse short-term.
Just sharing my thoughts for the charts, this isn’t financial advice. Always confirm your setups and manage your risk properly.
Disclosure: I am part of Trade Nation's Influencer program and receive a monthly fee for using their TradingView charts in my analysis.
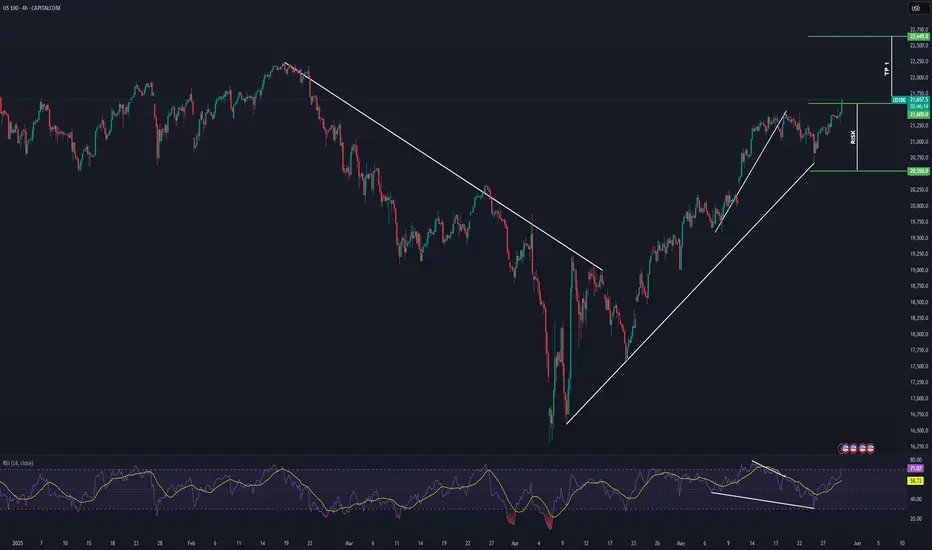
NASDAQ Potential Bullish ContinuationNASDAQ price action seems to exhibit signs of potential Bullish momentum as the price action may form a credible Higher High (after tarriff delays on the EU) with multiple confluences through key Fibonacci and Support levels which presents us with a potential long opportunity.
Trade Plan:
Entry : 21600
Stop Loss : 20550
TP 1: 22649
NSDQ100 sideways consolidation support at 23664Yesterday’s market action flipped from Wednesday’s pattern, with US Treasury yields jumping (10yr +5.1bps) after a much hotter-than-expected July Producer Price Index. Headline PPI surged +0.9% MoM (+3.3% YoY) vs. +0.2%/+2.5% expected — the largest monthly gain since March 2022 — and core PPI rose +0.6% MoM (+2.8% YoY) vs. +0.2%/+2.5% expected. The surprise beat every Bloomberg economist’s forecast and dims the chances of a September Fed rate cut. However, PPI components tied to core PCE — the Fed’s preferred inflation gauge — showed only a modest uptick (+0.29% vs. +0.26%), offering some relief. Despite rate cut bets being pared back, the S&P 500 still closed slightly higher (+0.03%), logging a third straight record high.
Geopolitical note:
Trump and Putin are set to meet in Alaska tonight over Ukraine, with low expectations for an immediate breakthrough.
Conclusion for NASDAQ-100:
The hotter inflation print and higher yields introduce near-term headwinds, especially for rate-sensitive growth stocks. However, the market’s resilience yesterday suggests bullish momentum remains intact for now — but upside in the NASDAQ-100 may be capped until inflation data eases or Fed policy expectations shift dovishly again.
Key Support and Resistance Levels
Resistance Level 1: 23965
Resistance Level 2: 24120
Resistance Level 3: 24290
Support Level 1: 23664
Support Level 2: 23533
Support Level 3: 23422
This communication is for informational purposes only and should not be viewed as any form of recommendation as to a particular course of action or as investment advice. It is not intended as an offer or solicitation for the purchase or sale of any financial instrument or as an official confirmation of any transaction. Opinions, estimates and assumptions expressed herein are made as of the date of this communication and are subject to change without notice. This communication has been prepared based upon information, including market prices, data and other information, believed to be reliable; however, Trade Nation does not warrant its completeness or accuracy. All market prices and market data contained in or attached to this communication are indicative and subject to change without notice.
