NQ at Crossroads: AI Optimism Meets Auction Reality1. Macro Context and Narrative
The Nasdaq continues to trade at the intersection of macro-optimism and valuation sensitivity. The underlying narrative remains dominated by growth expectations, policy signaling, and the ongoing AI investment cycle. While rate volatility and geopolitical headlines continue to inject short term noise, the broader sentiment surrounding NQ remains constructive, albeit increasingly selective.
AI remains the central driver of price discovery in the index. Capital expenditure commitments tied to data centers, semiconductors, and cloud infrastructure continue to reinforce the long term growth narrative. Market participants have been willing to pay a premium for earnings visibility tied to AI monetization, particularly among mega cap constituents that dominate NQ weightings. However, as expectations rise, the market has become less forgiving. Each earnings cycle and macro headline is now filtered through a valuation lens, which has resulted in more two way trade and sharper rotations rather than one directional expansion.
This shift has created an environment where upside progress requires acceptance and follow through, while failure to hold value areas invites responsive selling. In our opinion, sentiment is no longer euphoric but remains optimistic, with positioning sensitive to both macro headlines and technical acceptance.
2. What the Market Has Done?
• The market spent August in a well defined consolidation range, building value and compressing volatility.
• In September, the market imbalanced higher out of that consolidation range and trended upward, reaching the 25400 area and printing new all time highs.
• On October 10, the market sold off sharply down to 24250, which aligned with the high of the prior consolidation range, as Trump renewed China tariff threats.
• Buyers responded at that level and the market balanced, forming bid block 1.
• The market then resumed its uptrend and made new all time highs as US China tariff tensions eased, supported by headlines around Trump and Xi meeting and confirmation of a trade deal.
• From the end of October through the rest of November, the market stalled at 26400, where sellers re entered and auctioned price lower toward 24709, which aligned with the bid block midpoint.
• Buyers attempted to reassert control and bid prices higher, but sellers stepped down offers at 25850, the level where they had previously taken control and drove prices lower through the bid block to 24000 which aligns with the top range of the consolidation range.
• Buyers responded again at 24000 and successfully auctioned price back up toward 25850.
• Over the past week, the market balanced within the December 1 weekly range and value area, but sold off on Friday and closed below the December 1 weekly low.
3. What to Expect in the Coming Week
The key level to watch remains the previous week’s settlement at 25213.50.
Bullish Scenario
• If the market is able to hold above 25213.50, I expect a move back toward the 25850 area, which aligns with composite weekly VAH and the weekly one standard deviation high.
• There is a high probability of two way repair within the prior week’s low volume area between 25213.50 and 25475, which aligns with the two week composite VAL, before continuation higher through the previous week’s value area toward 25828.50.
• If sellers fail to respond in that zone, the market could extend higher toward 26250, which aligns with the October 27 weekly VAH, and potentially toward 26444, the weekly two standard deviation high, to make new all time highs.
Bearish Scenario
• If the market is unable to hold above 25213.50, expect a move lower toward the November 24 weekly VPOC, where buyers should respond.
• Failure of buyers to hold there opens the door for continuation lower toward 24600, which aligns with the November 24 weekly low volume area and the weekly one standard deviation low.
• Further weakness could target the 24400 area, which aligns with a key daily support level.
Neutral Scenario
• If the market lacks volume, and velocity while attempting to move above 25500, which aligns with the prior week’s value area low, or below 24600, which aligns with the November 24 weekly VPOC, expect two way rotation and balance to develop.
Conclusion
In our opinion, NQ remains structurally strong, but the market is no longer forgiving. Acceptance and follow through are required for upside continuation, while failure to hold key value references continues to invite responsive selling. With AI optimism still intact but valuations elevated, the index is increasingly dependent on auction quality rather than narrative alone. As always, context, acceptance, and participant response at key levels will define the next leg.
What is your take on NQ for the upcoming week? Please drop a comment and give a boost so that more from the community can join in the conversation.
Disclaimer: This is not financial advice. Analysis is for educational purposes only; trade your own plan and manage risk.
Valuearea

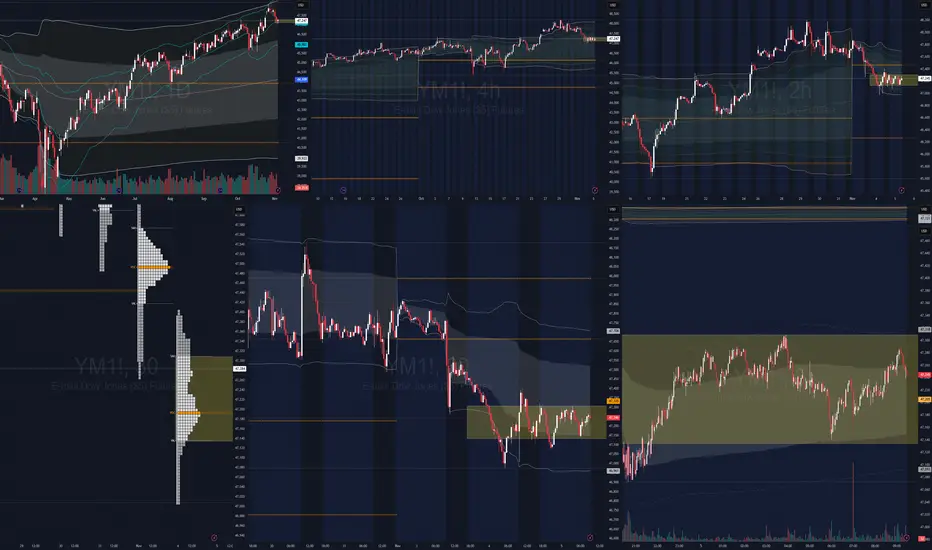
$YM | Mean reversion scalper's delightHeading into the open, we're still inside TPO prior value (see yellow area). Scalpers may be able to fade (short) from the top of VAH - particularly after a stop run of prior swing high.
If you're bullish, either wait for a breakout of the yellow area and pullback or wait to fade from the lower part of the yellow rectangle.
Higher timeframe bias unclear, so for scalpers, may be a good opportunity to just play inside this value area and take profits after 1-2 measured moves.
-StoicTraderCoach
Amazing breakout on WEEKLY Timeframe - ACMESOLARCheckout an amazing breakout happened in the stock in Weekly timeframe, macroscopically seen in Daily timeframe. Having a great favor that the stock might be bullish expecting a staggering returns of minimum 25% TGT. IMPORTANT BREAKOUT LEVELS ARE ALWAYS RESPECTED!
NOTE for learners: Place the breakout levels as per the chart shared and track it yourself to get amazed!!
#No complicated chart patterns
#No big big indicators
#No Excel sheet or number magics
TRADE IDEA: WAIT FOR THE STOCK TO BREAKOUT IN WEEKLY TIMEFRAME ABOVE THIS LEVEL.
Checkout an amazing breakout happened in the stock in Weekly timeframe.
Breakouts happening in longer timeframe is way more powerful than the breakouts seen in Daily timeframe. You can blindly invest once the weekly candle closes above the breakout line and stay invested forever. Also these stocks breakouts are lifelong predictions, it means technically these breakouts happen giving more returns in the longer runs. Hence, even when the scrip makes a loss of 10% / 20% / 30% / 50%, the stock will regain and turn around. Once they again enter the same breakout level, they will flyyyyyyyyyyyy like a ROCKET if held in the portfolio in the longer run.
Time makes money, GREEDY & EGO will not make money.
Also, magically these breakouts tend to prove that the companies turn around and fundamentally becoming strong. Also the magic happens when more diversification is done in various sectors under various scripts with equal money invested in each N500 scripts.
The real deal is when to purchase and where to purchase the stock. That is where Breakout study comes into play.
Check this stock which has made an all time low and high chances that it makes a "V" shaped recovery.
> Taking support at last years support or breakout level
> High chances that it reverses from this point.
> Volume dried up badly in last few months / days.
> Very high suspicion based analysis and not based on chart patterns / candle patterns deeply.
> VALUABLE STOCK AVAILABLE AT A DISCOUNTED PRICE
> OPPURTUNITY TO ACCUMULATE ADEQUATE QUANTITY
> MARKET AFTER A CORRECTION / PANIC FALL TO MAKE GOOD INVESTMENT
DISCLAIMER : This is just for educational purpose. This type of analysis is equivalent to catching a falling knife. If you are a warrior, you throw all the knives back else you will be sorrow if it hits SL. Make sure to do your analysis well. This type of analysis only suits high risks investor and whose is willing to throw all the knives above irrespective of any sectoral rotation. BE VERY CAUTIOUS AS IT IS EXTREME BOTTOM FISHING.
HOWEVER, THIS IS HOW MULTIBAGGERS ARE CAUGHT !
STOCK IS AT RIGHT PE / RIGHT EVALUATION / MORE ROAD TO GROW / CORRECTED IV / EXCELLENT BOOKS / USING MARKET CRASH AS AN OPPURTUNITY / EPS AT SKY.
LET'S PUMP IN SOME MONEY AND REVOLUTIONIZE THE NATION'S ECONOMY!

Amazing breakout on WEEKLY Timeframe - FORTISCheckout an amazing breakout happened in the stock in Weekly timeframe, macroscopically seen in Daily timeframe. Having a great favor that the stock might be bullish expecting a staggering returns of minimum 25% TGT. IMPORTANT BREAKOUT LEVELS ARE ALWAYS RESPECTED!
NOTE for learners: Place the breakout levels as per the chart shared and track it yourself to get amazed!!
#No complicated chart patterns
#No big big indicators
#No Excel sheet or number magics
TRADE IDEA: WAIT FOR THE STOCK TO BREAKOUT IN WEEKLY TIMEFRAME ABOVE THIS LEVEL.
Checkout an amazing breakout happened in the stock in Weekly timeframe.
Breakouts happening in longer timeframe is way more powerful than the breakouts seen in Daily timeframe. You can blindly invest once the weekly candle closes above the breakout line and stay invested forever. Also these stocks breakouts are lifelong predictions, it means technically these breakouts happen giving more returns in the longer runs. Hence, even when the scrip makes a loss of 10% / 20% / 30% / 50%, the stock will regain and turn around. Once they again enter the same breakout level, they will flyyyyyyyyyyyy like a ROCKET if held in the portfolio in the longer run.
Time makes money, GREEDY & EGO will not make money.
Also, magically these breakouts tend to prove that the companies turn around and fundamentally becoming strong. Also the magic happens when more diversification is done in various sectors under various scripts with equal money invested in each N500 scripts.
The real deal is when to purchase and where to purchase the stock. That is where Breakout study comes into play.
Check this stock which has made an all time low and high chances that it makes a "V" shaped recovery.
> Taking support at last years support or breakout level
> High chances that it reverses from this point.
> Volume dried up badly in last few months / days.
> Very high suspicion based analysis and not based on chart patterns / candle patterns deeply.
> VALUABLE STOCK AVAILABLE AT A DISCOUNTED PRICE
> OPPURTUNITY TO ACCUMULATE ADEQUATE QUANTITY
> MARKET AFTER A CORRECTION / PANIC FALL TO MAKE GOOD INVESTMENT
DISCLAIMER : This is just for educational purpose. This type of analysis is equivalent to catching a falling knife. If you are a warrior, you throw all the knives back else you will be sorrow if it hits SL. Make sure to do your analysis well. This type of analysis only suits high risks investor and whose is willing to throw all the knives above irrespective of any sectoral rotation. BE VERY CAUTIOUS AS IT IS EXTREME BOTTOM FISHING.
HOWEVER, THIS IS HOW MULTIBAGGERS ARE CAUGHT !
STOCK IS AT RIGHT PE / RIGHT EVALUATION / MORE ROAD TO GROW / CORRECTED IV / EXCELLENT BOOKS / USING MARKET CRASH AS AN OPPURTUNITY / EPS AT SKY.
LET'S PUMP IN SOME MONEY AND REVOLUTIONIZE THE NATION'S ECONOMY!

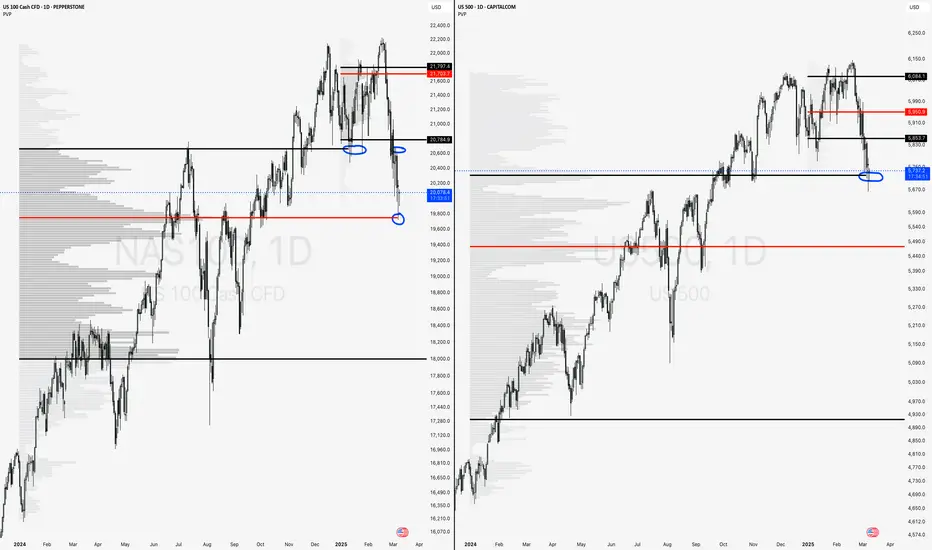
SPY and QQQ at MAJOR LevelsThe charts shown are highlighting the 12 month periodic volume profile chart. Currently, the S&P 500 and Nasdaq 100 are bouncing off major 2024 value areas.
Nasdaq 100:
Last week we can see how bulls lost the 2024 value area high (VAH) and couldn't reclaim. As a result we swiftly moved down to the point of control (POC) where we found buyers show up.
S&P 500:
Coincidently, the S&P 500 moved down to the 2024 VAH where it also found buyers show up.
Moving Forward:
These areas remain very important and should be monitored going forward. If a bounce is to happen here, bulls would like to see the Nasdaq reclaim the 2024 VAH and even work back into the current 2025 VAL.
BNX Update: Where Is BNX Heading Next?UPDATE:
Price didn’t quite reach the 0.618 fib retracement level we initially eyed for a short entry, it got very close and then faced rejection off the pitchfork upper resistance trend line. This rejection triggered a sharp 13% drop down to a low of $0.8278. After a brief bounce, I'm still waiting for price to drop further toward the support zone at $0.8–$0.78. So far, the trade is unfolding as planned.
In addition, price has lost the VAL and daily support level, both now acting as resistance. The daily support sits at $0.8939, with VAL just below at $0.8846. This zone has already been tested and rejected, making it a great shorting opportunity.
Looking ahead, if bulls manage to push the price up to around $0.91, testing the previous low that broke and aligns with the 0.618 fib retracement of that drop, we’d have an ideal low-risk, high-reward short opportunity.
Short Trade Ladder Strategy:
Entry Range: Create a laddered short entry from the VAL at $0.8846 up to the 0.618 fib retracement at $0.9126
Stop Loss (SL): Place SL above the daily Open
Target: Aim for a target in the support zone at $0.8–$0.78
Risk/Reward Ratio: This setup offers a risk/reward ratio of around 3:1
Stay tuned for confirmation signals as the price approaches these levels, and be ready to adjust if the market dynamics shift. Till next time! Happy trading and stay sharp =)

KIRLOSBROS - Cup & Handle patternAll details are given on chart. If you like the analyses please do share it with your friends, like and follow me for more such interesting charts.
Disc - Am not a SEBI registered analyst. Please do your own analyses before taking position. Analysis provided on chart is only for educational purposes and not a trading recommendation.

THE PLAN IS THE PLAN Like i said before and i will say again im bullish on tesla and after the event im MEGA bullish on tesla
As i managed to anticipate the scam dump since yesterday on premarket dont think the market is bearish dont be triggered to think it is, DONT BOTTOM SHORT.
We are at the 100 daily EMA and that is MEGA FAIR VALUE for WALLSTREET.
This whole dump is to grab retail traders money. BUY NOW while you can. CUP AND HANDLE TARGET IS 400!
We are right now on october lowest point and below the value area high and actually at the 3 months POC.
i've been covering tesla since around august dont say you didnt know!
TSLA MOONING

Very Important Update!Price action is currently trapped between two key value areas. Until we reclaim the VAL above, i'm expecting lower prices to come, and the point of control below (yellow line) is the next target. CRYPTOCAP:BTC #BTC
Calculate Your Risk/Reward so you don't lose more than 1% of your account per trade.
Every day the charts provide new information. You have to adjust or get REKT.
Love it or hate it, hit that thumbs up and share your thoughts below!
This is not financial advice. This is for educational purposes only.

Perfect Pullback!The areas I am interested in for a long trade would be around $0.90 cents to retest the weekly or flipping $1 into support.
Targets for both would be the Value Area High of the upper range.
Calculate Your Risk/Reward so you don't lose more than 1% of your account per trade.
Every day the charts provide new information. You have to adjust or get REKT.
Love it or hate it, hit that thumbs up and share your thoughts below!
This is not financial advice. This is for educational purposes only.

BONK IS AT SUPPORTBONK is trading at the major support level. If we can keep trading above this level, there's a big chance we can have a nice move to the upside.
Calculate Your Risk/Reward so you don't lose more than 1% of your account per trade.
Every day the charts provide new information. You have to adjust or get REKT.
Love it or hate it, hit that thumbs up and share your thoughts below!
This is not financial advice. This is for educational purposes only.

Tap Double Top or buying opportunity?NYSE:TAP has had a rough time as of late as noted on the weekly chart.
I am torn between the was it a double top or are we entering a buying opportunity here?
If it loses the 53 level it can continue to slide especially if earnings disappoint, on the other hand it could rise if earnings surprise at this low level. The lowest analyst had a target of 53 I am debating entering but concerned on this weekly chart.

NEO - RELOADEDSince August 2023, NEO has had a strong run, as have many altcoins, growing ~141%. It is now trading above all EMA's and recently rebounded from the 20-day EMA as support.
NEO was one of the first 'larger' altcoins to break out of the bearish to bullish phase a few weeks ago. Since then, it has attempted to break the resistance at ~$15 - $15.60, 3-5 times resulting in long wicks. Each time, the resistance won and short-term support was found with the strongest at ~$11.19.
Provided BTC continues consolidating or growing, we can see NEO push even further, targeting the $20 area (67% gain). If this doesn't happen, we could see NEO continue consolidating in the value area between $11 - $14 or finding longer-term support around $9 before proceeding to try again.
If it consolidates, NEO could move to the top of the value area in the short-term for a modest 16% gain.
Please note I am not a financial advisor and this is not financial advice. All ideas are for educational purposes only.
Please feel free to leave your comments and thoughts below!

(GBP/AUD) Reaches Fair Value Gooday
GBP/AUD Reaches Fair Value.
The ExodusTradingDesk has spotted fair price that we believe will produce a potential sell opportunity for the pair.
We will sell the pair should we have a 30min candle close below the identified price zone at 1.90265 with our target set to 1.89557.
Use adequate risk management if you are to execute a trade with this analyses.
Enjoy and happy trading! #We are the #ExodusTradingDesk.

Bitcoin Fighting Point Of ControlWhen analyzing Bitcoin, we can see that we had a nice move up from the lows. After this move up, we can see on the chart that it's struggling to get past the Point Of Control. Usually when the price gets rejected from the point of control, it tends to find the Value Area Low of the range before continuing its move up of finding new lows. Since bitcoin did break out of its descending triangle, I would expect to see the price continue to move higher and test the Value Area High (Blueline above POC) before a possible retracement to either retest the Value Area Low or dynamic resistance that we just broke out of.
Every day the charts provide new information. You have to adjust or get REKT.
Love it or hate it, hit that thumbs up and share your thoughts below!
Don't trade with what you're not willing to lose. Calculate Your Risk/Reward!
This is not financial advice. This is for educational purposes only.

Local range scalps/Day tradesSome areas of confluence from which to potentially take some local scalps if as price hits these levels and market cipher shows divergence on both momentum and money flow from the
15 min chart to the 1 min chart.
If price does not just plummet or jump upwards rapidly.

Potential BTC Short Between around 30.3k and 30.8k are some fresh resistance levels that are yet to be hit.
If price comes into this box with the criteria frp, listed I will take a short risking 1%-2% of my entire account.
*1hr money flow (Red/green oscillator
waves) coming down and crossing the 0 line
*1hr momentum creating a divergence (Blue
oscillator waves)
*1hr vwap (Yellow line on oscillator) curving down
to ward the 0 line.
*12min and down momentum divergence
*12min and down moneyflow coming down
Tp 1 - Value area high at 28870
Tp 2 - point of control at 28000
Tp 3 - Value area low at 26900
Leave the rest to ride

Showcase of the Power of Market Profile AnalysisMarket Profile analysis is a powerful tool for traders and investors alike to analyze price movements in financial markets. The method is based on the concept that price moves in a predictable way, forming patterns that can be observed and analyzed.
The Market Profile chart is a visual representation (not shown here) of market activity, displaying the distribution of price over time. The chart is divided into horizontal sections, each representing a price level. The length of the bar indicates the duration of time during which trades occurred at that price level.
The Market Profile chart can be used to identify areas of price support and resistance, as well as areas of high and low volume. The three key components of the Market Profile chart are the Point of Control (POC), the Value Area, and the Single Prints.
The Point of Control (POC) is the price level at which the highest volume of trades occurred during the period under analysis. It represents the most actively traded price level during that time frame, and is often seen as a key support or resistance level.
The Value Area is the range of price levels that contain a specified percentage of the total trading volume during the period under analysis. The Value Area can be used to identify areas of price support and resistance, as well as potential trading opportunities.
Single Prints are price levels where trading activity occurred but did not overlap with any other price levels during the period under analysis. These are areas where price discovery occurred, and can be used to identify areas of potential price support or resistance.
By analyzing the Market Profile chart, traders can gain a deeper understanding of market dynamics and make more informed trading decisions. The chart can be used to identify areas of price support and resistance, as well as potential trading opportunities based on the volume and duration of trading activity at specific price levels.
Between end of Dec 2022 and end of Jan 2023, the price of the S&P 500 index (SPX) showed major reactions to the price levels drawn by using Market Profile analysis that was done in Oct 2022 . This is a prime example of the power of this trading method. By identifying key levels of support and resistance, traders were able to make more informed trading decisions and take advantage of market opportunities.
In conclusion, Market Profile analysis is a powerful tool for traders and investors who want to gain a deeper understanding of market dynamics and make more informed trading decisions. By analyzing the distribution of price and volume over time, traders can identify key levels of support and resistance, and take advantage of market opportunities. The example of the S&P 500 index (SPX) in October of last year showcases the power of this trading method, and demonstrates how it can be used to make profitable trades in a dynamic and ever-changing market.

ppd contraction, ml strat consolidative, musashi crossthese strategies are signaling the consolidative move isnt over, and revisiting mean and regression is likely
theres no way to prove at the moment we will go through a phase like this, but if the opportunity presents itself its a path that mathematically makes sense

AMZN: Moving into A Buy Zone?The Weekly Chart of AMZN shows that the stock has dropped into a strong support price level with a risk that there could be a Dark Pool Buy Zone here. The share price is now below fundamental values.
With a month before AMZN reports earnings, it will be interesting to see how the stock behaves; it will reveal how well AMZN is recovering from the hyper revenues created by the stay-at-home orders and stimulus checks of the pandemic. This is the last quarterly report that will be skewed with the revenues and earnings from the pandemic anomaly.
This company MUST provide a dividend soon.

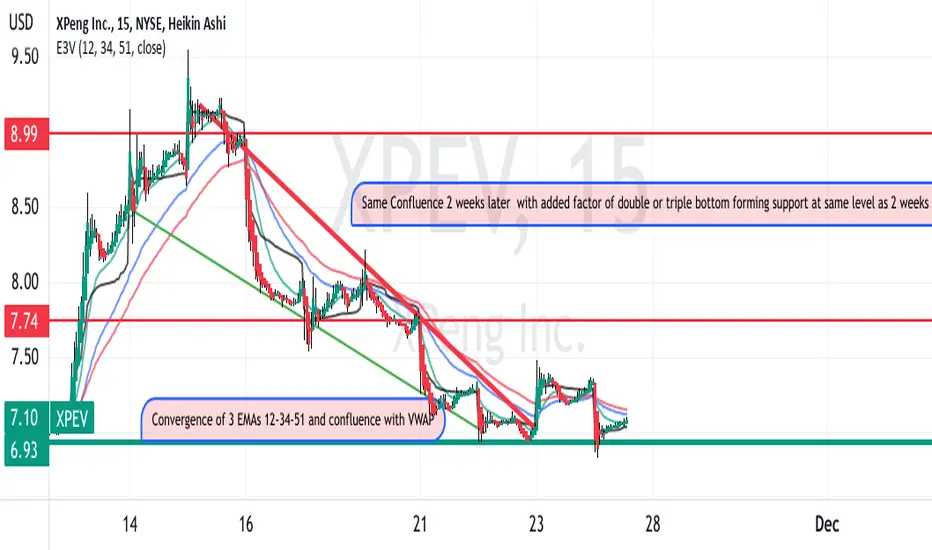
XPEV is forming a reversal pattern perhaps following TSLAXPEV is presently finishing out a falling wedge pattern.
As shown on the 30-minute chart, exponential moving averages
are falling and converging in the narrow area where VWAP
is trending. At lower time frames a "Golden Cross pattern"
A stop loss can be set under the double or triple bottom
with a target being the 1/2 of the way to swing high about 10% higher
based on a routine retracement. This seems to be a quality
swing long setup based on a breakout of a falling wedge
and a confluence of moving averaged and anchored VWAP
I took some call options with a strike of $ 8 and an expiration
on 12/16 while expecting over 100 % profit.
How to trade using Value Areas and POC?A few key concepts when using Market Profile in your trading:
1) Point of Control (POC) acts as price magnets, as they represent the price level where most time was spent during a trading day. Price tends to gravitate towards them.
2) Naked (Not visited) POC acts as stronger magnets than visited POCs.
3) When price enters / breaks into a Value Area, which represents a range of "fair value", price tends to visit the other end of the Value Area. For example above, the price breaks up from the Value Area Low before end of day yesterday, hit the Value Area High this morning.
You definitely won't find these key levels and ranges with traditional support and resistance lines drawing methods. Using Market Profile will give you the edge to become a better trader.
See my previous 2 posts:

SPX, looking for long up to Value Area HighWe have broken into a Naked Value Area, many opportunities awaits~! Let's see if the bulls can take control. Two key levels to watch before reaching the other side of the Value Area.
