Can vet bring itself closer to 1 usdt??Hi my friends
I think the answer to the question can be yes.
vet is at the bottom of its long-term channel, and trading volume is on the rise
Trading in the current range is low risk until a daily candlestick closes below the channel line.
Thank you. If you liked this idea, like it and comment on your own idea.
Be rich and generous.
Vetanalysis


VET bottom is inBTC has picked up volume & just broke a huge resistance, let's see if it can keep the momentum & break $58k.
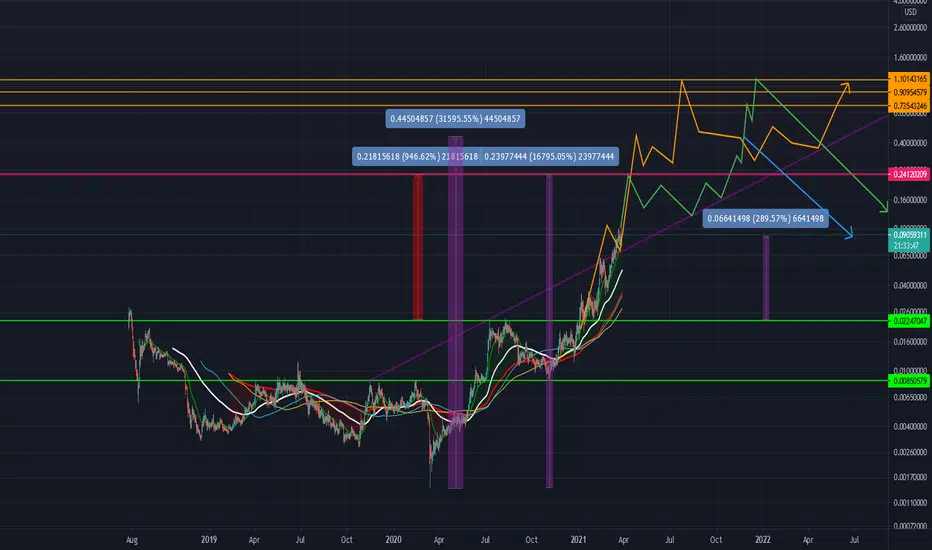
Vechain should reach .25 by the end of November

vetusdt, this is only my personal ideaI think that it's better to insert stop loss on green zone and if support from green zoom then we can enter with red goal. let's see it

NEW ATH WİLL SOON!!!As long as BTC doesn't fall below $60,000 and ETH $4,365, new ATH can be expected. Be patient.

$VET Ascending Triangle - Breakout Soon$VET is currently in an uptrend on the daily timeframe and approaching resistance at $0.155 cents.
VeChain is in an ascending triangle which is a bullish chart pattern.
I am LONG expecting $VET to breakout of this resistance and flip it into support before continuing towards ATH of $0.28 cents.
Should this pattern breakdown $VET will look for support at $0.12 with deeper support at $0.10

Vechain Ready For a HUGE Run!!Looking at the Vechain/Bitcoin chart we have recently seen a great breakout to the upside, we were stuck in a clear descending channel since mid august and have finally broken through the top and i personally think this is just the start for this VET run! We are currently right on the 0.2 FIB after testing it for the 3rd day in a row and the break up and above is looming, i would love to see a push up and a daily close above this FIB level flipping it back into support and getting that boost to keep going upwards, a break above here would open the door for an absolute key target which is the pivot point, this is so important because if we get a close above this level we are set for a true pivot/reversal to the upside, with this level not far away it is very doable and could happen this week! Another explosive looking indicator we should talk about is the bollinger bands, we have been touching the top band for 3 days in a row now and the grab on and ride up is absolutely imminent, i believe that a break above this 0.2 FIB level will ignite this move on the bollinger bands since our actual candle body will be directly on the top band! Plus with our bands a lot more squeezed than normal an explosive move is coming and the bollinger bands doesn't actually indicate which way it will go but i think we all have a very good idea of which direction that is;) a very doable conservative target with all this bullishness is the 0.5 FIB which is our highs from mid august, after that we do have many key resistance points but i won't speculate too much and that will be for a later TA! Now the squeeze momentum indicator we are seeing something absolutely huge! Now we do have to wait until daily close to get the confirmation but it is our first green bar on the histogram in quite some time, without counting the super small green bar in the middle of our 2 red cycles it is the first since mid september! Now if we continue to see bullish price movement and continues increasing green bars we will be moving into a bullish squeeze shown by the black crosses and then eventually a bull squeeze release which almost everytime sends us flying to the upside! of course if the cycle is big enough with lots of momentum and with the looming altseason i think that is exactly what we are due for! Not financial advice just my opinion!!

Vechain Possible Hidden Bullish Divergence!!?Looking at Vechain we have recovered nicely off of the little correction we had and we are starting to push back up towards our previous high at 0.16c shown by red horizontal ray, but the main thing i wanted to discuss here is the very possible hidden bullish divergence that could play out in the coming days/week/s. This pattern is a continuation pattern of the current trend we are in and could keep pushing VET to the upside. Before we get into this possible outcome lets discuss the bollinger bands first, the main thing we notice is the squeezing of the bands which means volatility is shrinking and we are set for an explosive move in a matter of time, now the bollinger bands don't indicate which way but that is why we use other indicators to try and determine that. we are holding the midline quite strong and its looking like we will continue too after todays daily close, and keep in mind with the bands so close to price action a little pump could ignite a massive one if price action grabs onto that top band! Now the hidden bullish divergence, what we are looking for and we are already seeing is higher lows on the price chart which is shown by the green uptrend line and then lower lows on the oscillator and in this case i am using the stochastic RSI, look at the yellow horizontal ray, that line shows our previous low and what we are looking for here is a fall below this level and a creation of a lower low, similar to the path ive drawn on the Stoch RSI, the path shows a likely scenario because we have support down there shown by the green horizontal line, but we could see this play out anywhere inbetween the green and yellow horizontal lines and anywhere in that area would be valid for this divergence! and with the stoch rsi just having a bearish crossover this could play out perfectly, on the price chart we still have a bit of room to fall down along with the stoch RSI we just have to make sure price action keeps on making higher lows which can be seen by following the green uptrend line, if we made a higher low on the green uptrend line that will definitely be enough for the stoch RSI to fall into that zone we talked about and then go on to make that lower low. Now something key here is when we look at the RSI we see that we are falling a bit along with the stoch RSI which is completely normal and we are coming up on the midline in a bit and now this is where the hidden bullish divergence CONTINUATION comes into play, we are currently in an uptrend shown by being above the midline and we want to stay above here when the stoch RSI makes that lower low to complete the divergence pattern and the continuation part goes hand in hand with us being in a confirmed uptrend. And when we talked about having room to fall on both price action and the stoch RSI the same thing goes for the RSI, we definitely have room to fall along with both of these other factors and we can likely see ourselves getting a bounce off the midline which is currently support (as shown by path) and then continue back upwards, it really looks like we could see all of these get that bounce which we need for this to complete the pattern and the beauty is that all these indicators play into eachother and follow eachother so that gives us more hope that this is really going to play out similar to how i have it layed out! Then pair this divergence pattern along with the squeezing bollinger bands and we could definitely have ourselves a huge catalyst for a mega breakout to the upside and a continuation of this uptrend! Not financial advice! If you have any questions don't hesistate to ask i will do my best to explain further and answer in good time! Cheers everyone this is very exciting!

vet super bullish 100% profit wait for you without fear buy vetusd
In Weekly time frame vet coin bullish
buy in support and don't miss this opportunity
And when macd cross then vet BBBBBBBBBBBBBBOOOOOOOOOOOOOOOOOOOMMMMMMMMMM

VET/USDT 2HOUR UPDATE Welcome to this quick Vet/usdt analysis.
I have tried my best to bring the best possible outcome me in this chart.
Reason of trade :- vet/usdt analysis is ascending triangle ready and green zone fast by the dip.
Entry:- $0.11646.
$0.11840.
Traget:-
T1:- $0.12197
T2:- $0.12509
T3:- $0.12823
T4 :- $0.13470
Stoploss:- $0.11174
Remember:-This is not a piece of financial advice. All investment made by me is under my own risk and I am held responsible for my own profit and losses. So, do your own research before investing in this trade.
Happy trading.
Sorry for my english it is not my native languages.
Do hit the like button if you like it and share your charts in the comments section.
Thank you...

VET/USDT - Potential 185 setupHello Traders!
VET is another ecosystem asset.
The asset is under selling pressure after a strong seller reaction from the $0.154 level.
We should look for purchases based on a possible continuation of the correction of the asset.
The nearest liquidity buffer is the $0.082 - $0.099 range. It's better to buy closer to the lower border of the range - the level of $0.082.
It's better to place a stop under $0.05700. As the stop is long it's better to work with 50% of the volume of allocated funds for the deal at first, to make other purchases after correction completion.
The targets for purchase will be price levels
$0,154
$0,187
$0,234
Good luck and watch out for the market
P.S. This is an educational analysis that shall not be considered financial advice

Awesome VET / USDT …Hey , guys !
———
If we will see normal situation with the market in October , VET will the best of the best ;)
———
What do you think ?
———
If you need levels targets and stop loss info contact us in messages ; )

VET - VECHAIN; PT 2; see pt1 success, the final stageVET - VECHAIN; PT 2; see pt1 success, the final stage
The final acts are near. Prepare yourself.
See part 1. I am refining this one a lil, reducing top options a bit.
Good luck on the EXIT
VET/USDT BINANCEVET/USDT BINANCE
1D hollow candlesticks
After a price dump came from the symmetrical triangle, a candlestick hammer seems to form.
Until the daily candle ends, we can't tell for sure that will happen.
As it seems a Cypher has formed, so a price rebound will follow, as the aqua-colored path shows.
Also, this path is more clear in this dis ascending - a bullish falling wedge that has formed from a symmetrical triangle.
The next resistance will be at the last two Fibonacci retracements golden ratios.
If MACD bullish crossover occurs, it will confirm the movement of the path.
The steady volume shows HODL.
VeChain Price (VET) = $0.08826 -0.95%
0.00000211 BTC -1.18%
0.0000311 ETH +0.86%
Good Luck
CryptoHellas Team


VETUSDT analysis The right position for profit.
Targets are marked on the chart.
After breaking the red line in the daily or 4h time frame and closing it above the red line, you can make a purchase.

VETReady to defeat resistance line
Breaks out soon
If the falls, The yellow area is suitable for shopping

VeChain Pullback and Buy AreaI'm expecting VeChain to pullback to the golden fib pocket area where I'm looking for longs. There's also confluence with the 200MA and the golden fib pocket.

VETUSDT Breakout already!!!!!My entry point is based on 4H, and my potential target price is the 2 orange line (based on a bigger timeframes like 8H and 1D)

VET looking for takeoff!Vechain vs bitcoin, we have been trading slightly downwards in this descending triangle since our peak around mid april and we are almost to the apex point trading around the lower half pf the triangle. I don't think we will see a bottom side breakout i believe we are gonna shoot through the top, i think even if we do break to the downside it could be looked at like a fakeout, the end of this triangle brings us into the beginning of august and thats when id say alt coins are going to really takeoff. Looking at the RSI we are pretty low in the confirmed downtrend half almost to the oversold zone, we are slightly pointing upwards and look like we are ready to see a bit of a climb upwards to atleast the midline at 50. We could see a rejection at first and then sort of repeat that cycle until the markets are ready to move (august imo) once we do get the momentum to smash through the midpoint on the RSI it is crucial not to jump to bullish positions until we see that confirmed, we need the confirmation before we can say we are in a confirmed uptrend. looking at the Wave trend oscillator we are coming to the bottom of this wave i would say almost bottoming out in the buy zone, we should see a smooth ride back up in this next wave which hopefully could bring us out of this descending triangle, maybe not this wave but i would say in the next couple bullish waves we see. One crucial thing to keep in mind is that we got to stay away from that bottom bollinger band as we could definitely see a significant fall if we start riding the bottom band, we are currently getting stuck underneath the midline and for the past couple weeks can't seem to break through it with multiple candles getting stuck right below it. a very positive scenario would be on this next bullish wave on the wave trend pushing price action above this midline and into the more bullish side of the BB, aswell the same thing with the RSI! Not financial advice just my opinion!

My Buy Senario For Vet/Usdtanalysis by price action 🔥
moving conformation
flag pattern
new trend ( up trend )

Vechain (VET) - 3D. We are waiting for the test of the ATHThe unstable situation in the cryptocurrency market , a sharp change in investor sentiment and fear of the continuation of a total fall in prices motivated us to update our global forecast for the Vechain coin . We remember that in a completely opposite situation on the market, when everyone believed exclusively in the continuation of the cryptocurrency market without corrective growth, we published our previous VETUSDT market forecast . Below you can check How clearly the idea worked (the result of the market fall by more than 70%):
Today we decided to continue looking for relevant mid-term scenarios and built a new fractal . Of course, it is unreasonable to rely only on a part of the schedule that is somewhat reminiscent of the current situation. Therefore, below there will be other arguments for such a positive scenario.
We'll start by looking at the 4 hour timeframe . As you can see in the chart, buyers are carefully holding the price and increasing their positions in the range of $0.66-0.75. Even if we assume that the VET market will continue to fall, then the correction of the previous fall wave is still incomplete:
The increase in trading volumes in the range of $0.66-0.75 and the unsuccessful attempt of sellers to gain a foothold below this liquid zone indicate that the consolidation in the VET market has not yet been completed. From the local perspective, we expect the price to rise in the range of $0.116-0.12
Given the strength of the previous wave of decline, the continuation of the medium-term upward or downward movement of the VET price is impossible without increasing positions by market participants. Therefore, by mid-summer, we will expect further consolidation in the VET market.
If we analyze the VETBTC chart , we see that sellers were trying to gain a foothold below the global range 0.000002-0.00000236. However, their attempt ended with a false breakout:
The current attempt by sellers to break through this range looks much weaker, which signals the weakness of sellers in this price range. As a result, a consolidation triangle is also formed on the VETBTC chart
Fixing the price above the 0.000002-0.00000236 range will signal the beginning of a new wave of growth in the VET market.
An alternative scenario of a complete collapse of the VET price, we will consider only when the price fixes below $ 0.05
