HOW TO WATCHLIST ADVANCED VIEW PART-2 IN TRADINGVIEW1️⃣ Open Advanced View in the Watchlist
Open Trading-View.
On the right side, open the Watchlist panel.
If it is hidden → click the small arrow on the right edge.
At the bottom of the watchlist, click the icon that switches to Advanced View
(it looks like a more detailed/grid style layout).
Your watchlist will now show a table-style advanced view with multiple columns.
2️⃣ Open the Column Selector (where all tools live)
In Advanced View, move your cursor to the top header row (where the column names are).
Look for an option like “Add Column” or a “+” (plus) icon.
Click it → a panel or list opens with different categories:
Price
Financial
Risk
Technical
(names can appear as sections or tabs in the column selector window).
All four tools you mentioned are basically column groups you can add to the advanced view.
3️⃣ How to Use the Price Tool (Price Columns)
In the column selector, click on “Price”.
You will see different price-related fields, for example:
Last Price
Open
High
Low
Close
Change
Change %
Click on the fields you want to use (for example: Last Price, Change %).
These price columns will appear in your Advanced View table.
You can now:
Sort by a price column → click on the column name (e.g., “Change %”) to sort ascending/descending.
Reorder the column → drag the header left or right.
This helps you quickly see which symbols are moving the most in terms of price.
4️⃣ How to Use the Financial Tool (Fundamental Columns)
Open the column selector again → click “Financial”.
You will see fundamental / financial fields, for example (depending on symbol type):
Market Cap
P/E Ratio
EPS
Dividend Yield
Revenue, etc.
Click on the financial fields you want to add.
These financial columns now appear in the Advanced View.
You can:
Sort by any financial column (e.g., Market Cap to find largest companies).
Reorder the columns to keep important financial data together.
This is useful when you are comparing stocks by fundamentals, not just price.
5️⃣ How to Use the Risk Tool (Risk Metrics Columns)
In the column selector, click “Risk”.
Trading-View may show risk-related metrics such as (depending on symbol and your plan):
Volatility
Beta
Average True Range (sometimes under technical/volatility)
Other risk-style metrics, if available
Select the risk fields you want to track.
These risk columns appear in your table.
Now you can:
Sort by risk column (for example, volatility) to see which symbols are more active or more stable.
Combine risk columns with price columns to filter out too volatile instruments if you want.
This helps you understand how aggressive or calm each symbol is from a risk point of view.
6️⃣ How to Use the Technical Tool (Technical Metrics Columns)
Open the column selector → click “Technical”.
You’ll see technical-related fields, for example:
RSI value
Moving Average status (like “Price above/below MA”)
Overall technical rating (e.g., “Strong Buy / Buy / Neutral / Sell”)
Other built-in technical summary metrics.
Click on the technical fields you want to add.
These technical columns appear in Advanced View.
You can:
Scan quickly which symbols have strong technical rating.
Sort by RSI or rating to find overbought/oversold or technically strong/weak symbols.
This turns your watchlist into a mini technical scanner.
7️⃣ How to Reorder, Remove, and Clean Up Columns
🔹 Reorder Columns
Click and hold any column header (Price, Financial, Risk, Technical field).
Drag it left or right.
Release to place it where you want.
🔹 Remove a Column
Hover on the column header you want to remove.
Click the three-dot menu (⋮) or right-click (depending on layout).
Select “Remove Column”.
The column disappears from Advanced View.
8️⃣ Switch Back to Normal Watchlist View
At the bottom of the watchlist, click the List View icon (or original watchlist icon).
The watchlist will return to the compact standard view.
Advanced View settings are usually remembered, so when you come back, your columns are still there.
🔁 Short Recap (Good for on-screen text)
Open Watchlist → Switch to Advanced View
Click Add Column (+) → choose from Price / Financial / Risk / Technical
Add the fields you want → Columns appear in table
Sort by clicking column names
Drag to reorder, menu to remove
Switch back using List View icon
View

HOW TO WATCHLIST ADVANCED VIEW PART-1 IN TRADINGVIEWHOW TO WATCHLIST ADVANCED VIEW PART-1 IN TRADINGVIEW
**AND WHAT FEATURES IT PROVIDES**
✅ HOW TO OPEN ADVANCED VIEW IN TRADINGVIEW
Follow these steps:
1️⃣ Open the Watchlist Panel
➣ On the right side of the Trading-View interface, find the Watchlist panel.
➣ If it is hidden, click the small arrow on the right edge to reveal it.
2️⃣ Find the Layout Icons at the Bottom
➣ At the bottom of the watchlist, you will see multiple icons such as:
➣ List View
➣ Table View
➣ Advanced View (usually an expanded grid-style icon)
3️⃣ Click on “Advanced View”
➣ Click the Advanced View icon.
➣ Your watchlist will switch from the simple list to a more detailed, data-rich layout.
➣ That’s it — Advanced View is now active.
✅ FEATURES OF ADVANCED VIEW IN TRADINGVIEW
The Advanced View provides more detailed market information without needing to open charts.
Here are the key features:
1️⃣ Multiple Data Columns
➣ You can view several data points directly in the watchlist, such as:
➣ Last Price
➣ Price Change
➣ Change %
➣ Volume
➣ High / Low
➣ Bid / Ask
➣ Time / Session Data
➣ Fundamentals (if applicable)
This gives a snapshot of key market info in one place.
2️⃣ Add / Remove Columns
You can customize your watchlist:
➣ Click Add Column (+) to insert new data fields
➣ Click the three-dot menu (⋮) → Remove to delete any column
3️⃣ Reorder Columns
➣ Drag and drop column headers
➣ Arrange symbols in the order that works best for you
4️⃣ Sorting by Any Data
Click any column header to sort:
➣ One click → ascending
➣ Second click → descending
Useful for sorting:
➣ Highest volume
➣ Biggest % movers
➣ Highest price
➣ Top gainers / losers
5️⃣ Expandable Rows
(Some advanced layouts allow expanded detail per symbol.)
This helps you see:
➣ Additional stats
➣ Extended session data
➣ More fundamentals
6️⃣ Cleaner Multi-Symbol Comparison
Advanced View is ideal when watching:
➣ Indices
➣ Futures
➣ Forex pairs
➣ Commodities
➣ Multiple stocks at once
It becomes easier to compare signals and market movements.
7️⃣ Switch Back Anytime
To return to normal view:
➣ Click the List View icon at the bottom
➣ Watchlist returns to default layout
🎯 Summary
➣ Advanced View gives you a more powerful, professional watchlist layout
➣ Perfect for comparing multiple symbols quickly
➣ Provides more data in a structured table-style format
➣ Fully customizable with columns, sorting & layout tools

HOW TO WATCHLIST ADVANCED VIEW IN TRADINGVIEWHOW TO OPEN ADVANCED VIEW IN TRADINGVIEW
**AND WHAT FEATURES IT PROVIDES**
✅ HOW TO OPEN ADVANCED VIEW IN TRADINGVIEW
Follow these steps:
1️⃣ Open the Watchlist Panel
➣ On the right side of the Trading-View interface, find the Watchlist panel.
➣ If it is hidden, click the small arrow on the right edge to reveal it.
2️⃣ Find the Layout Icons at the Bottom
➣ At the bottom of the watchlist, you will see multiple icons such as:
➣ List View
➣ Table View
➣ Advanced View (usually an expanded grid-style icon)
3️⃣ Click on “Advanced View”
➣ Click the Advanced View icon.
➣ Your watchlist will switch from the simple list to a more detailed, data-rich layout.
➣ That’s it — Advanced View is now active.
✅ FEATURES OF ADVANCED VIEW IN TRADINGVIEW
The Advanced View provides more detailed market information without needing to open charts.
Here are the key features:
1️⃣ Multiple Data Columns
➣ You can view several data points directly in the watchlist, such as:
➣ Last Price
➣ Price Change
➣ Change %
➣ Volume
➣ High / Low
➣ Bid / Ask
➣ Time / Session Data
➣ Fundamentals (if applicable)
This gives a snapshot of key market info in one place.
2️⃣ Add / Remove Columns
You can customize your watchlist:
➣ Click Add Column (+) to insert new data fields
➣ Click the three-dot menu (⋮) → Remove to delete any column
3️⃣ Reorder Columns
➣ Drag and drop column headers
➣ Arrange symbols in the order that works best for you
4️⃣ Sorting by Any Data
Click any column header to sort:
➣ One click → ascending
➣ Second click → descending
Useful for sorting:
➣ Highest volume
➣ Biggest % movers
➣ Highest price
➣ Top gainers / losers
5️⃣ Expandable Rows
(Some advanced layouts allow expanded detail per symbol.)
This helps you see:
➣ Additional stats
➣ Extended session data
➣ More fundamentals
6️⃣ Cleaner Multi-Symbol Comparison
Advanced View is ideal when watching:
➣ Indices
➣ Futures
➣ Forex pairs
➣ Commodities
➣ Multiple stocks at once
It becomes easier to compare signals and market movements.
7️⃣ Switch Back Anytime
To return to normal view:
➣ Click the List View icon at the bottom
➣ Watchlist returns to default layout
🎯 Summary
➣ Advanced View gives you a more powerful, professional watchlist layout
➣ Perfect for comparing multiple symbols quickly
➣ Provides more data in a structured table-style format
➣ Fully customizable with columns, sorting & layout tools

There is a chance BTC can return the 80K zone - Data should confEven with the increase from 80K zone to up 86.7K, BTC is able to return from this zone into the breakdown trend, where this will go exactly the coming time frames, which should be confirmed with time. We need to confirm this, the data change, and the last data shows a bitcoin that can get a correction again.

Bitcoin Consolidates Above Support — Main Trend IntactBitcoin (BTC/USDT) — Holding Strong Above Key Support Zones 💪
Bitcoin continues to trade above the low-timeframe support at $122,100, showing resilience and consolidation after its recent upward move.
✅ Low Time Frame Support ($122.1K): BTC remains stable above this short-term structure, suggesting buyers are still in control.
✅ Main Trend Support ($110.2K): The larger bullish structure remains intact as long as price holds above the $110.2K region.
📈 Momentum Outlook: A sustained hold above $122K could set up another push toward $126K–$130K, confirming bullish continuation.
Summary:
BTC remains bullish above both its low-timeframe and main-trend levels. Short-term consolidation is healthy, and the next breakout could target new local highs if momentum strengthens.
🎯 Support: $122.1K / $110.2K
🎯 Resistance: $126K / $130K
📊 Bias: Bullish continuation

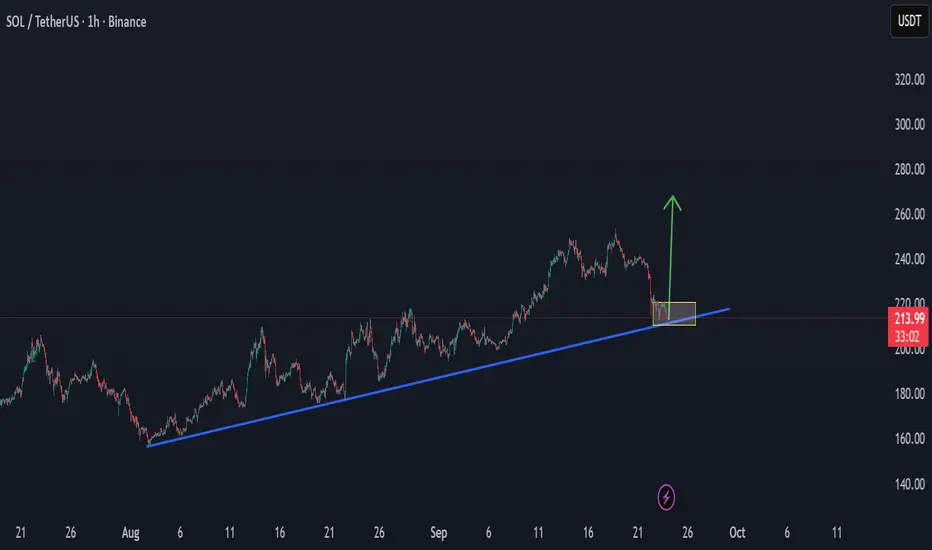
SOLANA can hold the cycle trend to up $250Solana is now at an important level of trend, and can hold in the coming time the cycle key level for a new power trend increase to up $250 in the coming time.
On the low time frame $220 can be the next target, when BTC has a stability trend or an increase trend.
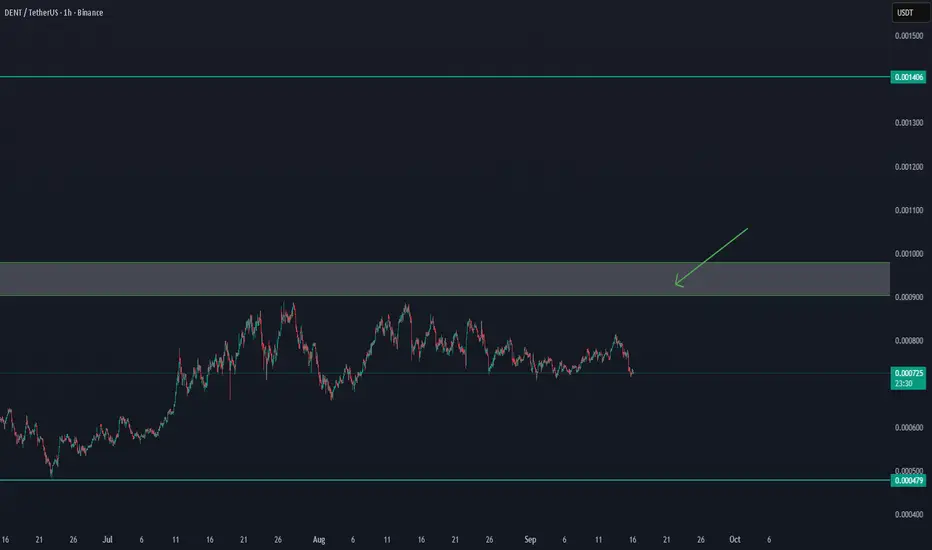
DENT'/USDT UPDATE Confirmation after $0,00093DENT/USDT UPDATE
DENT is showing signs of strength, but we need confirmation.
Key level to watch: $0.00093
✅ A clear breakout and hold above $0.00093 could trigger further upside momentum.
⚠️ Until then, price remains in a consolidation zone and risk of pullback is present.
Plan:
Wait for confirmation above $0.00093 before re-entering longs.
Next resistance levels to monitor: $0.00105 – $0.00120
Support remains around $0.00085 – $0.00080
Conclusion: Break and retest of $0.00093 will be the bullish signal for continuation.
How to use Trading View - Part 3 - TemplatesHow to use Trading View - Part 3 - Templates
Easily switch your TF, Scrip and indicators with the help of templates.
These template help save time and ensure you don't miss out on any indicators/Time Frames or Opportunities.

How to use Trading View - Part 2 - Drawings and AlertsHow to use Trading View - Part 2 - Drawings and Alerts
Remember to assign different colours to different Time Frames as we saw in the last video. www.youtube.com
Also, you can be a bit innovative and use the Trend lines to create alerts not just for the price but time as well.

How to use Trading View - Part 1 - Trend Lines and Time FramesHow to use Trading View - Part 1 - Trend Lines and Time Frames
Use these different tools to make the most of your trading View account.
Make sure to differentiate your time frames so that your charts are decluttered and you have a very clean chart handy always.
Avoid drawing too many lines and drawings at irrelevant time frames.
Keep it Simple,
Keep it Consistent,
Keep it Clean.

BEML @ Make or Break pointBEML CMP: 3791.20; RSI: 40.01;
BEML has near completion of ABC correction wave (Shown Elongated Flat with Irregular Failure pattern). Basis above chart reading, now BEML has entered time correction zone and may consolidate in band of 4280-3430 , which may last till Jan 2025.
If the consolidation band is broken upwards ( 3 day closing above 4280 level) , which may take the script in price expansion mode and new wave formation will take the script to 4604-5052 & finally to 6234 levels.
Breakdown below the lower band of consolidation zone and close below 3430, will invalidate the ABC pattern counting and script may slip to 3157 and if this level is broken eventually will find support at 2710 levels.
Scenario 1: Breakout above 4280
Buy above: 4280
Stop Loss: 3881
Target: 4604-5052-6234
Scenario 2: Breakout below 3430
Short: 3312
Stop Loss: 3430
Target: 3157 -2710
✅ FOR MORE TRADING IDEAS LIKE THIS, PLEASE LIKE, SHARE, AND FOLLOW MY IDEA STREAM ✅

Rose/USDTI was going through my old watchlist and came across one of my old favorites. I can see a potential opportunity, but it's not a good time to enter just yet. We might need to wait a little longer.
This is how I see the chart, it's in 3-day timeframes.

YGG NEW INCREASE VOLUMEYGG shows an interesting trend effect that could have a high chance of increasing in the coming time frames.
Holding volume makes it interesting for daily trend.

BTCUSD Halving Week Important LevelBTCUSD make or break level, BTCUSD is at important level Forming a Trend line and near support now Let's see this sustain or not. what is your view please comment it down. We are Certified. All views shared on this channel are my personal opinion and is shared for educational purpose and should not be considered advise of any nature.

XAUUSD 100% CONFIRM ANALYSISDiscover an enticing Selling opportunity in GOLD as it undergoes a critical retest of a key Resistance area. With market analysis, technical indicators, and price action as your allies, evaluate the potential downside move. Stay vigilant and informed to capitalize on this precious metal's market dynamics.

nifty short at 19800-19890nifty can be short in the given sell zone
one already there is an island gap
second it has tried to test the 19200 level and gap fill remains vacant

PCBLAfter long time Break out done in PCBL.
142/155 SUPPORT ZONE.
WE SEEN 188/202/233/266/299+
VIEW INVALID BELOW 121
NOTE: ALL VIEWS ARE EDUCATION PURPOSE ONLY.

We adjust our negative stance on EUR/USD to neutralFollowing a week where we saw the Fed pause and the ECB raise rates, the Euro is looking a bit more positive and we will for now drop our negative bias and adopt a more neutral stance to see how it deals with tougher resistance near the 1.11 mark.
Disclaimer:
The information posted on Trading View is for informative purposes and is not intended to constitute advice in any form, including but not limited to investment, accounting, tax, legal or regulatory advice. The information therefore has no regard to the specific investment objectives, financial situation or particular needs of any specific recipient. Opinions expressed are our current opinions as of the date appearing on Trading View only. All illustrations, forecasts or hypothetical data are for illustrative purposes only. The Society of Technical Analysts Ltd does not make representation that the information provided is appropriate for use in all jurisdictions or by all Investors or other potential Investors. Parties are therefore responsible for compliance with applicable local laws and regulations. The Society of Technical Analysts will not be held liable for any loss or damage resulting directly or indirectly from the use of any information on this site.


BTC - Make Or Break Zone! 💣Hello TradingView Family / Fellow Traders. This is Richard, also known as theSignalyst.
🗒 As per my last educational post, we know that the bulls took over after breaking above the falling flag #4
📌 BTC is now approaching a strong rejection zone:
1- Round number => 30,000
2- Classic Support Zone Turned Resistance 30k - 32k
3- Supply zone (marked on the chart)
🏹 For the bulls to take over from a Marco perspective , we need a weekly break above 32,000
Meanwhile, the bears can kick in around 30k - 32k for a bearish correction before the bullish take over again. We will be monitoring price action on lower timeframes to confirm it.
Which scenario do you think is more likely to happen first? and why?
📚 Always follow your trading plan regarding entry, risk management, and trade management.
Good luck!
All Strategies Are Good; If Managed Properly!
~Rich

How not to miss an opportunity. I found out about Bitcoin many years ago when it was in prime time only to be associated with organized crime , scams, and money laundering. And that remained deep in my mind.
Since jail seemed a bad idea, I convinced myself that crypto it’s not for me.
As time went by, I didn’t see the good fortune because my mind was still relating Bitcoin to a dark area . Something kept me from buying and I didn’t know what.
As I was on the dark side, I am now thinking that the ones who listened to another side of the story, the winning side, greatly benefit from it.
Later I found out that psychologists have a name for my burden and it’s called Anchoring bias . It is described that first introduced knowledge on a subject has a great impact on our later decisions .
The first details I come upon Bitcoin unconsciously affected my judgment and kept me in a do not act state of mind and made me miss my chance.
That’s when I found some ways to improve my decision-making process and to look at data from another perspective , which I am going to share with you.
But first, let’s take a glimpse at anchoring bias, an error of our mind present in many aspects of our lives, which usually works against us.
Picture yourself in a shop on Black Friday. Would you buy an item for 150$ and how would that make you feel if you knew that it was discounted from 200$?
We tend to look at the price of 200$ as an anchor that quickly drives our behavior to a decision to act. Similar to adjustment bias, comparing the 200$ item now seems like a bargain.
The same thing happens in trading. How do we know whether a stock is overpriced or not? By comparing it with past quotations that act as an anchor.
Is BTC overpriced at 20k? We all would agree that in 2017 it was, but how about now?
These anchors make us act unwisely and take unconscious decisions with small returns. This could lead to unsatisfying results, frustration, or wipe our account over the long run.
Once you get better at identifying the anchoring bias, you can use it to your advantage. Think about what makes good and strong support & resistance. The perception is that a large number of investors credit that bid as a fair value for them.
So what should we do? T o have a better understanding of what drives our choice it’s important to double-check our mindset, emotions, and the data that we encounter.
Does it help us or it could be a potentially harmful anchor? What is the context of the news? In the example above, could we consider solely that 150$ is a fair price, without the 200$ price before the discount?
Also, if you have a strong assumption about a subject, try to look at other points of view, not to change your mind but just to reinforce the reasons you already have.
Remember that the first step into overcoming a bias is to be aware of its presence and next just look inside you to find proof that drives your decisions.
So, let’s recap
Find context - Figure out if the price you set for your buy order is a fair one or if you find it good compared to the day before.
Find anchor - Do I want to invest in this company I have never heard of before just because my cousin thought it was a good idea?
Observe - Do I have doubts about this buy? Do I follow my plan or I am unconsciously driven to make this purchase
Review - Have I looked at other oppions?

AMB : BREAKOUT TIMING Previously, we shared a trend chart of the AMB coin that indicated a potential increase, and we did confirm that the trend has indeed increased. We expect that the coin has the potential to break out for several reasons, and we will closely monitor its progress in the short term.
One significant target for AMB is a 150% increase to reach the 0.07 trend level. However, given the current market conditions, we understand that a breakout may not occur immediately. Therefore, we will also track the coin's long-term performance if it does not break out in the short term.
Additionally, the AMB coin has demonstrated impressive stability, making it an interesting asset to follow. We will continue to analyze it coming time.

BTC - Potential Long-Term Reversal?🔎Hello TradingView Family / Fellow Traders. This is Richard, as known as theSignalyst.
🗒 As per my last educational post like 2 months ago, we might be in Pattern 4 => falling correction after a bearish impulse, leading to a bullish reversal.
BTC rejected the lower bound of the green channel and traded higher.
📌 However, for the pattern to get activated, we need a weekly break above the last major high in green, around 22,000
Meanwhile, BTC is sitting around the lower bound of the falling green channel, after completing the big correction inside the rising red channel.
📌 For the bulls to remain in control medium-term , we need a daily close above the 19,000. In this case a movement till the 20,500 FTX crash supply zone would be expected.
Again, for a long-term shift in momentum from bearish to bullish, we need a break above 22,00
📉 Which scenario do you think is more likely to happen? and why?
Always follow your trading plan regarding entry, risk management, and trade management.
Good luck!
And remember:
🗒 All Strategies Are Good; If Managed Properly!
~Rich
