Liquidity Trap or Smart Money Play? SUI Price Poised for Big Liquidity Trap or Smart Money Play? SUI Price Poised for Big Move Ahead”\
👋 Hello Traders & Investors,
Looking at SUI, the price action is showing a very interesting structure between the support zone ($11B – $11.5B) and the resistance zone ($14.5B – $15.5B). We already saw a strong impulse leg earlier, followed by a deep pullback, which created a clear lower high formation. Since then, the market has been rejecting each rally attempt and moving inside a descending structure, proving that sellers are still trying to keep control.
What stands out is the fake break below support — a classic liquidity grab where weak hands were shaken out before price quickly bounced back. Since then, liquidity has been building along the descending line, suggesting that the market is preparing for a possible stronger move.
From my perspective, the support zone is the key. As long as $11B continues to hold, there’s a high probability of seeing a sharp bullish reaction targeting the $14B area and potentially higher if momentum follows through. But if this support breaks convincingly, we may first see a deeper correction before any meaningful reversal begins.
⚡ My Opinion: This setup is worth watching closely. I believe buyers are waiting at the support to trigger a strong move upward, and the next liquidity sweep could fuel the rally. For me, the plan is simple — watch the reaction at $11B and ride the momentum toward the $14B–$15B region if confirmation comes.
Viralchart

XAUUSD Update – Resistance Rejection and Market Structure Shift"XAUUSD Update – Resistance Rejection and Market Structure Shift
Price Action: Gold has recently tested the 3550 – 3600 resistance zone, where the market showed signs of rejection. This level represents a significant supply area formed by previous liquidity grabs.
Market Structure: After a strong bullish impulse, the current price behavior suggests a possible correction phase. The rally left behind areas of imbalance that could attract price back downward.
Key Observation:
The first reaction zone sits around 3480, which aligns with a structural support level from past consolidation.
A deeper correction may extend toward the 3330 – 3320 support region, a critical level where historical demand has been observed.
Context: Liquidity above recent highs has been taken, and the chart now shows potential for retracement to restore balance before determining the next directional move.

“XAUUSD – Strong Sell Setup from All-Time High Resistance “XAUUSD – Strong Sell Setup from All-Time High Resistance 🚨📉”
Currently, gold has reached a strong resistance zone around 3575 – 3600, where price is showing signs of exhaustion after a strong bullish rally. This area is a key supply zone and could trigger profit-taking or fresh short entries.
From here, I am expecting a potential correction move.
1st Target: Around 3480 – 3450, where we can see a clear demand zone and previous consolidation.
If bearish pressure continues, the price may extend towards the final target at 3330 – 3320, which is also a key support point aligned with previous market structure.
Market structure shows a clear higher low formation earlier, which fueled this rally, but after tapping into resistance, a short-term pullback seems highly likely.
📌 Overall, short-term bias = bearish correction, while long-term trend remains bullish unless price breaks below the 3320 support zone.

"Gold’s Critical Bounce Zone – Is $3,400 the Next Magnet Level?""Gold’s Critical Bounce Zone – Is $3,400 the Next Magnet Level?"
📊 XAUUSD is showing a textbook bullish structure setup after forming a Higher Low right above strong support at $3,339. Price is now trading inside the Entry Zone ($3,348 – $3,339), an area that aligns with:
✅ Order Block Support
✅ Previous Break of Structure (BOS)
✅ Smart Money Fair Value Gap (FVG) retest
🧐 Market Structure Insight
Recent BOS flipped bias to bullish after buyers pushed through prior resistance.
A bullish FVG from earlier in the trend still holds influence, attracting price back for a healthy retest.
The current Higher Low shows buyers stepping in early, maintaining upward momentum.
Strong resistance is located at $3,400 – $3,440, which also acts as a psychological magnet for traders.
🎯 Trade Plan (Educational Example)
Entry Zone: 3,348 – 3,339 📍
Stop Loss: below 3,339 🛑
Target 1: 3,380 🎯 (partial profits)
Target 2: 3,400 ⭐ (main target)
Extended Target: 3,420 – 3,440 💎
📈 Reward to Risk: ~1.6R to the main target, with potential 2.9R to extended resistance if momentum accelerates.

Bitcoin Manipulation or Opportunity? Watch This Zone!⚡ Bitcoin Manipulation or Opportunity? Watch This Zone!
The chart highlights significant liquidity zones, BOS (Break of Structure), and liquidity sweeps, pointing to how price action is driven by institutional order flow.
🔎 Key Observations:
Break of Structure (BOS): Multiple BOS points confirm shifts in market direction as price transitioned from bearish → bullish → bearish again.
Liquidity Grab: Notice how price swept liquidity around previous support before reversing—classic manipulation to trigger stop losses before a move higher.
Downtrend Liquidity Channel: Price followed a controlled bearish liquidity channel after rejecting the resistance zone at 120,000 – 123,000, showing distribution.
Liquidity Sweep (Latest Move): The recent sweep near 108,000 suggests that sellers were trapped, providing liquidity for potential buy-side movement.
Projection: Based on the liquidity sweep, a rebound toward 116,000 – 118,000 is anticipated ⭐. However, interim resistance at 112,000 must be broken and retested to confirm bullish continuation.
⚠️ Risk Note: If price fails to hold above the liquidity sweep zone, a deeper correction could occur.
📌 Conclusion:
BTCUSD is showing signs of a bullish reversal after liquidity manipulation. Traders should watch for confirmation above 112,000 to target the 116,000 – 118,000 range, aligning with smart money concepts.

“Layers of Liquidity: The Hidden Brushstrokes in XAUUSD”“Layers of Liquidity: The Hidden Brushstrokes in XAUUSD”
When I observe this chart, it feels much like studying a Renaissance painting—full of depth, contrast, and hidden meaning. Every candle tells a story, just like brushstrokes on a canvas.
The strong support zone at 3260–3300 acts like the foundation of the painting, the solid base on which the entire composition stands. Just as an artist relies on balance in structure, the market relies on this level for equilibrium.
The resistance zone near 3440–3460 resembles the sky in a painting—bright and tempting, yet out of reach for now. The fake breakout projected above this level can be compared to an illusion of light in art: it draws the eye upward, but the truth lies in the shadow beneath.
Every higher low crafted along the way mirrors the gradual layering technique used by master painters, building depth and strength in the image. It is not a random stroke—it’s deliberate, showing that buyers are stepping in consistently, giving the chart rhythm and structure.
The liquidity sweep resembles the hidden symbolism often placed in classical artworks. At first glance, it might look chaotic, but its purpose is intentional—to trap participants and prepare for the next phase of movement.
From an educational perspective, this chart demonstrates that markets, like art, are a mixture of illusion and reality. Breakouts may be false, supports may be tested, but the true skill lies in learning how to interpret these strokes. Just as art critics read the layers of paint, traders must read the layers of price action.

Bitcoin 4H Chart | Trend is My Best Friend – Smart Money Points Bitcoin 4H Chart | Trend is My Best Friend – Smart Money Points to 119K 🚀🔥”
Market Structure
The price recently rejected the key resistance zone (120,000 – 123,000 USD), which acted as a strong supply area.
After the rejection, BTC experienced a sharp decline forming lower highs and lower lows, indicating short-term bearish momentum.
Multiple Break of Structure (BOS) levels confirm bearish pressure, but the price is now approaching a significant demand zone.
2. Liquidity & Demand Zones
A clear liquidity sweep occurred near the 123,000 zone, where buyers were trapped before the drop.
The Demand Zone and Bullish Order Block (OB) around 112,000 – 114,000 USD serve as the primary area of interest for institutional buying.
This zone overlaps with previous support, strengthening its validity as a high-probability reversal point.
3. Entry & Targets
Entry Zone: Highlighted between 114,000 – 115,500 USD, where demand is expected to absorb sell orders.
First Target: 119,000 USD – this aligns with the chart’s projection and acts as a liquidity grab zone before further moves.
Second Target: If bullish momentum sustains, BTC may retest the 120,000 – 123,000 resistance range.
4. Risk Factors
If BTC breaks below 112,000 USD, the demand zone will be invalidated, potentially opening downside continuation toward 110,000 USD.
Strong rejection at 119,000 USD could also bring sellers back into control.
📌 Conclusion
BTC is currently in a bullish accumulation phase after a heavy correction. Price is sitting at a high-probability demand zone where institutional buying interest is expected. The next impulsive move is projected toward 119,000 USD, with potential continuation toward 120,000 – 123,000 USD, but rejection at resistance remains a risk.

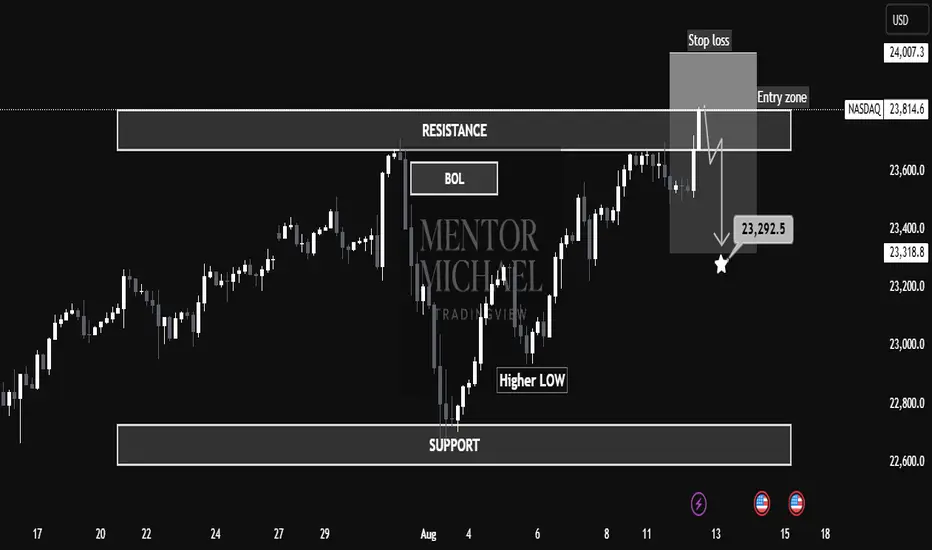
NASDAQ at Make-or-Break Resistance – Is a Sharp Drop to 23,292 "📉 NASDAQ at Make-or-Break Resistance – Is a Sharp Drop to 23,292 Next?"
📊 NASDAQ is currently trading within a well-defined resistance zone (23,812 – 24,007) after a recent rally from the support base near 22,800. The structure suggests a potential sell-side setup if price respects the resistance and fails to break higher.
🧐 Market Structure Analysis
Support Zone: Around 22,800, where buyers previously stepped in, forming a Higher Low and initiating the last bullish leg.
Resistance Zone: 23,812 – 24,007, marked by previous rejections and a Break of Liquidity (BOL).
Price has tapped into the entry zone just below resistance, hinting at possible exhaustion from buyers.
The chart indicates a bearish bias from this zone, aiming for a move toward 23,292.5 (marked target).
🎯 Educational Trade Example
Entry Zone: 23,812 – 24,007
Stop Loss: Above 24,007 to protect against breakout rallies.
Target: 23,292.5 (aligned with previous structural support).
Rationale:
Trading against strong resistance offers asymmetric R:R if momentum shifts bearish.
The Higher Low before resistance can act as liquidity fuel for sellers once demand weakens.
Clear invalidation point keeps risk defined.
⚠ Invalidation Scenarios
A strong breakout and close above 24,007 with follow-through volume would invalidate the short idea and potentially signal continuation toward 24,200+.
💡 Key Takeaways for Students
Zone-to-Zone Trading: Always define both entry and exit zones before execution.
Structure Before Strategy: The market’s reaction to resistance is the clue — confirmation comes before position sizing.
Risk Management is Non-Negotiable: Even high-probability setups require strict stop placement.
"BTCUSD Technical Outlook: Support Holds, Bulls Aim for $117K""BTCUSD Technical Outlook: Support Holds, Bulls Aim for $117K"
Market Structure Overview
BOS (Break of Structure): Multiple BOS points indicate strong shifts in market direction, confirming both bullish and bearish trends across different zones.
Bearish Fair Value Gap (FVG): This zone, marked after a BOS on July 23–24, acted as a rejection area, initiating a sharp sell-off — a classic bearish imbalance fill and reversal.
Equal Lows & Sell-side Liquidity: This area attracted liquidity grabs, as smart money hunts resting stop losses below these equal lows before reversing direction.
🔸 Key Supply & Demand Zones
Previous Resistance Zone (~118,000 - 120,000): Price rejected this area after filling the imbalance, confirming it as a strong supply zone.
Support Zone (~112,000 - 113,000): Currently acting as a high-probability demand zone. Liquidity accumulation here suggests a possible bullish reversal.
📉 Liquidity Zones
Sell-side Liquidity Sweep: Price dipped below equal lows to collect liquidity, often a signal of institutional accumulation.
Liquidity/Fair Value Zone (~116,000): Acts as a magnet for price, offering potential retracement targets before any major trend continuation.
📈 Forecast & Target
Current Price: $114,061
Short-term Target: $117,546 — aligning with previous FVG imbalance and liquidity zone.
Bias: Bullish Reversal expected from support zone toward the previous inefficiency and resistance levels.
🎓 Educational Takeaways
BOS Confirmation is critical in validating trend shifts and structure breaks.
FVGs (Fair Value Gaps) highlight inefficiencies and offer high-probability reversal or continuation zones.
Liquidity Sweeps near equal lows/highs often precede smart money moves — useful for spotting entries and exits.
Volume Profile (left side) suggests higher activity zones — these areas often align with major turning points.
✅ Conclusion
BTCUSD has swept liquidity below support and is showing signs of reversal. If the bullish pressure holds above $113,000, a move toward the $117,500 zone is likely, targeting previously unfilled imbalance and trapped liquidity.

"Gold on Fire! Smart Money Bulls Aiming for Final Target🟡 "Gold on Fire! Smart Money Bulls Aiming for Final Target
Overview:
The XAUUSD chart presents a clear smart money structure, showing a bullish recovery from a strong demand zone and a current move toward a significant supply (resistance) area.
🔍 Key Technical Highlights:
Strong Support Zone
The price reacted powerfully from the well-marked strong support zone (~3,260), aligned with a previous Bullish Fair Value Gap (FVG) and BOS (Break of Structure), confirming bullish intent.
Bullish Market Structure
A clean CHoCH (Change of Character) confirmed the end of the previous bearish leg.
Multiple BOS followed, solidifying the bullish shift in momentum.
Liquidity Grab & Price Expansion
Price swept equal lows (EQL) and mitigated bullish FVG, collecting sell-side liquidity before reversing.
The breakout pushed toward the current level of ~3,380, targeting the Buy-Side Liquidity zone and resistance.
Resistance & Fair Value Gap
The final target is aligned at 3,427.83, situated inside a high-probability bearish FVG and resistance zone.
This area previously rejected price (noted with the red circle), making it a critical supply zone.
Partial Target Hit
Price has already achieved half of the projected move, indicating bullish strength and proper SMC execution.
The current consolidation near the mid-level suggests accumulation or re-accumulation before a final push toward the target.
📈 Educational Notes:
Fair Value Gaps (FVG) highlight inefficiencies in price delivery. These zones often act as magnets for price and reversal points, as seen here.
Break of Structure (BOS) and Change of Character (CHoCH) are crucial for identifying trend shifts. This chart reflects a textbook bullish transition.
Liquidity concepts (EQL, Buy-Side) emphasize institutional behavior. Price often hunts liquidity before moving to new highs or lows.
✅ Conclusion:
XAUUSD is playing out a well-structured bullish smart money setup, with price currently in mid-path toward the final target. Traders should monitor reactions at the 3,427 resistance zone, which will be critical for potential reversal or continuation scenarios.

BTCUSD Technical Analysis – Smart Money Concept Based
🔍 BTCUSD Technical Analysis – Smart Money Concept Based
🕒 Timeframe: Intraday (likely 1H or 4H)
📅 Date: August 5, 2025
📉 Price: ~114,445 USD
📌 Key Zones and Observations
🔴 Previous Resistance (117,000–119,000)
This area has a strong high formed after multiple equal highs (EQH), indicating a liquidity pool above.
Price sharply rejected this zone, validating it as a significant supply zone.
🔵 Support Zone & Liquidity Pool (~112,600–113,200)
This is a high-volume node (visible on VRVP) where price consolidated previously.
Market structure suggests liquidity resting below, as indicated by the marked “Target” area at 112,648.
Smart Money may aim to sweep liquidity below this support zone before any meaningful reversal.
🟤 Order Block & Rejection at 115,210–116,065
Price tapped into a bearish order block, creating a minor change of character (ChoCH) and then started to decline.
Rejection from this zone signals distribution by institutions or Smart Money, leading toward bearish continuation.
🟢 Value Gap and Imbalance (Above 115,000)
A visible value gap still remains unfilled; however, current momentum is bearish, and price failed to reclaim it, hinting downside continuation.
🔄 Market Structure
BOS (Break of Structure) to the upside confirmed short-term bullish momentum.
CHoCH back to the downside near current price reflects bearish shift in order flow.
Price is respecting lower highs, and failing to break above 115,210 confirms a bearish bias.
🎯 Target and Outlook
Primary Bearish Target: 112,648 USD
This is a liquidity pool and previous support area where institutions may look to rebalance and accumulate.
Scenario:
If price retests 115,000–115,210 again and fails, expect strong continuation downward toward the 112,648 target.
If price breaks and holds above 116,065, bullish invalidation may occur, and we can look for higher retracement toward 117,000–119,000.
✅ Conclusion
BTCUSD is currently respecting a bearish order block, with Smart Money likely targeting liquidity resting below at 112,648 USD. Unless price breaks above 116,065 with strong volume, the bias remains bearish short-term.

XAUUSD Technical Analysis – Bullish Continuation SetupXAUUSD Technical Analysis – Bullish Continuation Setup
📊 Market Structure Overview:
The chart shows a clear bullish structure shift, marked by multiple Break of Structure (BOS) events that validate strength from buyers. After forming equal lows and a liquidity sweep at the strong support zone, price has aggressively moved higher, breaking through minor resistance levels and showing clear bullish intent.
🧱 Key Technical Elements:
🔹 1. Strong Support Zone (Demand Rejection)
Price respected the strong demand zone between $3,260 – $3,280, where aggressive buying was seen after forming a bullish engulfing breakout. This zone aligns with previous demand and a major BOS, confirming institutional buying interest.
🔹 2. Bullish Order Flow & Break of Structure (BOS)
Multiple BOS levels across July and early August highlight a sequence of higher highs and higher lows, indicating trend continuation.
The most recent BOS after July 30 shows an impulsive break, confirming bullish dominance and clean order flow.
🔹 3. Fair Value Gaps (FVGs)
Bullish FVG (Mid-July): Price respected and bounced from this zone, showing previous imbalance was filled and used as a base for continuation.
New FVG (Above $3,420): The current upside target lies within this area, acting as a magnet for price due to unfilled orders.
🔹 4. Buy-Side Liquidity & Target Zone
The market is approaching a buy-side liquidity zone around $3,385, a key short-term target where previous highs and stop orders are likely pooled.
If liquidity above $3,385 is taken efficiently, price may expand into the FVG zone between $3,420 – $3,460.
🔹 5. Bullish Confirmation & Momentum
The candle structure shows a clean bullish impulsive move, followed by minor consolidation—likely a bullish flag/pennant indicating potential for further continuation.
Momentum is favoring buyers, and short-term consolidation above $3,340 is healthy for continuation.
🔐 Liquidity & Institutional Narrative
Equal Lows (EQL) and FVG fills suggest prior liquidity was swept and used to fuel institutional long positions.
The recent BOS confirmed that smart money has shifted bias toward longs, and price is now targeting remaining inefficiencies to the upside.
The clear alignment of BOS, liquidity sweep, and bullish FVGs reinforces a strong institutional footprint on this move.
🔍 Key Levels to Watch:
Level Type Price Zone (USD)
🔺 Resistance / FVG 3,420 – 3,460
🎯 Immediate Target 3,385
📉 Short-Term Support 3,340 – 3,320
🛡️ Major Demand Zone 3,260 – 3,280
📌 Conclusion & Outlook:
XAUUSD has initiated a strong bullish leg from the demand zone, confirming accumulation and structural reversal. Price is now moving toward the buy-side liquidity target of $3,385, with potential continuation toward the FVG resistance zone of $3,420–$3,460.
As long as price remains above the $3,320 structure support, the bullish bias remains intact. Any pullbacks should be seen as buying opportunities, especially on lower timeframe confirmations.

BTC Hits Premium Zone – Bearish Reversal Loading? BTC Hits Premium Zone – Bearish Reversal Loading?
🧠 Technical Breakdown:
🔹 1. Previous Market Structure & CHoCH
The chart shows a clear shift in structure (CHoCH) on the left, which marked the start of the bearish leg.
Break of Structure (BOS) confirms continuation of lower highs and lower lows until recent liquidity grab near the $112,551 zone.
Equal highs and liquidity above were taken out, making the move into the Premium Order Block zone highly significant.
🔹 2. Liquidity and Fair Value Gap (FVG) Zones
A major Liquidity + FVG zone was left unmitigated between $113,000–$112,000, and price is likely to revisit it.
This aligns with the target zone at $112,890, which is highlighted as a magnet for price to rebalance the inefficiency.
🔹 3. Order Block & Premium Supply Zone
A well-defined Order Block is marked just below the resistance zone near $115,166–$116,021.
Price is currently retracing into this zone, suggesting a potential reaction point for smart money to re-enter shorts.
Volume is expected to pick up here, and a reversal could initiate if price fails to break above this supply.
🔹 4. Volume Profile and Market Imbalance
Volume clusters are heaviest near the $114,000–$114,300 range, indicating high activity and previous accumulation/distribution.
Thin volume near the $112,551 zone further confirms price may drop quickly if rejection happens.
🔹 5. Support & Liquidity Sweep
Support zone around $112,551 is a previous liquidity pool and weak low that has not been fully cleared.
Price is likely to revisit this zone in the short term to clear liquidity and complete market rebalancing.
🔐 Institutional Narrative:
Smart money engineered a liquidity sweep to the downside, then caused a retracement into premium.
Now, BTC/USD is positioned in a high-risk zone where sell-side institutions may enter to push price lower.
If this order block holds, expect a rejection toward $112,890, followed by possible deeper continuation into the liquidity void below.
📌 Key Levels:
Level Price (USD)
Strong Resistance Zone 115,166 – 116,021
Order Block (Sell Area) 114,800 – 116,000 (approx.)
Immediate Support 113,000 – 112,551
Target (Liquidity Zone) 112,890
Weak Low (Final Sweep) 112,000
📉 Trade Outlook & Strategy:
🔺 If price reacts bearishly at Order Block:
Look for lower timeframe BOS/CHoCH confirmation.
Entry: Short on rejection at or near $115,000–$115,500
Target 1: $112,890
Target 2: $112,000 (extended liquidity sweep)
Stop-loss: Above $116,200 (invalidates bearish OB)
🔻 If price breaks and closes above $116,021 with momentum:
Structure flips bullish, and the OB is invalidated.
Look for long setups on retracement to $114,000 zone.
🧭 Conclusion:
BTC/USD is currently trading within a Premium Zone, testing a strong Order Block below key resistance. Price may face a bearish reaction, targeting the liquidity zone at $112,890. Smart money footprints suggest a potential trap for breakout buyers, and if momentum fades, we can expect a downside reversal to sweep remaining liquidity.

DOGEUSDT Technical Analysis – Bullish Reversal Anticipated DOGEUSDT Technical Analysis – Bullish Reversal Anticipated
🔍 Key Technical Zones:
Support Zone: $0.1990 – $0.2015
Strong bullish reactions noted from this level in previous attempts.
Confluence with volume accumulation on the left (as seen in the Volume Profile).
Signifies a strong demand zone where buyers are stepping in.
Resistance Zone / Target: $0.2220 – $0.2240
Previous structural high and supply zone.
Marked as the first major liquidity area.
Also aligns with imbalance and CHoCH (Change of Character), a common SMC concept.
🔄 Market Structure:
CHoCH (Change of Character) marked multiple times, indicating attempts by bulls to reclaim structure.
Recent price action shows accumulation near support.
Sideways consolidation suggests potential for a bullish breakout.
Liquidity sweep of recent lows could indicate that smart money is accumulating positions before a move higher.
🎯 Trade Setup Idea:
Entry Area: Between $0.2000 – $0.2060 (inside the support zone)
Target: $0.22396 (as marked)
Stop Loss: Below $0.1980 (below the visible support range)
🔧 Indicators and Tools Used:
Volume Profile (VRVP): Shows most volume traded around $0.205 – $0.207, indicating strong positioning from market participants.
Smart Money Concepts (SMC): CHoCH and liquidity concepts signal potential accumulation and reversal.
Price Action Analysis: Clean swing structure with support-resistance rotation visible.
📌 Conclusion:
DOGEUSDT is currently trading in a range-bound structure with a bullish bias from the support zone. If the price sustains above $0.205 and breaks above minor resistance, the upside target of $0.22396 is likely. This setup is supported by strong volume accumulation and smart money structure shifts.

BTCUSD Technical Analysis (Smart Money Concepts) BTCUSD Technical Analysis (Smart Money Concepts)
Market Structure Overview:
Break of Structure (BOS) observed multiple times confirms a strong bearish trend.
Change of Character (CHoCH) around 30th July indicated initial shift from bullish to bearish intent.
Price has been forming lower highs and lower lows, respecting the bearish structure.
Key Zones:
🔴 Previous Resistance Zone (119,000 - 120,500)
Strong supply area from where price sharply reversed.
Also aligned with a Strong High marked at ~$120,000 – key for any future bullish invalidation.
🟫 Current Target Zone – 116,000
Acts as an immediate imbalance fill/FVG retracement zone.
Target highlighted as potential retracement point before continuing lower.
🟦 Liquidity / Fair Value Gap (FVG) Zone
Located between ~115,800 and 114,500.
Price may aim to revisit this zone on pullback, filling inefficiencies.
🟩 Support Zone (~113,000)
Price currently reacting near this zone.
This area has acted as a demand zone in the past and is expected to provide short-term support.
Volume Profile & Order Flow:
Visible Range Volume Profile shows heavy activity near the resistance cluster, indicating strong distribution by institutional players.
Low volume in the FVG area further confirms inefficiency and potential for a retracement move.
Smart Money Perspective:
The current structure reflects distribution at highs, followed by markdown phase.
Price swept liquidity below local lows and may now seek to mitigate previous supply or FVG around 116,000 before resuming bearish trend.
📌 Conclusion:
Bias: Bearish until 116K is tested and rejected.
Next Move Expectation: Possible liquidity sweep → bounce to 116K → short continuation.
Invalidation Level: Break and close above 117K would signal strength returning.
✅ Educational Note:
This is a classic Smart Money trap setup — liquidity grab near lows, fakeout pump to FVG, and potential short continuation. Traders should be cautious of fake rallies into known supply zones.

XAUUSD – Strong Bullish Reversal from Key Support XAUUSD – Strong Bullish Reversal from Key Support
Chart Summary:
Gold (XAUUSD) has shown a clear reaction from a strong support zone near 3260, suggesting bullish momentum is gaining strength. The chart highlights multiple key market structure elements and confirms the potential for a bullish move.
Technical Highlights:
🔻 Strong Support Zone (3260–3280):
Price tapped into a well-defined demand zone with historical significance, initiating a bullish response.
🔺 Resistance Zone (3460+):
A strong resistance level lies ahead. This area may act as a potential target for bulls.
🔁 Break of Structure (BOS):
Multiple BOS marks on the chart indicate trend shifts and liquidity grabs. Most recent BOS aligns with potential reversal.
💹 Bullish Fair Value Gap (FVG):
A bullish FVG near mid-structure confirms institutional interest and adds confluence to the upside move.
📈 Target: 3,366.984 USD
Marked as the next probable short-term liquidity target. If momentum sustains, price may approach resistance above this.
Price Expectation:
If the current bullish momentum holds above the strong support zone, we may see a rally towards 3,366–3,400 USD.
This move could be driven by:
Buy-side liquidity grab above prior highs
Breakout traders entering above BOS
Reaction to macroeconomic calendar (highlighted on the chart)
✅ Educational Takeaway:
This is a textbook example of:
Support-resistance flip
Liquidity concepts (Buy-Side Liquidity)
Fair Value Gaps usage
Volume Profile confluence

BTCUSD Technical Analysis – Bearish Momentum Towards Fair Value BTCUSD Technical Analysis – Bearish Momentum Towards Fair Value Gap
Bitcoin is showing clear bearish pressure after rejecting from the previous resistance zone around 118,800 – 120,000. The market structure and smart money concepts indicate potential for further downside.
🔍 Key Observations:
Previous Resistance Respected: Price failed to break through the strong resistance zone marked near the 119,200–120,000 level, showing strong institutional selling interest.
Market Structure Breaks:
BOS (Break of Structure) and CHoCH (Change of Character) confirmed bearish shift.
Price has maintained lower highs and lower lows, signaling a bearish trend.
Liquidity/Fair Value Gap Zone: The market is currently targeting the liquidity/FVG zone between 116,400 – 116,100, which aligns with price inefficiency and unfilled orders.
Support Zone Ahead: A strong support zone is visible near 115,600 – 115,200. Expect a potential reaction or consolidation here.
📌 Strategy & Bias:
Short Bias Active until price reaches 116,116 (target).
Watch for possible bullish reversal signs in the support/FVG zone.
Ideal for scalp-to-swing short trades, with tight SL above recent EQH.
📚 Educational Notes:
Fair Value Gaps (FVG) indicate institutional imbalances and are often revisited by price.
CHoCH and BOS are early signals of smart money moves – always monitor them in confluence with volume and zones.

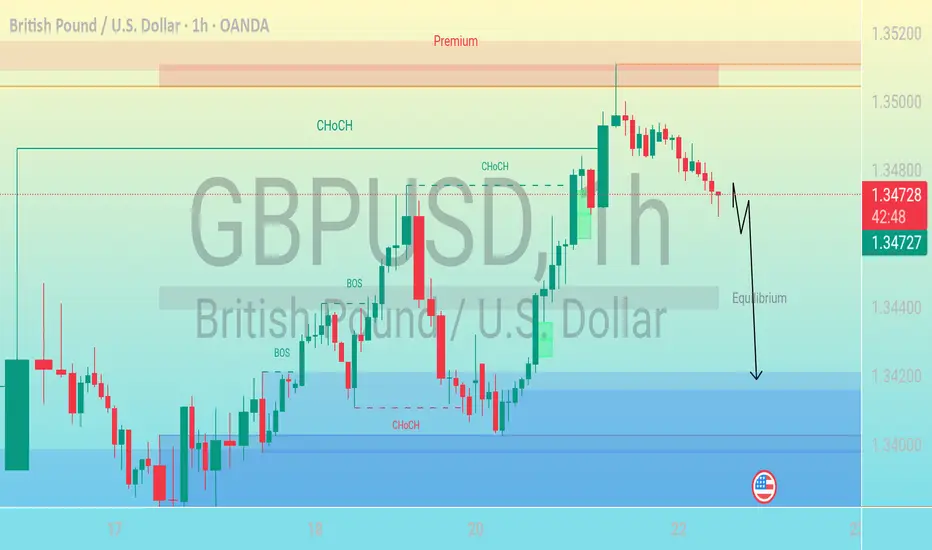
Bearish Move After CHoCH – Targeting Discount Zone"This is a GBP/USD (British Pound / U.S. Dollar) forex trading chart on the 1-hour timeframe, published on TradingView. Let’s break down and describe its key elements:
---
🕒 Timeframe & Pair
Currency Pair: GBP/USD
Timeframe: 1-hour (each candlestick = 1 hour)
Date & Time: July 22, 2025, 06:12 UTC
---
📉 Price Action
Current Price: ~1.34690
The price has recently moved from a premium zone (upper part of the range) and is heading downward.
The red candle at the top shows bearish momentum starting to form after a rally.
---
🔁 Market Structure Labels
CHoCH = Change of Character
Signals a possible reversal or shift in trend (e.g., from bearish to bullish or vice versa).
Several CHoCH points are marked throughout the chart, indicating key shifts.
BOS = Break of Structure
Indicates a significant breach of previous market structure (e.g., support/resistance).
Suggests a trend continuation or momentum confirmation.
---
⚖️ Zones
Premium Zone (Top shaded region):
Price considered overvalued, typically a good area for potential short (sell) positions.
Discount Zone (Bottom shaded region):
Price considered undervalued, potential area for buys.
Equilibrium (Middle horizontal level):
Represents fair value or a midpoint between premium and discount zones.
The price is expected to return here before potentially continuing lower.
---
⬇️ Projected Movement
A downward arrow is drawn from the current price, suggesting:
The analyst expects a pullback to the equilibrium level.
Followed by a further decline into the discount zone around 1.34200 or lower.
---
🇺🇸 News/Event Icon
U.S. flag icon near the expected price drop indicates a potential economic news release or event from the U.S. that could influence the price movement.