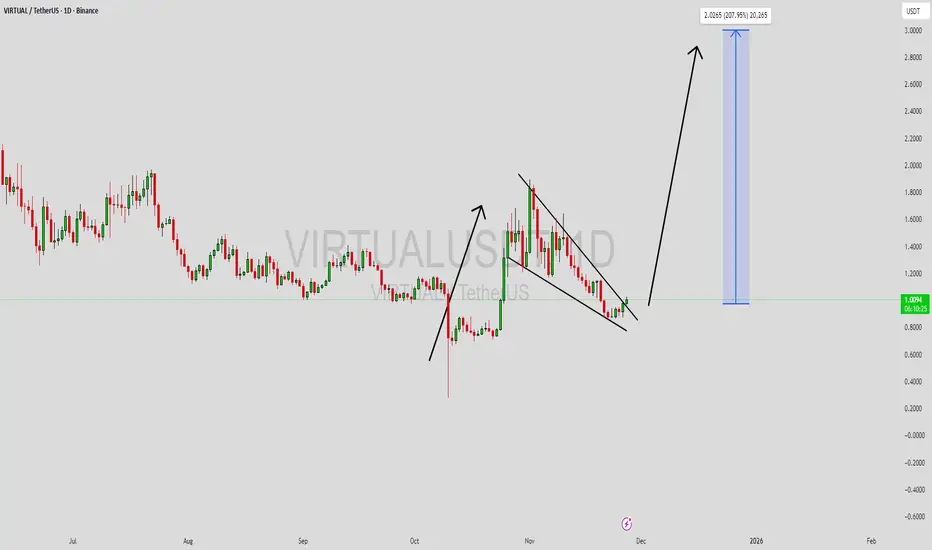
VIRTUAL more gain awaits 16% toward 1.28$ hi
BINANCE:VIRTUALUSDT is showing signs of a 16% potential upside, aiming for a target of $1.28.
VIRTUALUSDT

Virtuals Protocol VIRTUAL price analysisThe market is slowly coming back to life 👀
No euphoria yet, but the first sparks are already visible.
So far, memecoins are leading the move, but a few non-meme projects are starting to show strength as well.
One of them is Virtuals Protocol.
📊 On the OKX:VIRTUALUSDT.P chart, price is trying to hold the upper part of the channel, which is a constructive sign in current market conditions.
If buyers manage to secure acceptance above $0.90, the structure opens the door for a move toward $1.50–1.60.
❓ Is this the beginning of a larger move, or just another short-lived bounce?
🧠 DYOR | This is not financial advice, just thinking out loud.
______________
◆ Follow us ❤️ for daily crypto insights & updates!
🚀 Don’t miss out on important market moves
🧠 DYOR | This is not financial advice, just thinking out loud

VIRTUAL/USDT – Descending Triangle at Major Demand Zone!VIRTUAL/USDT on the 12-hour timeframe is currently in a bearish consolidation phase after a strong decline from its previous peak. Price continues to form lower highs and is now approaching a major demand zone, highlighted by the yellow box between 0.702 – 0.640 USDT.
This area acts as a critical decision zone for the next market direction.
---
Pattern Explanation
The price structure clearly forms a Descending Triangle pattern:
A descending upper trendline indicating consistent selling pressure
A relatively flat lower support line around the demand zone, showing buyer defense
Descending Triangle is typically a bearish continuation pattern, however, since it is forming directly above a strong demand zone, a technical rebound or reversal remains possible.
---
Key Levels
Support (Demand Zone):
0.702 – 0.640 USDT (major demand area)
A clean break below 0.640 would confirm bearish continuation
Resistance Levels:
0.818
0.985
1.145
1.500
1.825 – 1.900 (major supply & previous high)
---
Bullish Scenario
Price holds above the 0.640 – 0.702 demand zone
A confirmed breakout above the descending trendline
Ideal confirmation: 12H candle close above trendline with rising volume
Bullish targets (step by step):
1. 0.818
2. 0.985
3. 1.145
4. 1.500 (if strong momentum follows)
This scenario reflects a potential reversal from demand, leading to a solid relief rally.
---
Bearish Scenario
Price breaks and closes below 0.640
Descending Triangle confirms as bearish continuation
Buyers fail to defend the demand zone
Bearish continuation targets:
0.580
0.520
Deeper downside possible if selling pressure accelerates
---
Conclusion
VIRTUAL/USDT is currently trading at a key decision area.
The 0.702 – 0.640 USDT demand zone will determine the next major move:
Hold + breakout above trendline → bullish reversal potential
Breakdown below 0.640 → bearish continuation confirmed
Patience is required, as this zone offers high risk–high reward opportunities depending on confirmation.
---
#VIRTUALUSDT #CryptoAnalysis #Altcoin #TechnicalAnalysis #PriceAction
#DescendingTriangle #ChartPattern #SupportAndResistance #DemandZone #CryptoTrading

VIRTUAL has formed an inverted head and shoulders pattern🚨📊 VIRTUAL Update
VIRTUAL has formed an inverted head and shoulders pattern,
a bullish reversal setup.
Price is now testing the red resistance zone 🔴,
which is the key confirmation level.
A breakout above this zone could trigger
strong bullish continuation.
Watching closely for confirmation. 👀

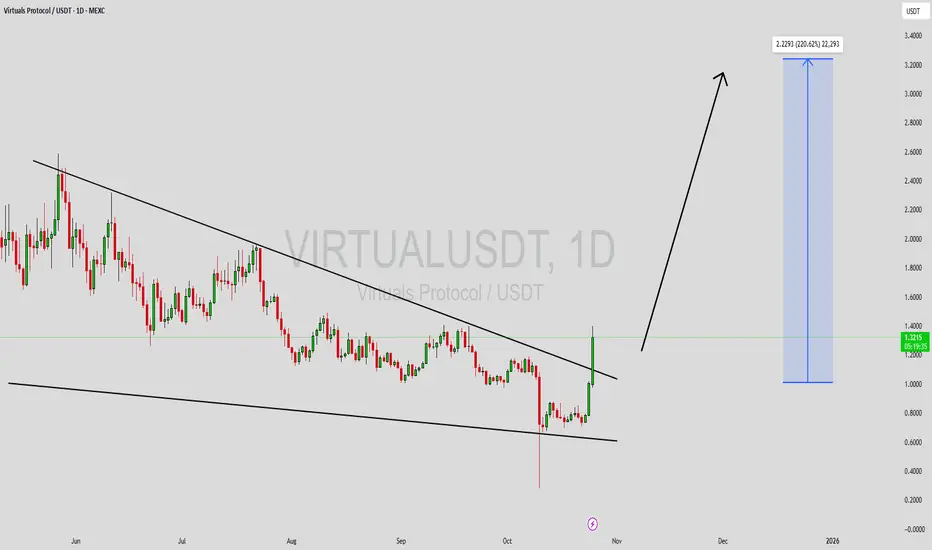
False Breakout Above Triangle — Expecting Real Breakdown to 0.25Price has been compressing inside a large symmetrical triangle for an extended period. Recently, we saw a false breakout to the upside , which was quickly rejected and followed by a return back inside the structure — a classic sign of bull trap.
At the moment, price is holding near the lower boundary of the triangle. After a small corrective bounce, I expect the true move to start with a breakdown below the triangle support, confirming bearish continuation.
If the breakdown is confirmed, the next downside targets are 0.25$ as the first support zone and 0.15$ as the extended target. These levels align with previous structure and potential demand areas.
The bearish scenario remains valid while price stays below the upper trendline of the triangle. A clean breakdown with acceptance below support would confirm the setup.

$VIRTUAL/USDT ANALYSISOn the 4-hour chart of **VIRTUAL/USDT**, price has been moving inside a clear **descending channel** since mid-November, making lower highs and lower lows. Recently, price rebounded from the lower trendline and is now testing the upper boundary of the channel near **$0.98–$1.00**. The candle structure shows that bulls are trying to break out of this channel, but price is still facing resistance from both the **Ichimoku Cloud** and the **EMA trendline**, which are acting as dynamic resistance levels. A confirmed breakout and 4H candle close above **$1.00–$1.05** would indicate a possible trend reversal toward **$1.20–$1.30**, while rejection from this zone could lead to another decline toward the **$0.85–$0.80** support area. Volume has increased slightly on the recent upward move, showing early buying pressure, but a clean breakout confirmation is still needed for strong bullish continuation.

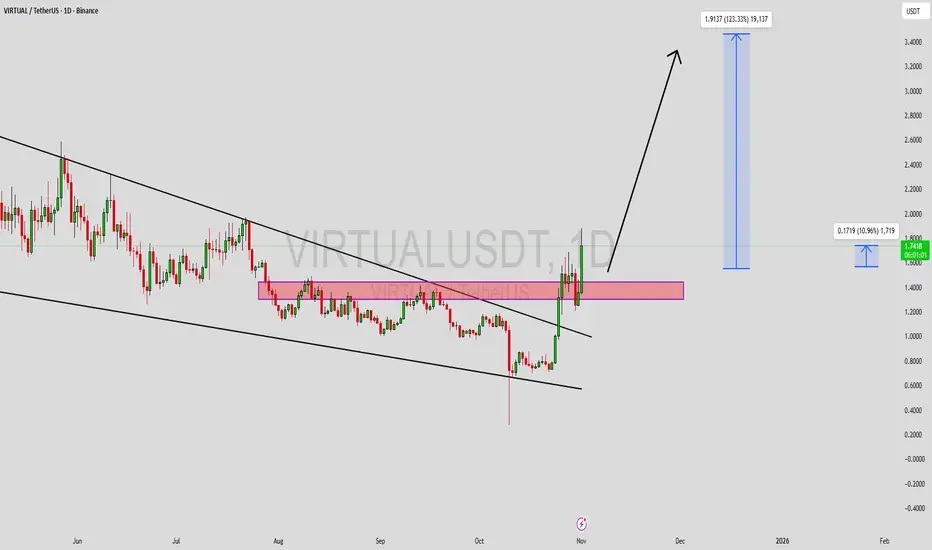
VIRTUALUSDT Forming Falling WedgeVIRTUALUSDT is forming a clear falling wedge pattern, a classic bullish reversal signal that often indicates an upcoming breakout. The price has been consolidating within a narrowing range, suggesting that selling pressure is weakening while buyers are beginning to regain control. With consistent volume confirming accumulation at lower levels, the setup hints at a potential bullish breakout soon. The projected move could lead to an impressive gain of around 190% to 200% once the price breaks above the wedge resistance.
This falling wedge pattern is typically seen at the end of downtrends or corrective phases, and it represents a potential shift in market sentiment from bearish to bullish. Traders closely watching VIRTUALUSDT are noting the strengthening momentum as it nears a breakout zone. The good trading volume adds confidence to this pattern, showing that market participants are positioning early in anticipation of a reversal.
Investors’ growing interest in VIRTUALUSDT reflects rising confidence in the project’s long-term fundamentals and current technical strength. If the breakout confirms with sustained volume, this could mark the start of a fresh bullish leg. Traders might find this a valuable setup for medium-term gains, especially as the wedge pattern completes and buying momentum accelerates.
✅ Show your support by hitting the like button and
✅ Leaving a comment below! (What is your opinion about this Coin?)
Your feedback and engagement keep me inspired to share more insightful market analysis with you!
$VIRTUAL Update📊 SPARKS:VIRTUAL Update
SPARKS:VIRTUAL is testing the red resistance zone 🔴
If it breaks out above, it could confirm a bullish setup 📈
The first target would be the green line level 🟢

Virtuals Protocol Potential Bullish Breakout OpportunityVirtuals Protocol seems to exhibit signs of overall potential Bullish momentum if the price action breaks the previous prominent Higher High with multiple confluences through key Fibonacci and Support levels which presents us with a potential Non-Levered buy and hold opportunity.
Entry: (Buy 1 CMP & Buy 2 around 1 - 0.95 range)
Stop Loss: 0 (Non-Levered Buy & Hold is recommended)
Potential Range for Targets: 2.5 - ATH
Virtuals Protocol (VIRTUAL) Price Can Bounce Back
VIRTUAL has become one of the weakest performers today, dropping 16% in the past 24 hours. The token is currently trading at $1.53 after slipping through two critical support levels.
If market conditions remain weak, VIRTUAL could extend its decline toward $1.37, marking another potential support test. This level will be crucial for determining whether the altcoin stabilizes or faces additional downside.
However, a rebound remains possible as technical indicators show improving signs. The exponential moving averages (EMAs) are approaching a potential Golden Cross, with the signal line nearing a bullish crossover. If confirmed, VIRTUAL could rally toward $2.00, signaling a shift in momentum and invalidating the current bearish outlook.

VIRTUAL - UPDATE: SPARKS:VIRTUAL - Price update:
Strong sell pressure at the moment, likely because of #BTC move 📉
Currently, I keep an eye on this possible expension triangle pattern. Meaning that a successfull test of the green zone / lower trend could lead to another HH 📈
This could be a bullish retest on the daily basis. Bull territorry above 1.150$ level. (second chart).
If we lose the 1.15$ then watch out for the 1.00 $ demand zone.
#dyor #VIRTUAL

VIRTUALUSDT Forming Falling WedgeVIRTUALUSDT is displaying a promising bullish setup with the emergence of a falling wedge pattern, a classic reversal signal that often precedes a significant upward movement. This pattern indicates that the market’s selling pressure is fading, and buyers are gradually gaining control. Once a breakout occurs above the wedge resistance, it could trigger a strong bullish wave, potentially leading to a 90% to 100% gain. Traders are closely monitoring this setup, as the technical outlook suggests a solid opportunity for a sustained rally.
The volume for VIRTUALUSDT remains strong, reflecting growing market confidence and increasing investor participation. Such healthy trading activity adds weight to the possibility of a successful breakout, as volume confirmation is a key factor in validating bullish reversals. A spike in volume on the breakout could serve as a clear signal for momentum traders to enter, further accelerating price appreciation.
Investor sentiment around VIRTUALUSDT continues to improve as more participants recognize its potential upside from current levels. The alignment of technical strength, good liquidity, and improving interest suggests that this pair could outperform in the coming sessions. Traders keeping an eye on this coin may find it to be one of the more attractive short-to-medium-term setups on the market right now.
✅ Show your support by hitting the like button and
✅ Leaving a comment below! (What is You opinion about this Coin)
Your feedback and engagement keep me inspired to share more insightful market analysis with you!
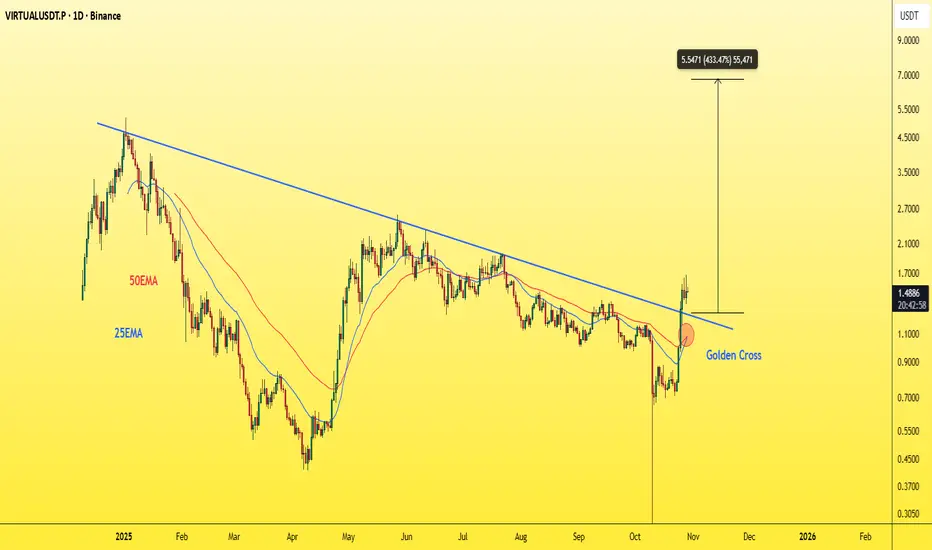
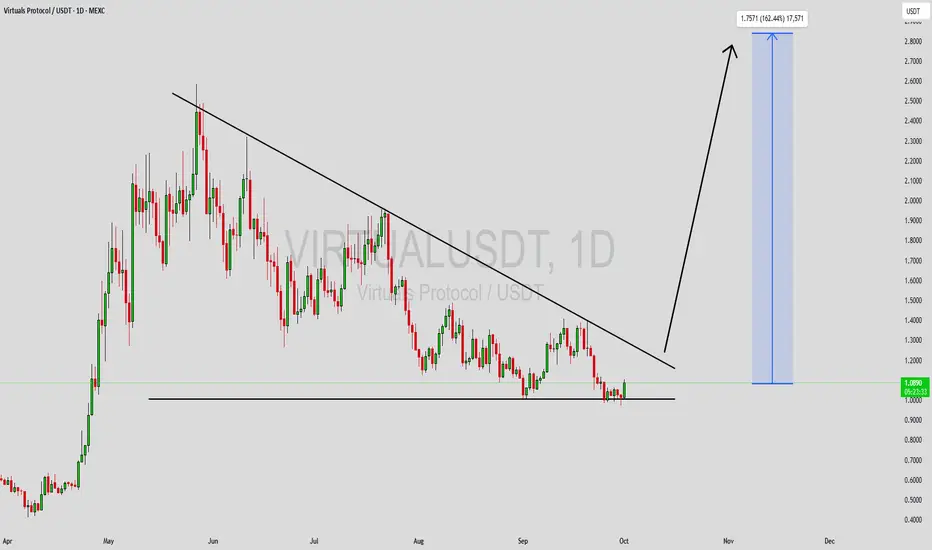
VIRTUAL - Extremely bullishKeep your eyes on it over the next period — it’s about to skyrocket.
It just broke a trendline it’s been trying to break for around 300 days,
and it’s also formed a golden cross on the daily chart.
Best Regards:
Ceciliones🎯
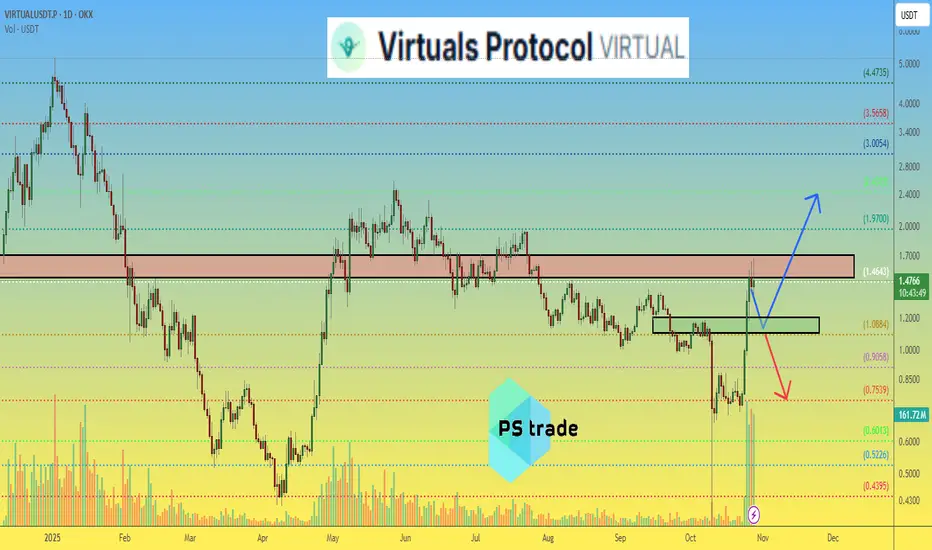
Virtual Protocol price analysis🚀 When you look at the OKX:VIRTUALUSDT.P chart — it feels like the market is waking up again! Strong price action, solid volumes — looks amazing at first glance 👀
But then you see the news — #VIRTUAL getting listed on spot markets... and two thoughts instantly pop up 💭
1️⃣ Pumped on futures to grab attention and unload older bags on spot.
2️⃣ Or — genuine demand forming as spot traders rush in to buy the dip
Right now, around ⅔ of total supply is already in circulation, and Virtuals Protocol market cap sits near $1B 💰
💎 Key zones:
Resistance: $1.50–1.70
Support: $1.10–1.20
So… which scenario do you believe — smart accumulation before another run, or a classic exit pump? 🤔
Drop your thoughts below 👇
______________
◆ Follow us ❤️ for daily crypto insights & updates!
🚀 Don’t miss out on important market moves
🧠 DYOR | This is not financial advice, just thinking out loud.
VIRTUAL Price Jumps 105%, But Here's Why A Reversal Is NextAt the time of writing, VIRTUAL trades at $1.50 after a 105% rise in just four days. The token has received notable support from investors. Strong on-chain activity and trading volume continue to support its current valuation.
However, based on market conditions, VIRTUAL could soon face a short-term pullback. If selling pressure intensifies, the token might fall below the $1.37 support level, extending losses toward $1.14 or even lower.
If investors choose to hold their positions, VIRTUAL could maintain its momentum. A sustained rally above $1.54 may push the token toward $1.65 or even $2.00. Breaking this barrier would invalidate the bearish outlook.
VIRTUAL - BULLISH OUTLOOK! SPARKS:VIRTUAL - Ready for another leg up? 🚀
Cup & Handle H4? - To confirm breakout 💣
Uptrend looks solid, + potential daily retest is cooking! 📈
Bulls could push another 30%+ from here! 🚀
Current price 1.200$
Upper big resistances:
1.380 |1.400$
1.550
1.640
1.800
1.920
#VIRTUAL

VIRTUALUSDT Forming Falling WedgeVIRTUALUSDT is currently trading within a falling wedge pattern a highly regarded bullish reversal signal that often precedes a sharp upward movement. This pattern indicates a phase of consolidation after sustained selling pressure, where the price action narrows down before a potential breakout to the upside. The structure reflects growing strength among buyers who are gradually absorbing selling volume and preparing for a potential breakout move.
The trading volume shows consistent activity, suggesting strong market participation and investor confidence in the project’s fundamentals. When combined with a falling wedge setup, this volume behavior strengthens the case for a bullish breakout. Analysts and traders are closely monitoring this pair, with and expected gain of 190% to 200%+ as momentum indicators begin to turn in favor of buyers. A confirmed breakout from current resistance levels could signal the start of a powerful rally phase.
Investors are increasingly showing interest in VIRTUAL, recognizing its potential both technically and fundamentally. The ongoing market attention and accumulation phase point toward renewed confidence in the asset’s long-term prospects. If this bullish setup follows through, VIRTUALUSDT could emerge as one of the stronger performers among mid-cap altcoins, offering traders an attractive opportunity during the next market leg up.
✅ Show your support by hitting the like button and
✅ Leaving a comment below! (What is You opinion about this Coin)
Your feedback and engagement keep me inspired to share more insightful market analysis with you!
VIRTUALUSDT Forming Bullish WaveVIRTUALUSDT is showing a very promising setup as it forms a bullish wave pattern, which often indicates the continuation of upward momentum supported by strong market structure. This type of pattern suggests that after each wave of consolidation, buyers are stepping in with greater force, pushing the price to new highs. With solid trading volume backing the move, the breakout potential looks strong, creating opportunities for significant upside.
The bullish wave formation highlights the market’s growing confidence in this project. Each higher low reflects accumulation and buying pressure, while the overall wave structure suggests that momentum is steadily shifting in favor of the bulls. Based on current technical projections, VIRTUALUSDT is expected to deliver gains in the range of 140% to 150%+, making it one of the standout opportunities in the altcoin market.
Investor sentiment has also been improving as more market participants show interest in this crypto pair. This increasing demand, coupled with technical strength, reinforces the likelihood of sustained upward movement. If the momentum continues, VIRTUALUSDT could witness a sharp breakout, rewarding both short-term traders and long-term investors with impressive returns.
✅ Show your support by hitting the like button and
✅ Leaving a comment below! (What is You opinion about this Coin)
Your feedback and engagement keep me inspired to share more insightful market analysis with you!
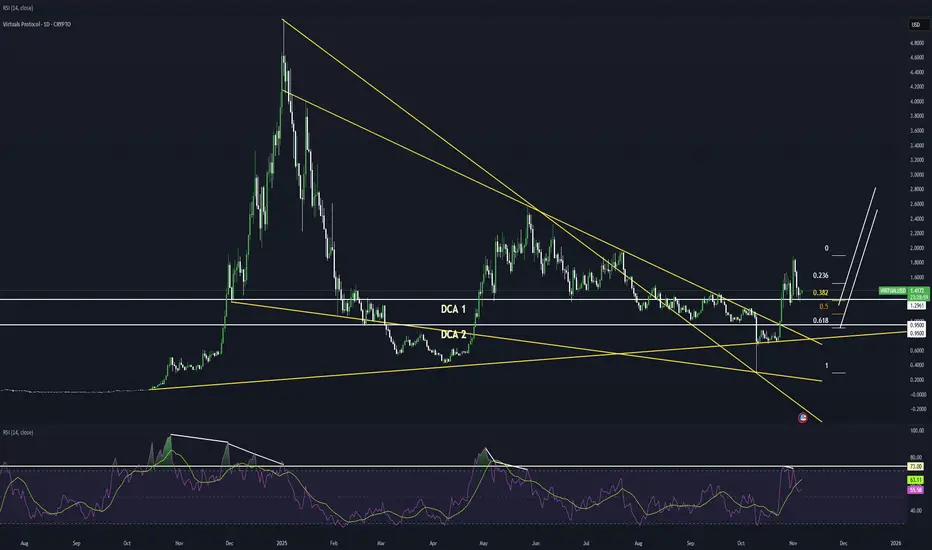
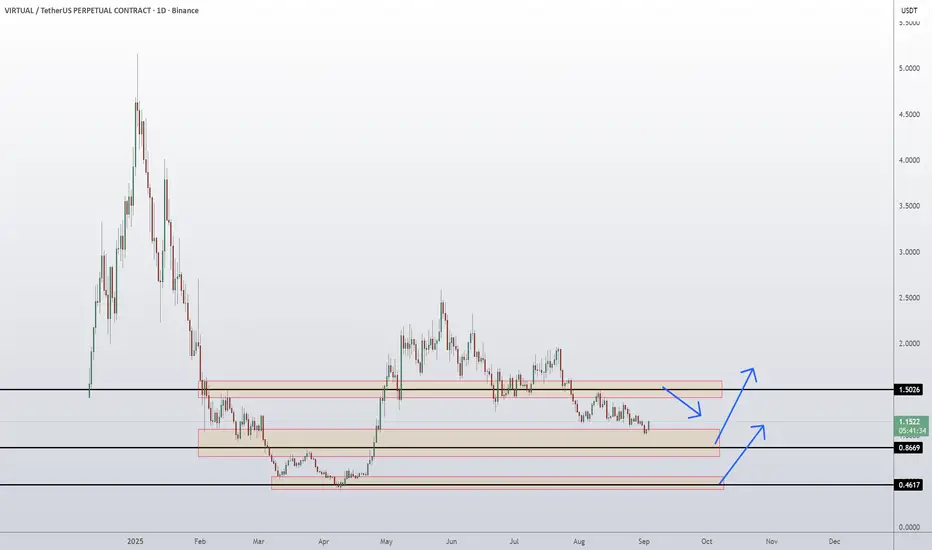
Virtuals Protocol Coin Price Prediction and Technical AnalysisVIRTUAL/USDT has been in a prolonged downtrend but is now consolidating between key support and resistance zones. Price is holding above the 0.8669 support and attempting to stabilize, with the 0.4617 level acting as a deeper safety net if selling pressure extends. On the upside, the immediate challenge lies at the 1.5026 resistance zone, which previously rejected bullish attempts. The structure suggests two scenarios: either a bounce from the current demand region (0.8669–1.00) pushing price back toward 1.5026, or a breakdown below 0.8669, exposing the 0.4617 major support.
📈 Key Levels:
Buy trigger: Rejection bounce from 0.8669 support
Buy zone: 0.86 – 0.90 region
Target: 1.5026 resistance
Invalidation: Daily close below 0.8669 (next demand at 0.4617)
👉 Follow me for More Real Time Opportunities.
Share your Thoughts if you have any?
VIRTUAL Daily Market Update📉 SPARKS:VIRTUAL Daily Market Update
SPARKS:VIRTUAL is currently testing the black support line 🔵
If this level breaks down, price could drop by around 22%, targeting the blue support zone 🟦
⚠️ At this stage, it does not look good to enter long yet.
The safer play would be to wait for:
Possible accumulation at lower levels, or
A confirmed bounce at the blue support zone before considering long entries.
👉 Patience and confirmation are key here — avoid forcing early entries.

VIRTUALUSDT Forming Falling WedgeVIRTUALUSDT is currently forming a falling wedge pattern, which is widely recognized as a bullish reversal setup. After a period of steady decline, the price action is tightening within the wedge, suggesting that selling pressure is fading and buyers are gradually preparing to regain control. A confirmed breakout above the wedge resistance could trigger a strong rally, aligning with the projected 140% to 150% gain potential.
The trading volume adds strength to this setup, as consistent activity during consolidation often signals accumulation by investors rather than distribution. This reflects growing confidence in the project, with market participants positioning themselves ahead of a possible breakout. Such volume behavior often precedes significant upward momentum once the technical breakout is confirmed.
Given the high expected gain and visible market interest, VIRTUALUSDT is looking increasingly attractive for traders who seek breakout opportunities. The falling wedge breakout, combined with solid support zones, provides a clear bullish bias. If momentum builds as anticipated, the pair could deliver sharp upside moves, rewarding patient investors.
✅ Show your support by hitting the like button and
✅ Leaving a comment below! (What is You opinion about this Coin)
Your feedback and engagement keep me inspired to share more insightful market analysis with you!
VIRTUALUSDT Forming Falling WedgeVIRTUALUSDT is currently exhibiting a classic falling wedge pattern, a well-known bullish reversal setup that often precedes a strong upside breakout. This pattern forms when the price action contracts within two downward-sloping trendlines, reflecting temporary selling pressure that tends to weaken over time. As price continues to compress, buyers typically prepare to step in, leading to an eventual breakout with substantial bullish momentum. With volume holding steady, the structure suggests that a significant move may be imminent.
Technically, falling wedges are considered high-probability setups, especially when they appear after extended downtrends or periods of correction. In the case of VIRTUALUSDT, the projected gain is quite remarkable, with an expected rise of 140% to 150% once the breakout is confirmed. Traders should closely monitor for a clean break above the resistance line of the wedge, potentially triggering a wave of fresh buying interest. This breakout could be further accelerated by short covering and momentum-based entries.
The broader market sentiment around the Virtual project is shifting positively, with increasing investor attention and social media buzz adding fuel to its potential move. The fundamentals of the project, along with its growing visibility and speculative interest, are aligning with the bullish technical outlook. As more traders recognize the breakout opportunity forming on the charts, VIRTUALUSDT could attract significant capital inflow, driving a rapid price expansion.
✅ Show your support by hitting the like button and
✅ Leaving a comment below! (What is You opinion about this Coin)
Your feedback and engagement keep me inspired to share more insightful market analysis with you!
#VIRTUAL #VIRTUALUSD #VIRTUALUSDT #Analysis #Eddy#VIRTUAL #VIRTUALUSD #VIRTUALUSDT #Analysis #Eddy
A reversal structure has formed on the weekly and daily time frames, and the necessary confirmations have been given on the weekly time frame. Considering the structure formed on the above time frame, as well as the behavior of this currency in the past chart, it is expected that this currency will perform a good pump.
I have identified the important supply and demand zones of the higher timeframe for you.
This analysis is based on a combination of different styles, including the volume style with the ict style.
Based on your strategy and style, get the necessary confirmations for this analysis to enter the trade.
Don't forget about risk and capital management.
The responsibility for the transaction is yours and I have no responsibility for your failure to comply with your risk and capital management.
💬 Note: The red order block cannot stop the growth of the price of this currency and by 4.20 cents this currency will be pumped more than 200%.
Be successful and profitable.
