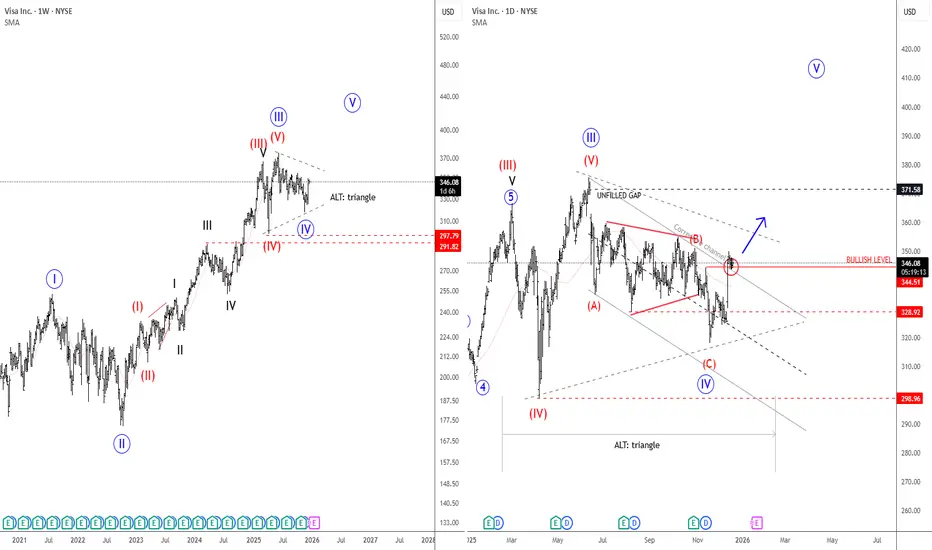
Visa: Completing Correction, Upside Potential AheadVisa Inc. is a global payments technology company that operates one of the world’s largest electronic payment networks. It enables secure electronic transactions between consumers, merchants, and banks in over 200 countries, focusing on fast, reliable, and cashless payments.
Visa has pulled back roughly 15% from its highs and appears to be completing a clear A-B-C corrective decline. Moves out of triangle formations are often final legs within corrective structures, suggesting a new bullish push could be approaching. This outlook is reinforced by the unfilled gap near 371, which historically tends to act as a price magnet over time. As a result, a reversal to the upside over the coming weeks or months would not be surprising. A breakout above the corrective channel would serve as a key confirmation for trend resumption.
Highlights:
Visa appears to be completing an A-B-C decline
Channel break signals potential upside continuation
Unfilled gap at 371 remains a key upside target for 2026
Bullish confirmation above 344.50
Support levels at 311 and 298 on deeper pullbacks
Visa
Circle: The Next-Generation USD-Based Payment NetworkThe past 17-year stock price CAGR of Visa and Mastercard (22.6% and 25.4%, respectively) is the result of payment volume growth (around 8–10% annually) translating into revenue and profit growth, amplified by share buybacks that increase per-share value. The fact that their stock prices have risen far more than USD M2 growth (6.1%) also reflects network effects and margin expansion.
In Circle's case, more than 95% of current revenue comes from USDC reserve interest income (from short-term Treasuries). If USDC supply grows at a 12% CAGR:
Reserve income will increase roughly in line with the supply growth rate.
While a 12% growth in USDC supply serves as the revenue base, Circle is less transaction-fee-centric than Visa/Mastercard and has higher dependence on interest income, so a certain discount should be applied.
The actual growth rate could be even higher than what was calculated based on this foundation. This was estimated conservatively.
In conclusion, since growth is based on the increase in currency issuance, the growth trends will be similar.

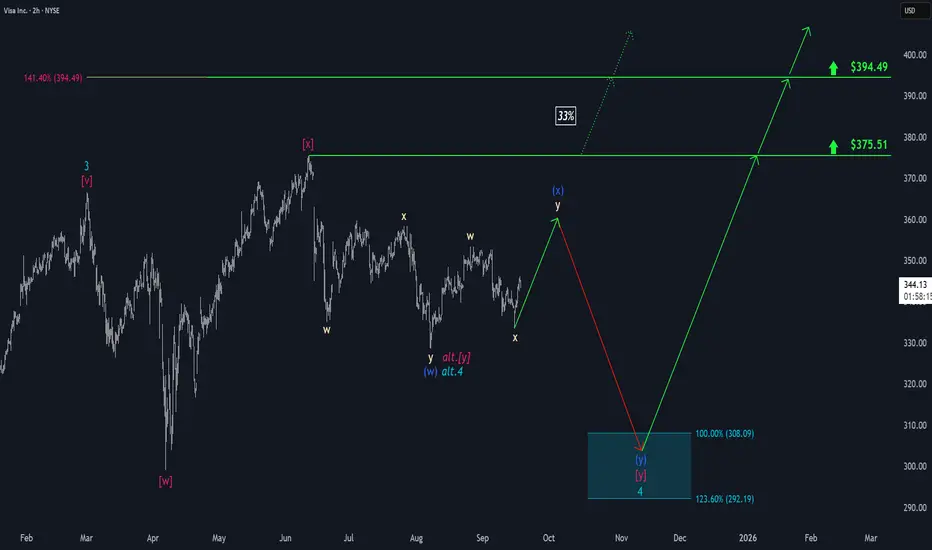
Visa: More Upside PotentialVisa’s blue wave (x) still has significant upside potential before reaching its peak. With price still trading below our resistance level at $375.51, we expect the subsequent wave (y) to take over and guide the stock into our green Long Target Zone between $292.19 and $266.47. Within this range, we anticipate the completion of the larger turquoise wave 4 before any sustainable gains can take hold. Alternatively, it’s possible that the turquoise wave alt.4 has already concluded. In this scenario, the stock would move directly toward the $375.51 resistance—and potentially break through both this level and the $394.49 mark (probability: 33%).

Visa and Aquanow Partnership Accelerates Stablecoin PaymentsVisa continues advancing its blockchain strategy with a new partnership with Aquanow to speed up stablecoin settlements across global markets. The collaboration aims to enhance cross-border speed, lower transaction costs, and increase transparency across Central and Eastern Europe, the Middle East, and Africa. This marks another major step in Visa’s broader push to modernize digital payments using blockchain rails.
Through this agreement, Visa integrates Aquanow’s digital asset infrastructure—technology capable of handling continuous, high-volume crypto transactions—directly into its global payment network. As a result, financial institutions in the CEMEA region can now settle transactions using approved stablecoins like USDC. The move strengthens Visa’s long-term plan to build faster, more resilient settlement systems for regions heavily affected by delays and banking inefficiencies.
Visa is also focused on reducing intermediaries in the settlement chain, improving real-time transparency, and providing institutions with 24/7/365 settlement access. With Aquanow’s support, issuers and acquirers can clear obligations using stablecoins rather than relying solely on traditional clearing processes. This development aligns with Visa’s strategy to scale digital money movement, especially in emerging markets where currency volatility and slow clearing systems remain major obstacles.
Aquanow, founded in 2018, brings strong liquidity technology and deep expertise in digital asset rails. Its infrastructure processes billions in crypto brokerage and settlement flows monthly. This strengthens Visa’s stablecoin pilot programs, which already surpass a $2.5 billion annualized volume. Visa’s CEMEA division continues upgrading its backend systems to support real-time blockchain settlements.
Technical Outlook
Visa’s stock maintains a bullish structure, respecting an ascending trendline around $320, which was retested last week. Immediate resistance rests at $375, the previous major high. A breakout above this zone could extend momentum. Key supports sit at $320 and $305 if price retraces.

VISA flashed a huge Sell SignalVisa Inc. (V) has been trading within a 7-year Channel Up and two weeks ago closed below its 1W MA50 (blue trend-line). Given that this took place after a June Higher High, we can claim that this break-out has confirmed the new Bear Cycle/ Leg of the pattern.
Observe the incredible symmetry of the 1W MACD, which on the current level (-0.0058), it was when the November 01 2021 and March 09 2020 breaks below the 1W MA50 occurred. They both eventually crashed to the bottom (Higher Lows trend-line) of the Channel Up.
As a result, we officially turn bearish on this stock and based on the previous Bearish Leg that broke below its 1W MA200 (orange trend-line) and hit the 0.5 Fibonacci retracement level before rebounding into the new Bullish Leg, we expect to see the price drop to $265.00 before forming a bottom. That would be a potential contact with the 1W MA300 (red trend-line) as well.
---
** Please LIKE 👍, FOLLOW ✅, SHARE 🙌 and COMMENT ✍ if you enjoy this idea! Also share your ideas and charts in the comments section below! This is best way to keep it relevant, support us, keep the content here free and allow the idea to reach as many people as possible. **
---
💸💸💸💸💸💸
👇 👇 👇 👇 👇 👇

$V Seismic shift is taking place.- $V & NYSE:MA will soon get toasted when their fees would compress which they charge for processing transaction.
- NYSE:XYZ has already started bitcoin based transaction which cost a seller no transaction fees. You might think this is contained but soon NYSE:TOST , NYSE:FI , NASDAQ:SHOP all the payment processor will start accepting Bitcoin as mode of payment and will offer lower transaction fees and initially zero transaction fees for mass adoption.
- Even if $V & NYSE:MA adopt to this trend their margins will get hurt and there would be pressure on transaction fees nonetheless.

Visa stock analysisVisa stock is showing signs of weakness as price approaches a possible death cross.
the uptrend line that has supported the advance for months. The structure suggests this trendline may be vulnerable to a break, which would mark a potential shift in momentum.
Based on the structure, I think Visa could head toward the 308 USD area, where the next meaningful support lies.
🎯 Conclusion: My view is bearish — with a potential death cross forming and the uptrend line at risk, I expect Visa to trend lower toward 308 USD.

VISA BACK TO 370 BY 2026 Why Visa (V) Could Hit $370 by 2026: Payments Powerhouse Bull Case Visa’s trading at ~$344 today (Sep 23, 2025), up 15% YTD on digital payments surge, but with EPS climbing 12%+ and global transaction volumes booming, $370 (8% upside) by EOY 2026 is a low-bar target for this steady climber. Here’s the roadmap:Revenue & Payments Growth: Q3 '25 cross-border volume +16% YoY, driving $39B TTM revenue (11% growth). Analysts project 9.4% YoY to $43B+ in FY26 on e-comm (25% of sales) and emerging markets expansion, per Simply Wall St—fueling $370 at 25x forward sales.
2 sources
EPS Acceleration: Consensus EPS hits $10.50 in FY26 (up 12% from $9.37 '25), trading at 28x forward P/E—below historical 32x avg. At norm multiple, that's $336 base; add 11.2% earnings growth for $370 pop, aligning with LiteFinance's $370–$380 range.
2 sources
Innovation Tailwinds: Visa Direct + fintech ties (e.g., Ample Earth climate collab) boost B2B volumes 20%+, hedging crypto/reg risks. Tokenization and AI fraud tech scale margins to 67%+, per management.
Analyst Consensus Backs It: 27–51 firms avg $380–$396 PT (Strong Buy, high $430), with StockScan eyeing $351 avg '26 (high $390). Lows at $305, but bulls dominate on 10%+ CAGR.

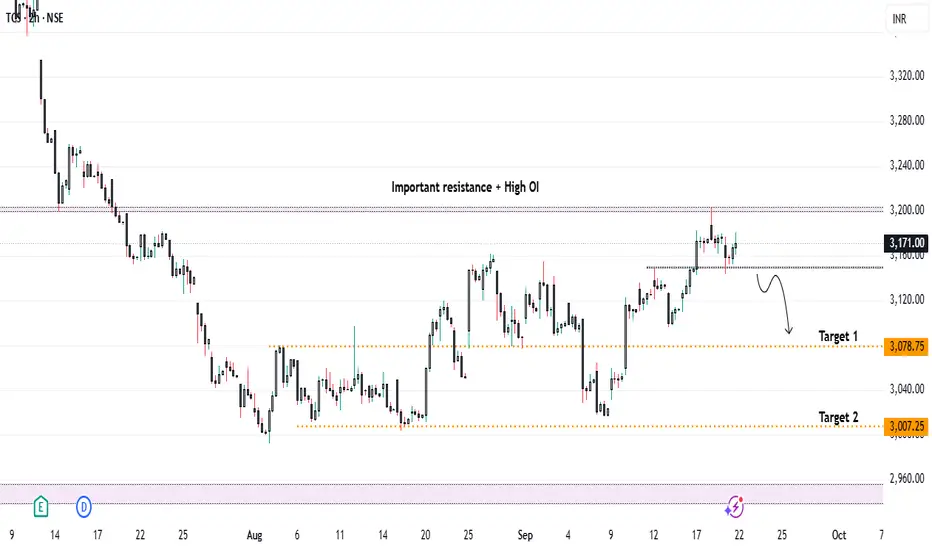
TCS Under Pressure – Will Visa Heat Trigger ₹3000 Levels..?Currently, TCS is trading near the crucial resistance zone of ₹3200, which also carries high open interest. From a technical perspective, if the stock breaks and closes below the short-term support of ₹3150, we can look for a short entry on retest, with targets:
* 🎯 Target 1: ₹3080
* 🎯 Target 2: ₹3000
📰 Fundamental / News Catalyst
The recent US H-1B visa policy update imposing a $100,000 fee on new petitions triggered a knee-jerk reaction in IT stocks:
* U.S.-listed Indian IT firms saw an immediate 2-5% decline.
* Analysts expect the impact on TCS to be limited, since a large part of its U.S. workforce is locally hired and renewals/existing visas are exempt.
* Worst-case estimates suggest a 3-5% downside in the short term, but not a structural collapse for large, diversified players like TCS.
📊 Impact Outlook on TCS
Short Term (days–weeks):
* Investor sentiment may turn negative, causing selling pressure.
* Margin compression possible due to new visa costs.
* Analysts could revise earnings growth expectations lower.
* Offsetting factors: Renewals exempt, TCS has a solid U.S. local workforce, and offshore flexibility.
Medium Term (months):
* New contracts may factor in higher costs.
* Shift to offshore delivery could reduce higher-margin onsite revenues.
* More local U.S. hiring may raise costs.
* Offsetting factors: TCS’s scale allows cost absorption; some costs may be passed to clients.
Long Term (year+):
* Delivery model may shift further to offshore/local U.S. hiring.
* Competitive pressure if peers adapt faster in the U.S. market.
* Margins could be under pressure.
*Offsetting factors: Strong global brand, diversified business, investments in AI & automation can offset long-term risks.
🔎 Scenarios for Share Price
* Mild Reaction: 3-5% decline → cautious investors, limited disruption.
* Moderate Reaction: 8-12% decline → project delays, client pushback, stricter visa rules.
* Severe Reaction: 15-20%+ decline → contract losses, earnings downgrades, tighter U.S. policy.
✅ Conclusion
* 📌 Technicals: Watch ₹3150 for breakdown confirmation; short entries possible below this with ₹3080 / ₹3000 as downside targets.
* 📌 Fundamentals: News-driven weakness is likely, but structural risk to TCS remains limited vs smaller IT peers.
* 📌 Strategy: Short-term bearish setup aligns with both technical chart structure and negative sentiment from visa policy changes.
📌 Sentiment: Bearish (Short Term)
Visa: Corrective Upward MoveIn our primary scenario, we place Visa in the corrective upward move of blue wave (x). After the top, we expect the broader downward trend of turquoise wave 4 to take hold, which should push the stock into our turquoise Target Zone between $308.09 and $292.19. At that level, we anticipate a sustained reversal. From this low, a new upward impulse is likely: wave 5 should then have enough strength to lift price above the resistance levels at $375.51 and $394.49. However, an alternative scenario remains relevant: there is a 33% probability that the correction of wave alt.4 has already concluded. If so, the stock could immediately break above the resistance levels mentioned.
Visa Stock Shows Strong Daily Rebound Amid Diverging MarketThe VISA stock chart is currently demonstrating a promising rebound on the daily timeframe, indicating a potential shift in market sentiment. This upward movement is primarily fueled by demand zones where institutional traders and larger market participants—often classified as non-commercials—are actively pushing prices higher. Their buying activity suggests confidence in VISA’s future prospects and could be a strong indicator of continued upward momentum.
Conversely, retail investors seem to be retreating or selling off, which is creating a contrasting pressure on the stock. Despite retail traders' bearish stance, the overall chart pattern and the demand levels suggest that the stock might be poised for further gains. This divergence between institutional and retail trading behaviors often signals an opportunity for savvy investors to consider a long position, especially if the demand continues to hold.
It's important to monitor key support levels and volume indicators to confirm the strength of this rebound. If the demand sustains and the stock maintains its upward trajectory, it could be a strategic entry point for those looking to capitalize on a potential bullish move in VISA.
What are your thoughts on this analysis? Do you see further upside, or are there cautionary signs to consider? Share your perspective in the comments below—I'd love to hear your insights!
✅ Please share your thoughts about VISA in the comments section below and HIT LIKE if you appreciate my analysis. Don't forget to FOLLOW ME; you will help us a lot with this small contribution.

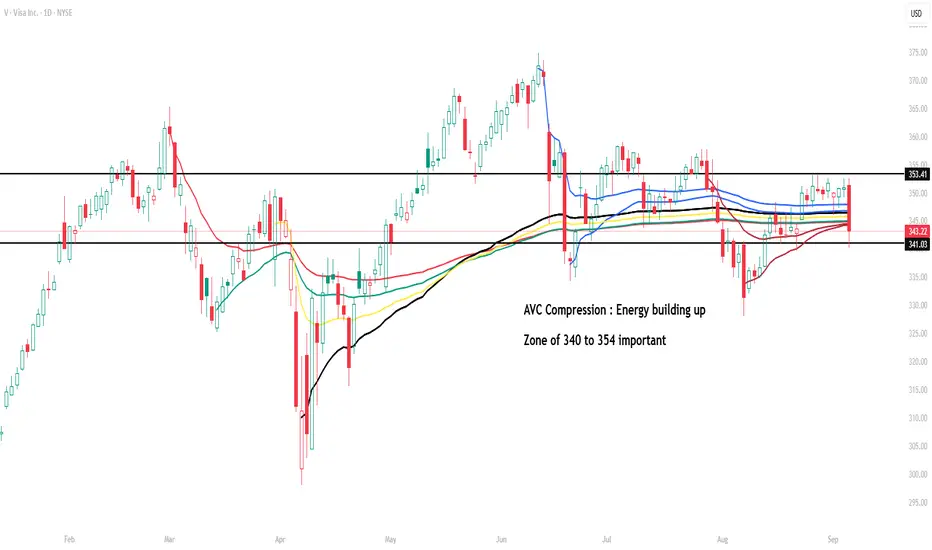
Visa (V) – AVC Compression Around Key Zone 340–354Visa is trading in a compressed zone with multiple Anchored VWAP converging, creating what I call an AVC (Anchored Volume Compression) setup.
This indicates energy is building up, and a decisive move outside the 340–354 range could set the next directional leg.
Support: 340
Resistance: 353–354
Watch for a breakout or breakdown from this congestion area to gauge momentum.
VISA on a strong Bullish Leg targeting $440.Visa Inc. (V) has been trading within a Channel Up pattern since the October 10 2022 market bottom. After December 2022, every test of the 1W MA50 (blue trend-line) has been the most optimal long-term buy opportunity, being also a Higher Low (bottom) of the pattern.
Every Bullish Leg has been +5% stronger than the previous, which leads us to believe that the current Bullish Leg will peak at around +49.50% (+5% from +44.60%). This translates to $440 Target towards the end of the year.
-------------------------------------------------------------------------------
** Please LIKE 👍, FOLLOW ✅, SHARE 🙌 and COMMENT ✍ if you enjoy this idea! Also share your ideas and charts in the comments section below! This is best way to keep it relevant, support us, keep the content here free and allow the idea to reach as many people as possible. **
-------------------------------------------------------------------------------
💸💸💸💸💸💸
👇 👇 👇 👇 👇 👇

Mastercard and Visa Shares Decline Due to Stablecoin BillMastercard (MA) and Visa (V) Shares Decline Due to Stablecoin Bill
Yesterday, we reported that the US Senate had passed the GENIUS stablecoin bill, which establishes a legal framework for regulating the stablecoin market. This development led to a sharp rise in the share price of cryptocurrency exchange Coinbase (COIN), while simultaneously putting pressure on Mastercard (MA) and Visa (V) shares.
According to media reports, market participants are concerned that stablecoins could pose serious competition to these companies, which earn revenue primarily from transaction fees. This serves as an example of how blockchain technology, with its low-cost features and high speed, could disrupt leaders in the traditional finance sector.
Technical Analysis of Mastercard (MA) Stock Chart
In May, MA shares formed an upward trend (shown in blue), but this was already broken by a strong downward move, accompanied by a wide bearish gap in the $575–$585 range.
Near the lower boundary of the channel, a contracting triangle pattern (shown in black) can be observed – this can be interpreted as a temporary balance between buyers and sellers. However, it didn’t last long: the widening spread of bearish candles (1 and 2) indicates growing selling pressure.
It’s possible that following a drop of over 9% from the June high, Mastercard (MA) shares might attract buyers betting on a short-term rebound. Nevertheless, in the longer term, developments related to the GENIUS bill could contribute to a continued downward trend.
This article represents the opinion of the Companies operating under the FXOpen brand only. It is not to be construed as an offer, solicitation, or recommendation with respect to products and services provided by the Companies operating under the FXOpen brand, nor is it to be considered financial advice.

Visa: Resistance ApproachingThe next key step for Visa should be overcoming resistance at $394.49 during magenta wave . However, if support at $339.61 fails to hold, our alternative scenario (33% probability) will be activated—suggesting the recent high already marked the end of the corrective wave alt. in magenta. In that case, a renewed decline below the $299 mark would be likely, aiming to complete the alternative turquoise wave alt.4 on a larger scale.
📈 Over 190 precise analyses, clear entry points, and defined Target Zones - that's what we do.

VISA - A Pump & Dump? Help me understand please.To places where no stock price has ever gone before..
What makes VISA so special?
The credit industry is currently staring into the abyss due to massively rising payment defaults.
Why is VISA skyrocketing in price, breaking through every barrier as if they were made of butter?
I don't know, and I'm very puzzled.
What will happen if economic conditions become even more difficult and the madness we're currently experiencing fully hits, and hardly anyone can service their consumer debt anymore?
I think at that point, VISA will look like a
Pump & Dump too like many others.
I'd appreciate any info on why VISA is rising so much.

VISA cup and handleCup and handle patterns are all over the place right now. Visa is another name that is showing this pattern forming on the daily chart. A strong move in financial names could push this over 369.15 towards new highs.

"King of Cards" How Does Visa Make Money?NYSE:V
To be honest, VISA stock is the kind of investment that really feels solid and reliable. I bought a bit of VISA a few years ago, and before I knew it, the price had climbed past $300 and I started getting those occasional dividend notifications. The dividends aren’t huge, but it’s nice to see that money coming in automatically. I can see why so many dividend investors like VISA.
VISA is, of course, the same “VISA” you see on your credit cards. Globally, they dominate the credit card market, with nearly half of the market share, and they’re among the top 10 biggest companies in the US by market cap.
These days, cashless payments have become the norm, and that trend really works in VISA’s favor. Most analysts expect VISA to keep growing steadily, with annual revenue and profit increases of around 10%. VISA has also raised its dividend every year for over 16 years, making it a classic “dividend growth” stock. The yield itself is under 1%, but the key is that the dividend keeps getting bigger.
Recently, VISA’s been expanding into new businesses too-like Visa Direct for money transfers-so they’re evolving from just a credit card company into a global payments platform. Maybe that’s why even Warren Buffett has invested in VISA.
Of course, there are risks. There’s always talk of antitrust regulation, and new fintech companies like PayPal are trying to take market share. In fact, VISA’s stock has underperformed the market a bit in the last few years. But VISA’s economic moat (the barriers that keep competitors out) is still very strong.
Looking at the current price, VISA’s P/E ratio is actually a bit lower than its five-year average, so some people think it’s undervalued right now. That’s why I think VISA is a stock you can hold in your portfolio for the long term and feel pretty comfortable about.
- VISA is the clear leader in global payments, and as we move toward a cashless society, its growth prospects look strong.
- The dividend is small but growing every year, and the stock price has trended upward over the long term.
- There are risks like regulation and fintech competition, but most still see VISA as a solid investment.
Maybe you like this Video deal with VISA
below comment!

VISA:Respecting the 61.8% Fibonacci Level and Going for New HighWho doesn't know VISA? Almost everyone has or has had a VISA card. VISA stock has an unbeatable bullish outlook, which, like all stocks on the stock market, has retraced its rise.
---> What is its current situation?
If we look at the chart, its appearance is CLEARLY BULLISH (Bull), having gone through a retracement phase. The retracement it has made is EXACTLY THE 61.8% Fibonacci, AND IT HAS RESPECTED IT. Since reaching that retracement on March 14, the price has not stopped rising. It is currently BREAKING KEY ZONES to initiate an attack on NEW HIGHS IN VALUE. If it surpasses the 352 zone, it will go directly to the highs, and will most likely break them to explore new prices for the stock.
--------------------------------------
Strategy to follow:
ENTRY: We will open two long positions if the H4 candle closes above 352.
POSITION 1 (TP1): We close the first position in the 366 zone (+4%) (highs zone).
--> Stop Loss at 336 (-4.2%).
POSITION 2 (TP2): We open a Trailing Stop position.
--> Initial trailing stop loss at (-4.2%) (coinciding with the 336 level of position 1).
--> We modify the trailing stop loss to (-1%) when the price reaches TP1 (366).
-------------------------------------------
SET UP EXPLANATIONS
*** How do I know which two long positions to open? Let's take an example: If we want to invest €2,000 in the stock, we divide that amount by 2, and instead of opening one position of €2,000, we'll open two positions of €1,000 each.
*** What is a Trailing Stop? A Trailing Stop allows a trade to continue gaining value when the market price moves in a favorable direction, but it automatically closes the trade if the market price suddenly moves in an unfavorable direction by a specified distance. This specified distance is the trailing Stop Loss.
--> Example: If the trailing Stop Loss is at -1%, it means that if the price drops by -1%, the position will be closed. If the price rises, the Stop Loss also rises to maintain that -1% during increases. Therefore, the risk decreases until the position enters a profit. This way, you can take advantage of very strong and stable price trends, maximizing profits.

VISA: One of the steadiest 2025 stock picks.Visa remains bullish on 1W and is about to do so on its 1D technical outlook as well (RSI = 54.200, MACD = 1.140, ADX = 29.207). The 1W Channel Up is what keeps the long term trend bullish and 1D is just recovering from neutral grounds the correction of March's first 2 weeks. This is nothing new for the stock as it had the same -9% correction in September 2023 after a symmetric +43.28% bullish wave. After this correction, the index extended the rally to the 1.382 Fibonacci extension before the stronger correction.
You can see that the 1W RSI pattern now is identical to then. Consequently, we again expect a technical rebound to the 1.382 Fib extension either at or over the 2 year Channel Up (TP = 419.00) by the end of the year.
See how our prior idea has worked out:
## If you like our free content follow our profile to get more daily ideas. ##
## Comments and likes are greatly appreciated. ##

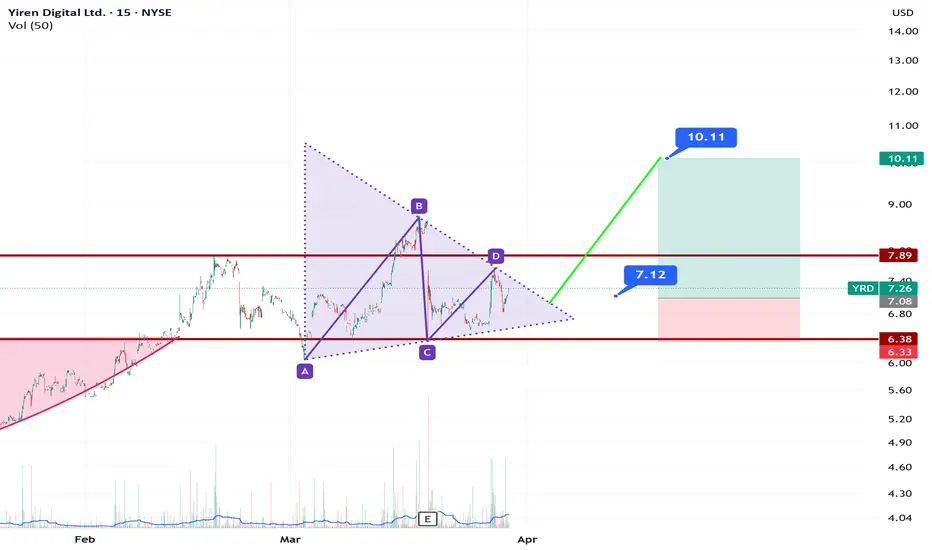
YRD Triangle PatternYRD has good financials in Credit Services. There are NYSE:V , NYSE:MA , NYSE:AXP , NASDAQ:PYPL like companies in Credit Services Industry. The Industry's average PE ratio is 25. YRD's current PE ratio is around 3,41 for latest quarter. It also has triangle pattern.
Visa: Bottom Already Established?Visa might have already reached the low of the magenta wave ; however, for now, we allow slightly more room for the downside. Nonetheless, once this interim correction has concluded, the price should proceed higher during the magenta wave and surpass the resistance at $366.34. We currently consider it 34% likely that the stock will break above this level to form a fresh high with the magenta wave alt. . But primarily, we view the regular wave as already complete.

The global market is rebootingOn February 18, negotiations between the United States and Russia are scheduled to take place in Saudi Arabia. These talks could pave the way for restoring economic relations and addressing global challenges.
“American companies lost over $300 billion by exiting the Russian market,” said Kirill Dmitriev, head of RFPI, on the eve of talks with the U.S. delegation in Saudi Arabia. He emphasized the importance of economic dialogue, noting that the Russian market remains attractive to investors.
It is now known that several major American companies intend to return to Russia. Amid a potential thaw in U.S.-Russia relations, Visa (#Visa), Mastercard (#MasterCard), Apple (#Apple), PepsiCo (#PepsiCo) and McDonald's (#McDonald) have all announced their intentions in recent days.
The U.S. stock market remains resilient thanks to domestic growth drivers. Additionally, several key factors are expected to drive growth in the near future:
Federal reserve monetary policy: A possible rate cut or maintaining low interest rates is spurring investments. This, in turn, boosts company valuations and pushes up indices such as the Dow Jones (#DJI30) and S&P 500 (#SP500).
Technology sector: Ongoing advancements in AI, cloud services, and biotechnology are attracting capital. Moreover, integrating artificial intelligence into large businesses helps reduce costs by automating routine processes, while AI algorithms enhance strategic planning and risk management.
Corporate earnings growth: Increasing corporate profits are one of the key factors supporting the positive momentum in the stock market, including the S&P 500 (#SP500), which reflects the performance of the 500 largest U.S. companies. Strong quarterly reports from these companies play a crucial role in reinforcing investor confidence and ensuring market stability.
Geopolitical expectations: Tensions among major global players like the U.S., EU, and Russia could lead to sanctions, trade wars, and economic restrictions, which negatively impact the global economy and stock markets. A thaw in relations could reduce the likelihood of such conflicts and, consequently, lower the risks associated with sanctions and instability.
FreshForex analysts are confident that as geopolitical tensions ease, companies will start to return, which will undoubtedly drive up their stock prices. Don’t miss this chance – invest in stocks with us!
Our terminal offers 270 trading instruments, including CFDs on corporate stocks and indices. Trade with a favorable leverage of 1:1000 and enjoy attractive bonuses!
