Ethereum Price Prediction: Samsung Staking and BitMine Treasury In October 2025, Ethereum (ETH) is poised for significant growth, driven by major catalysts like Samsung’s integration of ETH staking in Galaxy devices and BitMine Immersion’s massive treasury holdings. With ETH trading at $4,500 after a 23% rally, these developments signal strong demand, potentially pushing prices to $10,000 by year-end. Samsung’s partnership enables staking for over 200 million users, while BitMine’s 2.83 million ETH ($13.4 billion) underscores institutional confidence. This analysis explores these drivers, price predictions, and trading strategies for investors. Data as of October 7, 2025—position for ETH’s next surge.
Samsung Staking: Empowering 200M+ Users
Samsung’s integration with a major crypto platform allows Galaxy device owners in the US to stake ETH directly via a mobile wallet, offering zero trading fees and 5–7% APY. Targeting 200 million+ users, this feature simplifies staking, boosting retail adoption. Early data shows 75 million users gaining crypto access, with projected Q4 staking inflows of $500 million. This democratizes ETH participation, enhancing network security as the staking queue grows to 475,000 validators. The surge in retail staking could lift ETH prices by 10–15%, correlating 0.7 with Galaxy device sales.
BitMine Treasury: $13.4B ETH Holdings
BitMine Immersion Technologies holds 2.83 million ETH ($13.4 billion), the second-largest crypto treasury, with a recent $821 million purchase. Controlling 5% of ETH’s supply, BitMine’s strategy leverages immersion cooling for efficient mining and staking, signaling strong belief in Ethereum’s upgrades like Pectra. This reduces liquid supply, amplifying price sensitivity. Corporate treasuries, alongside $75.2 million net ETF inflows in September, support ETH’s price floor during corrections, with on-chain data showing a 15% increase in whale holdings.
Price Prediction for 2025: $4,685–$10,000
Analysts project ETH ranging from $4,685–$4,900 by mid-October, with bullish targets up to $10,000 on staking and treasury demand. Samsung’s 200M user base and BitMine’s holdings could drive a cup-and-handle breakout to $7,500. Futures open interest hit $61 billion, signaling momentum. Risks include regulatory delays or unstaking pressure (475,000 validators), potentially capping gains at $5,000. A 40% upside to $7,500 by Q4 is likely if adoption persists, with a 0.8 correlation to Nasdaq.
Trading Signals: RSI and MACD
Analysis uses RSI for momentum and MACD for trends, based on April 2025 uptrends:
ETH ($4,500): RSI at 58 (bullish above 55). Bullish MACD crossover (+0.15)—target $5,200 (15% upside). Fibonacci support at $4,200, resistance at $4,760. On-chain: Staking inflows +$500M.
LDO (staking proxy, $2.20): RSI at 60. Bullish MACD (+0.12)—target $2.50 (20% upside). Fibonacci support at $2.10, resistance at $2.40.
Overall: RSI 58–60 signals momentum—long at supports for 15–25% Q4 gains. Risks: Unstaking (5–7% dip); hedge with BTC.
How to Profit from ETH Demand
Capitalize on ETH’s catalysts:
Track Signals: Monitor RSI >60 and MACD crossovers for entries (e.g., ETH at $4,200), targeting 10–15% yields.
On-Chain Analysis: Follow staking inflows and treasury holdings via explorers for rally signals.
Portfolio Strategy: Allocate 20–30% to ETH, hedge with USDC at RSI >70 for 20% Q4 returns.
Education: Study staking mechanics and practice trades via demo platforms.
Conclusion: Ride ETH’s Surge
Samsung’s staking and BitMine’s $13.4B treasury fuel ETH’s rally, with $10,000 in sight for 2025. Track signals for breakout gains.
What’s your ETH price target? Comment below!
#EthereumPrice #Staking #CryptoTreasury #MarketTrends #CryptoInvesting
Volatility
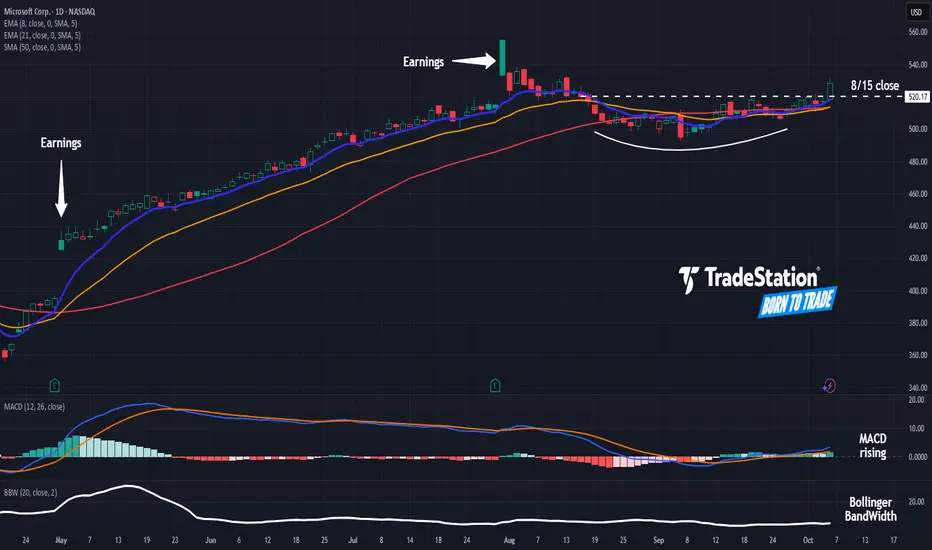
Microsoft May Be Moving AgainMicrosoft has been snoozing since the summer, but some traders may think the tech giant is ready to start moving again.
The first pattern on today’s chart is the pair of bullish gaps following quarterly results, which may reflect positive sentiment.
Second is the August 15 weekly close of $520.17. MSFT slipped under that line in the second half of August and spent all of September below it. Prices crossed the resistance yesterday. That could suggest a breakout has begun.
Third, Bollinger Band Width fell to its narrowest level since April 2024. Are prices set to expand following such compression?
Next, the stock has clawed back above its 50-day simple moving average. The 8-day exponential moving average (EMA) is also above the 21-day EMA and MACD is rising. Those signals may be consistent with bullish direction.
Finally, MSFT is an active underlier in the options market. (Its average daily volume of 296,000 contracts ranks 16th in the S&P 500, according to TradeStation data.) That could help traders take positions with calls and puts.
TradeStation has, for decades, advanced the trading industry, providing access to stocks, options and futures. If you're born to trade, we could be for you. See our Overview for more.
Past performance, whether actual or indicated by historical tests of strategies, is no guarantee of future performance or success. There is a possibility that you may sustain a loss equal to or greater than your entire investment regardless of which asset class you trade (equities, options or futures); therefore, you should not invest or risk money that you cannot afford to lose. Online trading is not suitable for all investors. View the document titled Characteristics and Risks of Standardized Options at www.TradeStation.com . Before trading any asset class, customers must read the relevant risk disclosure statements on www.TradeStation.com . System access and trade placement and execution may be delayed or fail due to market volatility and volume, quote delays, system and software errors, Internet traffic, outages and other factors.
Securities and futures trading is offered to self-directed customers by TradeStation Securities, Inc., a broker-dealer registered with the Securities and Exchange Commission and a futures commission merchant licensed with the Commodity Futures Trading Commission). TradeStation Securities is a member of the Financial Industry Regulatory Authority, the National Futures Association, and a number of exchanges.
Options trading is not suitable for all investors. Your TradeStation Securities’ account application to trade options will be considered and approved or disapproved based on all relevant factors, including your trading experience. See www.TradeStation.com . Visit www.TradeStation.com for full details on the costs and fees associated with options.
Margin trading involves risks, and it is important that you fully understand those risks before trading on margin. The Margin Disclosure Statement outlines many of those risks, including that you can lose more funds than you deposit in your margin account; your brokerage firm can force the sale of securities in your account; your brokerage firm can sell your securities without contacting you; and you are not entitled to an extension of time on a margin call. Review the Margin Disclosure Statement at www.TradeStation.com .
TradeStation Securities, Inc. and TradeStation Technologies, Inc. are each wholly owned subsidiaries of TradeStation Group, Inc., both operating, and providing products and services, under the TradeStation brand and trademark. When applying for, or purchasing, accounts, subscriptions, products and services, it is important that you know which company you will be dealing with. Visit www.TradeStation.com for further important information explaining what this means.
Stop Guessing Risk — Start Measuring It Like a QuantStop deciding risk based on emotion or setup. Do what quants do. Measure volatility and let it define your risk.
Most traders size positions emotionally:
• "This setup looks strong, I’ll double size."
• "I’m not sure, so I’ll go small."
→ Both are inconsistent and lead to unstable performance.
Professionals and systematic traders use a simple principle:
Risk is not a feeling, it’s a function of volatility.
⚙️ The concept
Markets breathe in volatility cycles. When volatility expands, risk should contract.
When volatility contracts, risk can expand.
Your position size should adapt automatically to those cycles.
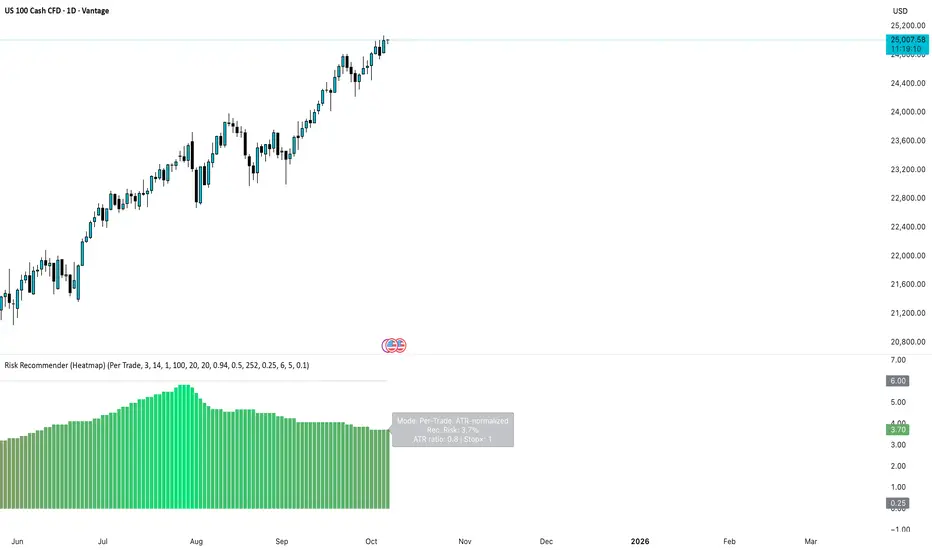
This Idea demonstrates the logic behind the new 📊 Risk Recommender — (Heatmap) indicator, a tool that quantifies how much of your equity to risk at any time.
🧮 How it works
The indicator offers two complementary modes:
1️⃣ Per-Trade (ATR-based)
• Compares current volatility (ATR) to a long-term baseline.
• When market noise increases, it suggests smaller risk per trade.
• When conditions are quiet, it recommends scaling up—within your own floor and ceiling limits.
2️⃣ Annualized (Volatility Targeting)
• Computes realized and forecast volatility (EWMA-style).
• Adjusts your base risk so your overall exposure stays near a target annualized volatility (e.g., 20%).
• The same math used in institutional risk models and CTA frameworks.
🎨 Visual interpretation
The heatmap column acts as a “risk thermometer”:
• 🟥 Red = High volatility → scale down
• 🟩 Green = Low volatility → scale up
• Smoothed and bounded between your chosen floor and ceiling risk levels.
• The label shows current mode, recommended risk %, and volatility context.
💡 Why this matters
Risk should *never* depend on how confident you feel about a trade.
It should depend on how loud or quiet the market is.
Volatility is the market’s volume knob and this indicator helps you tune your exposure to the same frequency.
📈 Example use case
• NASDAQ volatility spikes → recommended risk drops from 3.0% → 1.2%
• SPX volatility compresses → risk rises gradually → 4.5%
You stay consistent while others overreact.
🚀 Automating it
My invite-only strategy applies this logic automatically to manage exposure in real time.
Combine it with the Risk Recommender indicator for full transparency and adaptive position sizing.
🎯 Summary
✅ Stop guessing risk size.
✅ Let volatility guide you.
✅ Keep risk constant, results consistent.
That’s how quants survive. That’s how traders evolve.
#RiskManagement #Volatility #ATR #PositionSizing #Quant #TradingStrategy #AlgorithmicTrading #SystematicTrading #Portfolio #EWMA #RiskControl
BTCUSD – Benefitting from Being AlternativeBTCUSD broke above 120000 for the first time since mid-August on Sunday, briefly recorded a new all-time high of 126304 yesterday before edging back lower and consolidating its gains so far this morning (124100, 0730 BST).
This move to new highs has been relatively constant by recent BTCUSD standards. Prices were languishing at 3-month lows around 10800 on September 26th, but since then it has recorded 10 out of 12 up days, led higher by increased expectations for Federal Reserve interest rate cuts at their next meetings in October and December, alongside a shift by investors into alternative assets to diversify away from major currencies like the US Dollar (USD), UK Pound (GBP), Japanese Yen (JPY) and Euro (EUR) as concerns increase about the sustainability of government debt burdens, fuelled by the spending requirements of those in power.
These issues have been highlighted recently by the US government shutdown, choice of pro spending candidate Sanae Takaichi as Japan’s new prime minister, on-going issues surrounding UK Chancellor Reeves Autumn budget plans and the resignation yesterday of new French Prime Minister Lecornu after only 27 days in office as the country struggles to get its finances in order.
Looking forward, whether BTCUSD prices can sustain a move to higher record levels or instead see a correction back to the downside may be determined by factors such as risk sentiment remaining positive, alongside the ability of the technical outlook to remain constructive, 2 factors that can change quickly in the current environment.
Technical Update: New All Time Highs
Between the September 26th low and the October 6th high, Bitcoin rallied 16.27% in a near-uninterrupted stretch of price strength, culminating in a new all-time high of 126304 on Monday.
As the chart above shows, despite a correction from the latest 126304 high, fresh attempts to extend the advance could remain on the cards. Momentum still appears tilted toward further attempts to move higher.
However, breaks into new all-time high territory don’t guarantee a sustained advance. It’s therefore prudent to monitor key support and resistance levels to help gauge where the next directional risks may emerge. These levels can offer clues on whether momentum is likely to continue or fade.
Possible Resistance Levels:
Sellers have emerged at the 126304 level, and this area now looks set to act as the initial resistance. Traders will likely monitor how price behaves around 126304, particularly on a closing basis, if retested this week.
When price breaks into new all-time high territory, identifying valid resistance becomes challenging. However, Fibonacci extension levels can offer useful reference points.
If Bitcoin sees a closing break above 126304, attention may shift toward 131090, the 38.2% extension of the September 26th to October 2nd rally, even potentially 135145, the higher 61.8% level.
Possible Support Levels:
As already noted, Bitcoin has seen an almost uninterrupted phase of strength since the September 26th low, which may now prompt concerns about price over-extension. Some traders may begin to assess the risk of corrective pullbacks from these elevated levels.
However, for corrective themes to gain traction, it may require a closing break below the recent 121525 low (October 4th), which marked the last rally point for price. While breaks below this support are not an outright negative move, such activity could open the way for tests of 119557, which is the 38.2% Fibonacci retracement of the latest advance, possibly 117471, the deeper 50% level.
The material provided here has not been prepared accordance with legal requirements designed to promote the independence of investment research and as such is considered to be a marketing communication. Whilst it is not subject to any prohibition on dealing ahead of the dissemination of investment research, we will not seek to take any advantage before providing it to our clients.
Pepperstone doesn’t represent that the material provided here is accurate, current or complete, and therefore shouldn’t be relied upon as such. The information, whether from a third party or not, isn’t to be considered as a recommendation; or an offer to buy or sell; or the solicitation of an offer to buy or sell any security, financial product or instrument; or to participate in any particular trading strategy. It does not take into account readers’ financial situation or investment objectives. We advise any readers of this content to seek their own advice. Without the approval of Pepperstone, reproduction or redistribution of this information isn’t permitted.

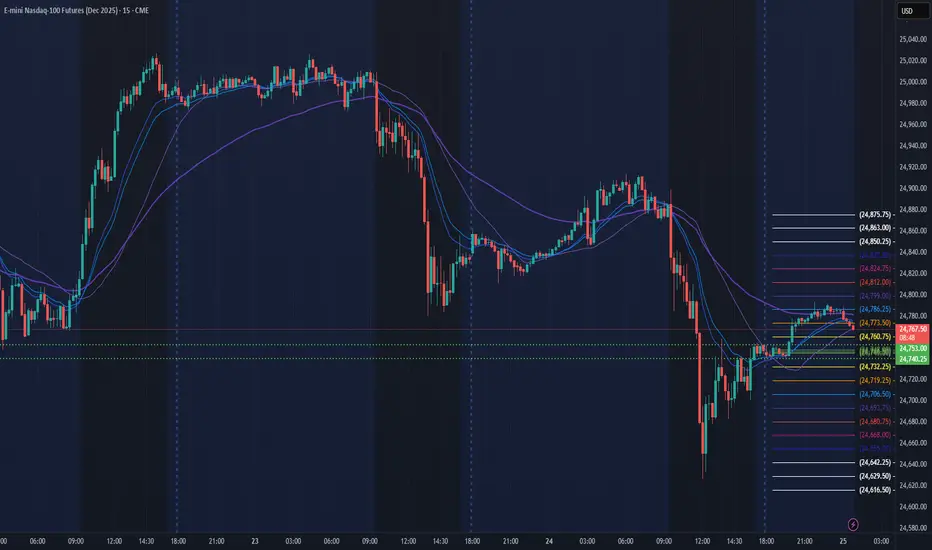
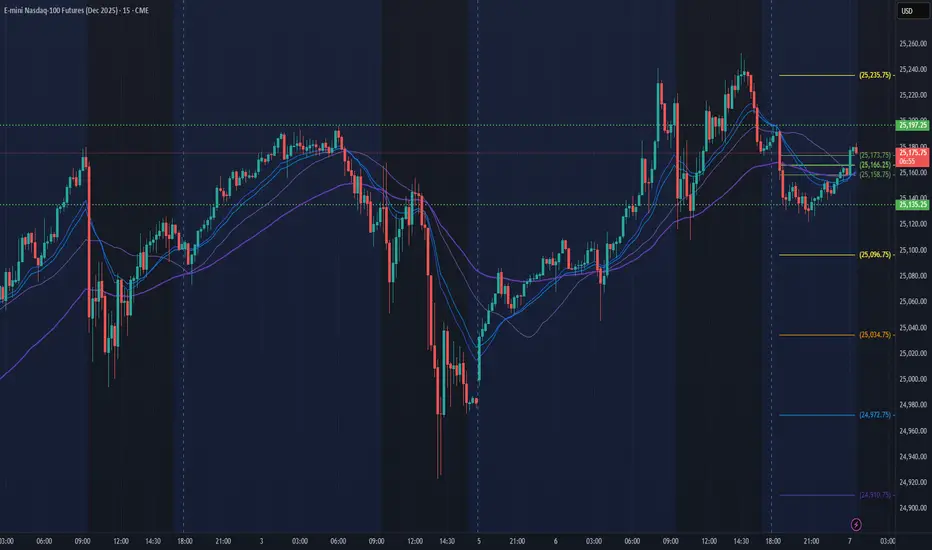
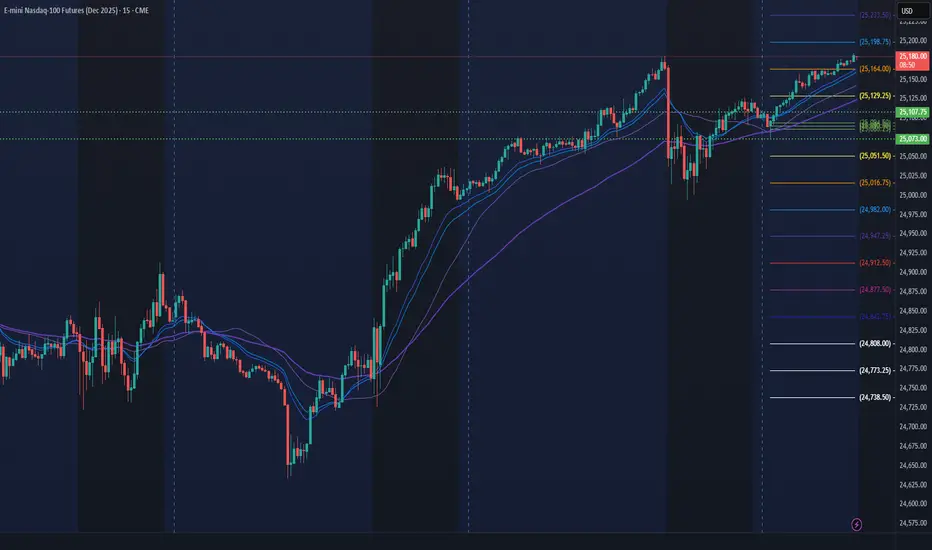
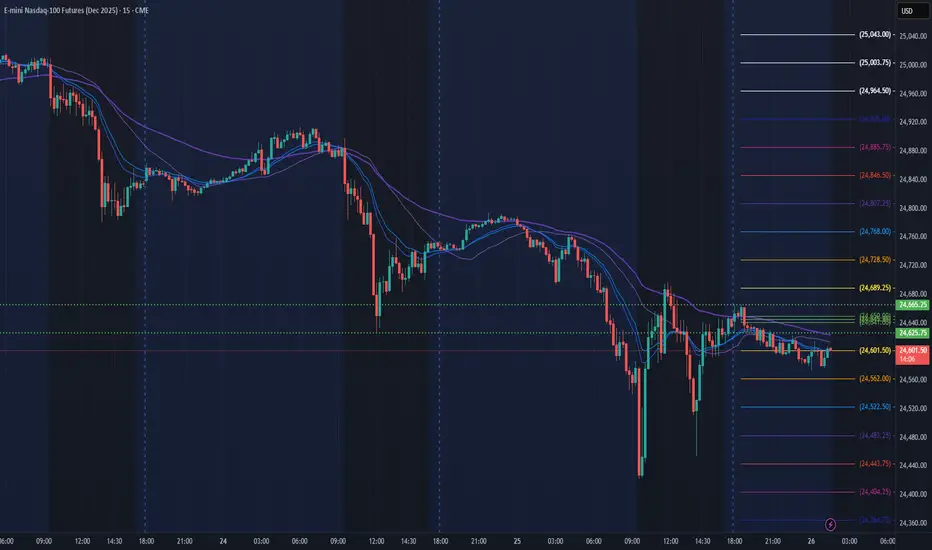
NQ Power Range Report with FIB Ext - 10/7/2025 SessionCME_MINI:NQZ2025
- PR High: 25197.00
- PR Low: 25135.25
- NZ Spread: 138.25
No key scheduled economic events
Session Open Stats (As of 12:25 AM)
- Session Open ATR: 263.48
- Volume: 20K
- Open Int: 288K
- Trend Grade: Long
- From BA ATH: -0.4% (Rounded)
Key Levels (Rounded - Think of these as ranges)
- Long: 25204
- Mid: 23571
- Short: 21939
Keep in mind this is not speculation or a prediction. Only a report of the Power Range with Fib extensions for target hunting. Do your DD! You determine your risk tolerance. You are fully capable of making your own decisions.
BA: Back Adjusted
BuZ/BeZ: Bull Zone / Bear Zone
NZ: Neutral Zone
October 6 - October 10 2025For this week, my bias is neutral/leaning bearish, however I will not fight the trend if my technical indicators give clear bullish signals. I believe the government will stay shut down for a while, as both parties are at an impasse and the administration will use the shutdown as an opportunity to advance its agenda against the federal workforce and non-aligned spending programs, rather than make concessions early on. Unless the opposition is willing to abandon its position with little to no gain, the possibility of this ending soon remains low in my view. Official economic data is currently on hold, so for the time being the stock market is operating with little fundamental basis and as a result, technicals could carry more weight.
1. Macro
Data from the Federal Reserve is currently delayed or on an indefinite hold, making the Real Yield of bonds ambiguous. Regardless, not much has changed since last week. The Dollar is starting out slightly above average but still flat - which should continue since there will be no policy changes or inflation data during the shutdown.
Yields have remained relatively flat but the 10Y yield is rising at a faster pace than the 3M yield, which can be seen on the bottom left chart that shows the spread. I’m not reading into the technicals too much here, however it will be important to see if this makes a higher high (spread widening, 10Y rising and/or 3M falling) or a lower low (spread tightening/inverting). Neither would be a particularly good sign but the former would likely be better received than the latter when it comes to stocks. As with the dollar, I think yields will remain relatively flat for the same reasons, which will prevent bond-market moves from being a driver.
My sentiment on commodities is roughly the same. Gold continues to rally, Oil may be in a downtrend, Copper ripped higher, and Corn stayed flat. Aside from Gold, I do not see anything on the charts of these commodities to provide a clear indication of a change in the growth or inflation outlook.
2. FX
Nothing new and worthy of note here. Yield spreads in the US and Britain (Black, Red) remain tight compared to elsewhere, but the higher yield may be a tailwind keeping the dollar steady. Over the past three months, the dollar has performed sightly better proportionately compared to other currencies, however it is still down significantly on the Year.
3. Risk
The top left chart is the option-adjusted spread of High Yield and Investment Grade corporate bonds indexed to 100. I’m not seeing an upside movement developing here yet (risk-off signal). On the middle chart, S&P Futures continue to significantly underperform Gold, fueled by the Gold rally and S&P making incremental gains. On the top right, I am starting to track the $NQ1!/YM1! spread to see how the mega caps are performing against companies in more traditional industries. Here it is clear that ever since the market bottomed in April, Nasdaq has been significantly outperforming the Dow Jones, however it appears this spread is set to tighten - either by Dow rising while Nasdaq stays flat/falls or Nasdaq falling proportionately more than Dow.
Notice how the Nasdaq/Dow curve started to flatten around the same time that Gold started to significantly outperform the S&P. I think this is an indicator that growth stocks will see pressure in the near future, and that we may currently be seeing rotation into safer sectors . This is evident in the outperformance of Industrials, Financials, Healthcare, and Utilities compared to growth sectors like Tech last week.
4. Options Chain
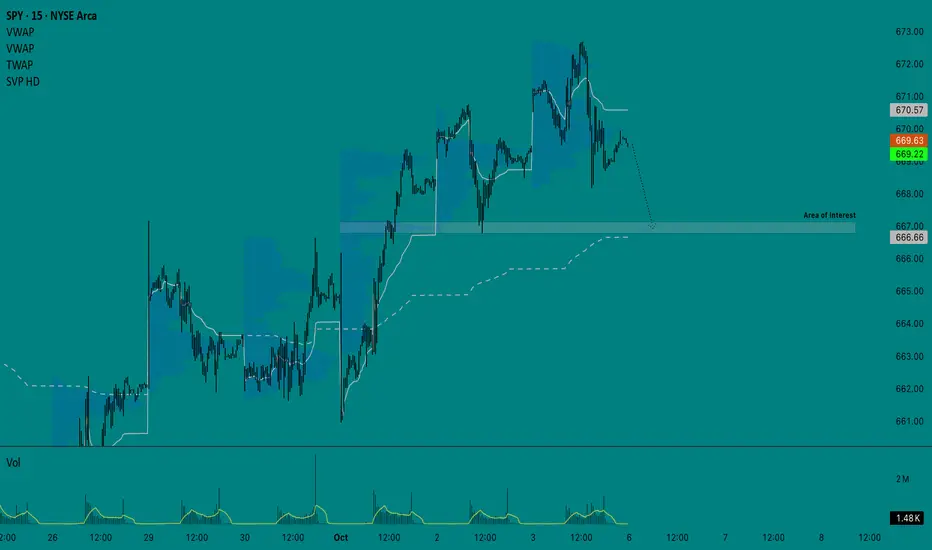
Gamma flip-flopped last week, making options data a misleading indicator unless you’re really in the know. With little fundamental backing, I expect dealers will assert more control than what is typical. Friday ended with most of the calls on volume getting taken out while paying some puts. Heading into this week, gamma on AMEX:SPY should keep the price from rising above $672 or falling below $665 on Monday .
5. Bias
I’m going to split these screenshots up to make it easier to see what I’m looking at.
On my technical indicator chart, last week’s Weekly CVD (black) did not see a strong directional movement, although it remained below the zero line for most of the week, suggesting order flow favored the sell side despite the price reaching new ATHs.
Anchored OBV also suggests that last week was a battle between both sides.
Line break is great as a momentum indicator and has been flipping between both sides since October 1st. CME_MINI:ES1! will need to make a new ATH and break above the resistance and close on the 1h timeframe to print a bullish bar, so right now I think the momentum is more to the downside.
On Renko, which is my main chart, taking a purely technical read using the Wyckoff Method, I think this structure is bullish overall unless we see a swift move to the bottom of the range. Otherwise, it is fairly likely that we will at least see a pull back into the range. VWAP is set to Monthly to show we’re still above but could see a trend shift in the monthly frame of reference by breaking below it. How the price respects this range will be important to watch.
Lastly, when looking at the 4h chart on VIX, it appears to be coiling although it has remained mostly flat. VIX is outperforming its on volatility and the volatility of bonds, suggesting that any spikes are not part of larger risk-off positioning yet.
——————
My overall interpretation for this week is that although the Macro side remains roughly unchanged, I still retain my bias that the market is positioning for disappointing growth and clearly continues to show a preference for gold over stocks (heavy hedging). The absence of data reports due to the shutdown that could have validated these concerns (notably payrolls) have allowed dealers to assert more control over the price. For this reason, I will keep a close eye out for any changes and will adjust if the technicals on my Bias chart support a bullish position, but for now my near-term short target is to move back down to $666 .
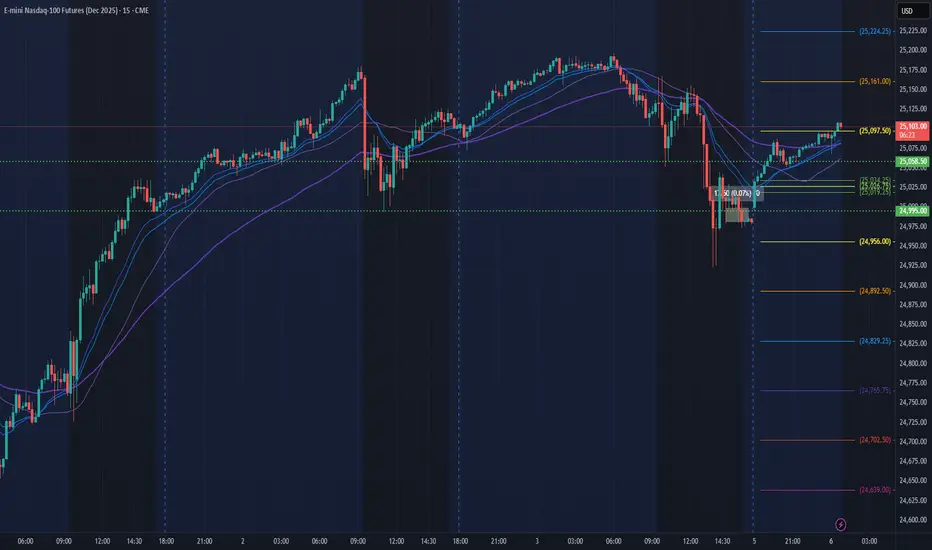
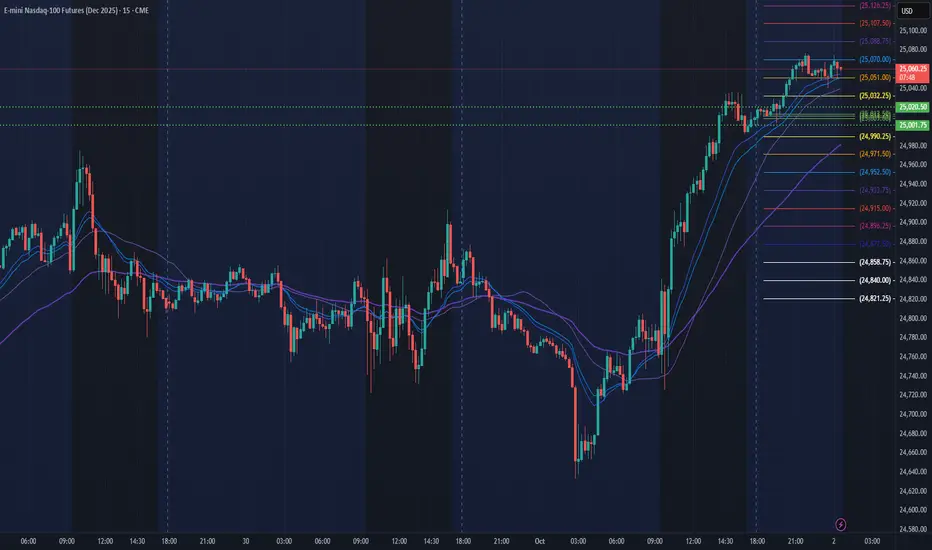
NQ Power Range Report with FIB Ext - 10/6/2025 SessionCME_MINI:NQZ2025
- PR High: 25058.50
- PR Low: 24995.00
- NZ Spread: 142.0
Session Open Stats (As of 12:15 AM)
- Session Open ATR: 267.04
- Volume: 21K
- Open Int: 280K
- Trend Grade: Long
- From BA ATH: -0.3% (Rounded)
No key scheduled economic events
Open weekend gap up: +0.07%
Key Levels (Rounded - Think of these as ranges)
- Long: 25204
- Mid: 23571
- Short: 21939
Keep in mind this is not speculation or a prediction. Only a report of the Power Range with Fib extensions for target hunting. Do your DD! You determine your risk tolerance. You are fully capable of making your own decisions.
BA: Back Adjusted
BuZ/BeZ: Bull Zone / Bear Zone
NZ: Neutral Zone
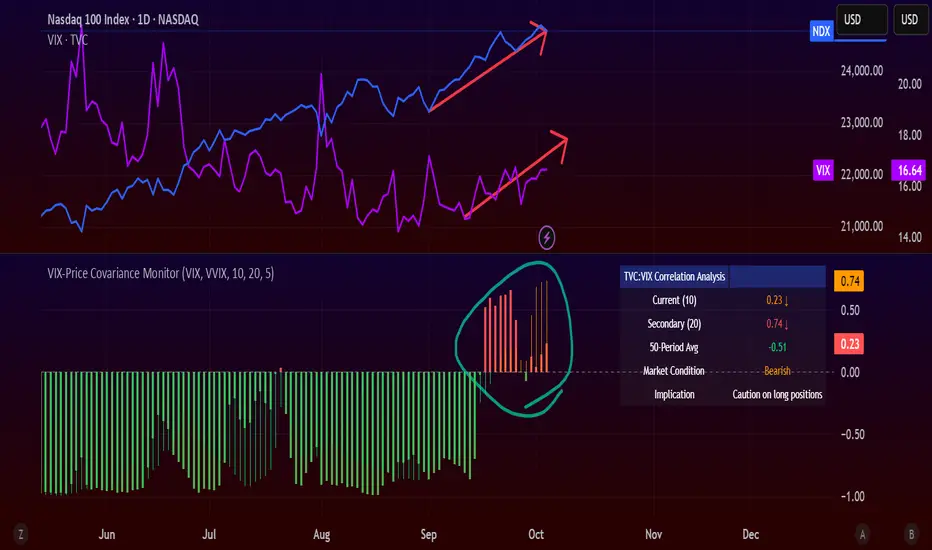
ALERT: VIX-NDX COVARIANCE HITS DANGER ZONEA few days ago, my custom VIX–Price Covariance Monitor started flashing red... and it hasn’t cooled off since.
Here’s what that means 👇
- The TVC:VIX (volatility index) and NASDAQ:NDX (Nasdaq 100) are now moving in the same direction.
That’s not normal.
Usually, when stocks rise, volatility falls.
But when both start climbing together — it means something under the surface is fracturing.
Half the times this correlation flips positive, the market corrects or worse, it crashes.
I’m not panic‑selling, but I’m definitely not buying either for now.
No new longs unless it’s a screaming opportunity.
In the meantime? Stacking cash and sitting tight.
This is time to play close attention to the market,
NQ Power Range Report with FIB Ext - 10/3/2025 SessionCME_MINI:NQZ2025
- PR High: 25107.75
- PR Low: 25073.00
- NZ Spread: 77.75
Key scheduled economic events:
08:30 | Nonfarm Payrolls (cancelled due to gov't shutdown)
- Average Hourly Earnings
- Unemployment Rate
09:45 | S&P Global Services PMI
10:00 | ISM Non-Manufacturing PMI
- ISM Non-Manufacturing Prices
Session Open Stats (As of 12:55 AM)
- Session Open ATR: 266.47
- Volume: 19K
- Open Int: 284K
- Trend Grade: Long
- From BA ATH: -0.0% (Rounded)
Key Levels (Rounded - Think of these as ranges)
- Long: 25204
- Mid: 23571
- Short: 21939
Keep in mind this is not speculation or a prediction. Only a report of the Power Range with Fib extensions for target hunting. Do your DD! You determine your risk tolerance. You are fully capable of making your own decisions.
BA: Back Adjusted
BuZ/BeZ: Bull Zone / Bear Zone
NZ: Neutral Zone
Gold – Is Gold Volatility Here to Stay?Gold has experienced a rollercoaster week up to this point as traders dealt with portfolio rebalancing into the end of Q3 on Tuesday and the fallout from a US government shutdown, which went into effect on Wednesday morning as Republican’s and Democrat’s failed to agree a new funding package for the first time in seven years.
Add to that, central bank buying of price dips as a diversification away from the dollar, geo-political risks and uncertainty about the next interest rate moves from the Federal Reserve (Fed) into the end of 2025, and traders may be asking the question, is Gold volatility here to stay?
In the short term, the answer could be yes.
So far this week, Gold prices opened on Monday at 3760 and rallied 3%, breaking above the previous all-time high of 3791, to see a new peak of 3872 on Tuesday morning. They then reversed course, dropping back 2% to 3793, before resuming the uptrend again on Wednesday, as the start of the US government shutdown commenced. Trading 2.7% higher to a new record high of 3895. Wow!
Gold is one of the most popular safe haven assets for traders and right now there is a lot of uncertainty fuelling its demand, especially through ETFs as investors rush to find a hedge for any problems that may materialise if US lawmakers can’t reach an agreement before the weekend.
One major issue created by the shutdown is the delay of Friday’s US Payrolls number. Traders were relying on this update to help them clarify the potential for a further interest rate cut from the Fed at their next meeting on October 29th. Fed policymakers, speaking this week, have provided mixed outlooks on interest rates, which has further muddied the water in this area, underpinning the move higher.
However, Gold long positioning does at times get extended as Tuesday’s drop highlights. With the Gold price currently trading near it’s all time highs (3868 0700 BST), it could be susceptible to downside pressure from a liquidation of weak long positioning caused, for example, by any headlines confirming a breakthrough in talks between Democrats and Republicans.
As suggested above, short term Gold volatility could continue into the weekend, and in this regard assessing the technical outlook to identify key support and resistance areas that may be relevant could be useful.
Technical Update: Challenging Extension Resistance
Since the August 20th low into yesterday new all-time high, Gold has advanced 17.6%, in what has been an almost uninterrupted phase of price strength. This has been reflected by the consistent posting of higher highs and higher lows in price, maintaining positive investor sentiment.
This move has defied some traders’ expectations that overbought or overextended conditions might stall the advance or even trigger weakness. As the chart above shows, that hasn’t materialised. However, prices did test a potential resistance focus at 3874 yesterday, a level equal to the 100% Fibonacci extension, which has so far successfully capped the advance on a closing basis. The question now is whether this marks the extent of the current price strength in Gold, or if it’s a pause before further upside attempts emerge.
While it's impossible to answer definitively at this stage, it’s increasingly important to identify and monitor key support and resistance levels in Gold. Should volatility pick up, these technical markers could prove important in assessing directional risk.
Potential Support Levels:
Price corrections following strong advances are a typical market response to short-term upside overextension, and Gold may well be entering such a phase. Traders could now focus on 3793 as the first key support, which is the 38.2% Fibonacci retracement of the latest rally. This level holding if price weakness is seen, could stabilise sentiment, while a closing break lower may lead to a deeper pullback.
A closing break below 3793 wouldn’t necessarily signal a shift in downside sentiment, but it could open tests of 3730, the deeper 61.8% Fibonacci retracement, a level that may offer stronger support if the sell-off extends.
Potential Resistance Levels:
Gold has stalled so far at 3874, the 100% extension level, which now marks initial resistance. If the uptrend from the August 20th low is to persist, a close above 3874 may lead to a more extended phase of price strength.
While not a guarantee of further price upside, successful closes above 3874 might trigger renewed attempts at strength in Gold, possibly opening scope toward 4017, the 138.2% Fibonacci extension, a level that may then act as the next main resistance area.
The material provided here has not been prepared accordance with legal requirements designed to promote the independence of investment research and as such is considered to be a marketing communication. Whilst it is not subject to any prohibition on dealing ahead of the dissemination of investment research, we will not seek to take any advantage before providing it to our clients.
Pepperstone doesn’t represent that the material provided here is accurate, current or complete, and therefore shouldn’t be relied upon as such. The information, whether from a third party or not, isn’t to be considered as a recommendation; or an offer to buy or sell; or the solicitation of an offer to buy or sell any security, financial product or instrument; or to participate in any particular trading strategy. It does not take into account readers’ financial situation or investment objectives. We advise any readers of this content to seek their own advice. Without the approval of Pepperstone, reproduction or redistribution of this information isn’t permitted.

NQ Power Range Report with FIB Ext - 10/2/2025 SessionCME_MINI:NQZ2025
- PR High: 25020.25
- PR Low: 25001.75
- NZ Spread: 41.5
Key scheduled economic events:
08:30 | Initial Jobless Claims
ATH push continues
Session Open Stats (As of 12:15 AM)
- Session Open ATR: 271.02
- Volume: 21K
- Open Int: 285K
- Trend Grade: Long
- From BA ATH: -0.0% (Rounded)
Key Levels (Rounded - Think of these as ranges)
- Long: 25204
- Mid: 23571
- Short: 21939
Keep in mind this is not speculation or a prediction. Only a report of the Power Range with Fib extensions for target hunting. Do your DD! You determine your risk tolerance. You are fully capable of making your own decisions.
BA: Back Adjusted
BuZ/BeZ: Bull Zone / Bear Zone
NZ: Neutral Zone
October 1st. Best Trading Day of the Year?NOTE: This is a post on Mindset and emotion. It is NOT a Trade idea or strategy designed to make you money. If anything, I’m posting this to help you preserve your capital, energy and will so you can execute your own trading system with calm, patience and confidence.
I was told yesterday that October 1 is historically a great trading day.
What does that mean?
That we buy? That we sell?
Or as traders, do we simply lean into the expected volatility in both directions, regardless of how it ends?
Is it really about direction or is it more about volatility itself?
And then I wondered, what about October as a whole?
We’ve just come through a really strong September. That alone puts expectations on edge. Do we continue higher? Or do we fall off in line with October’s reputation?
Because if you ask most people, October is “that scary crash month.”
1929. 1987. 2008.
Big events that seared into collective memory.
But the data tells a different story.
Seasonality studies show October has often been one of the stronger months for the S&P 500.
Yes, it tends to be more volatile with more big moves up and down.
But zoom out and October often finishes in positive territory. Many times it has even marked the end of declines and the start of new rallies.
So why does the “October crash” narrative persist?
Because our brains are wired to latch onto the dramatic, painful events more than steady gains. We remember the sting of a crash, not the quiet consistency of recovery.
That’s the mindset piece here.
Markets are not just numbers, they’re stories. The ones we tell ourselves, and the ones that echo across generations of traders.
If you believe October is dangerous, you’ll find evidence everywhere to confirm it.
If you believe October is an opportunity, you’ll see that too.
What matters is not October itself.
It’s your relationship with volatility and how you meet uncertainty. Both in the markets and in your own mental state.
Your ability to hold perspective in a month where the swings may be larger, the headlines louder and the ghosts of market history come knocking.
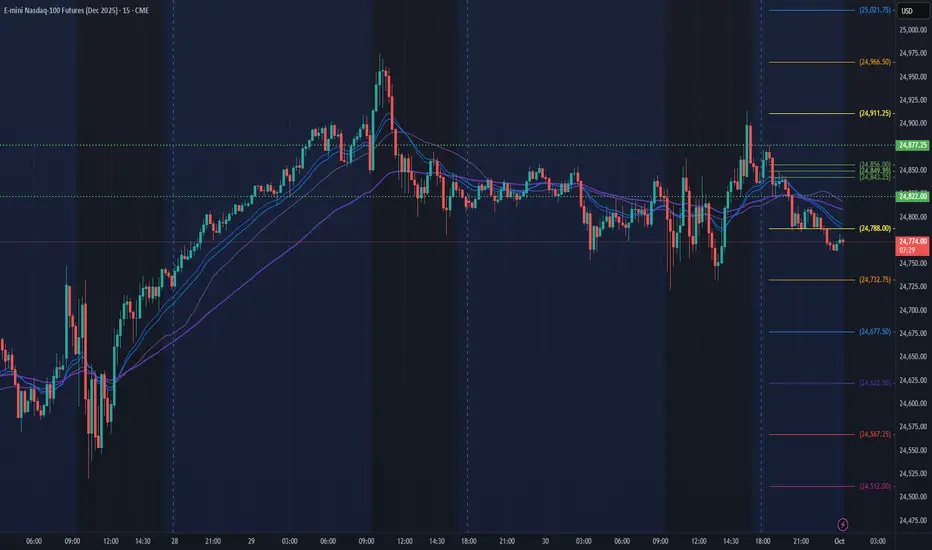
NQ Power Range Report with FIB Ext - 10/1/2025 SessionCME_MINI:NQZ2025
- PR High: 24876.75
- PR Low: 24822.00
- NZ Spread: 122.25
Key scheduled economic events:
08:15 | ADP Nonfarm Employment Change
09:45 | S&P Global Manufacturing PMI
10:00 | ISM Manufacturing PMI
- ISM Manufacturing Prices
Session Open Stats (As of 12:15 AM)
- Session Open ATR: 265.39
- Volume: 26K
- Open Int: 279K
- Trend Grade: Long
- From BA ATH: -1.0% (Rounded)
Key Levels (Rounded - Think of these as ranges)
- Long: 25204
- Mid: 23571
- Short: 21939
Keep in mind this is not speculation or a prediction. Only a report of the Power Range with Fib extensions for target hunting. Do your DD! You determine your risk tolerance. You are fully capable of making your own decisions.
BA: Back Adjusted
BuZ/BeZ: Bull Zone / Bear Zone
NZ: Neutral Zone
US 100 Index – Upside Momentum to be Put to the TestThe US 100 registered its first down week of September when it closed at 24507 last Friday, a weekly loss of 0.4%. Hardly a collapse but a warning that no market moves in a straight line, especially one so sensitive to many of the key drivers that traders are focused on, namely AI and Federal Reserve (Fed) interest rate moves.
It seems that last week’s dip may have been driven by some profit taking into the end of what has been a strong third quarter performance for this technology heavy index (8%, July 1st to September 26th). That drop has already been unwound by yesterday’s 0.4% rally which has continued this morning to current levels around 24640 (0730 BST), as traders’ position for some key economic data on the US labour market, which could clear up whether the Fed has room to cut interest rates again when they meet next on October 29th.
While there is a US labour market data release scheduled for every day across the remainder of this week, the focus could be Friday’s Payrolls update, where traders are anticipating a modest gain of around 39k and the unemployment rate to remain at its current level of 4.3%. Any deviation from these expectations could impact the market’s pricing of around a 90% chance of an October Fed rate cut, and a 60% chance of another December rate cut, with knock on implications for the direction of the US 100 at the start of Q4.
One obstacle impacting Friday’s Payrolls could be the possibility for a US Federal government shutdown from October 1st, which could delay the release of the labour market data, creating an extra level of uncertainty into the end of the week. Congressional leaders met with President Trump at the White House yesterday and talks to avoid a shutdown are on-going, although the latest updates provided by Vice President Vance suggests that a funding agreement is still some way off.
It may be worthwhile monitoring progress on this throughout the day ahead, just in case an agreement isn’t reached, and it leads to some extra US 100 volatility.
Technical Update: Price Decline Finding Support
Price corrections are a natural part of a broader uptrend and often reflect a healthy reaction to recent upside extremes. Following last week’s sell-off in the US 100 index, traders may now be assessing whether the latest weakness is simply a limited pullback ahead of renewed attempts to extend what still appears to be a constructive trend, or the beginning of a more extended price decline.
While it’s impossible to confirm whether a renewed phase of strength is underway, last week’s initial weakness found support at lower levels. As the chart above shows, fresh upside attempts may now be emerging, suggesting the possibility of a resumption of the uptrend pattern.
While positive sentiment may still be evident, this week’s upcoming data releases could prove pivotal, with the potential to shift momentum and drive notable price moves across key assets and traders will be watching closely for confirmation, or disruption, of the current US 100 index trend.
As a result, it may be important to identify and then monitor key support and resistance levels in case an increased spell of volatility emerges.
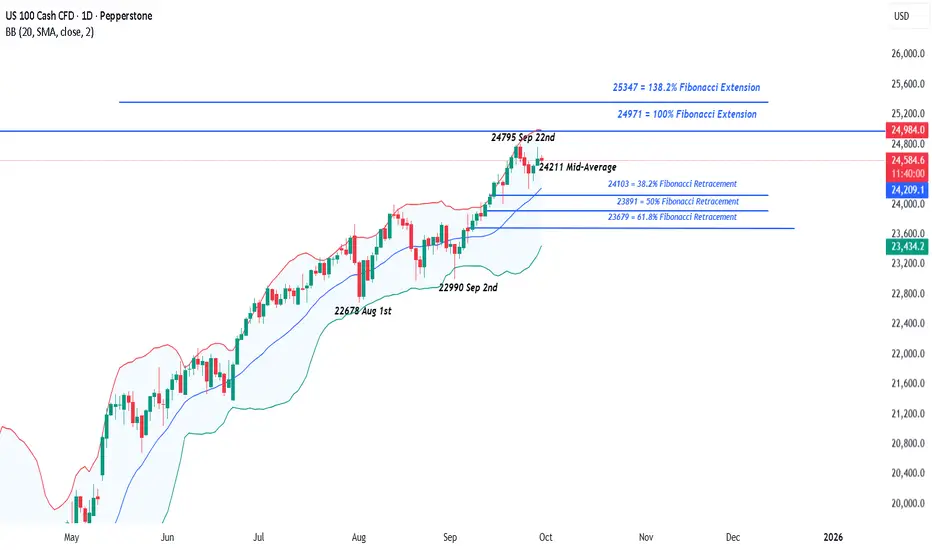
Potential Support Levels:
As the chart below shows, the latest price strength seen on Monday and into this morning, appears to be emerging from an initial support zone between 24211 and 24103. This range is marked by both the rising Bollinger mid-average and the 38.2% Fibonacci retracement of September’s advance.
A closing break below these levels wouldn’t confirm a downside shift but could pave the way for a test of 23891, the 50% retracement, and possibly even extend towards 23679, which is the 61.8% level.
Potential Resistance Levels:
After marking a new all-time high at 24795 on September 22nd, traders may now be monitoring this level as the initial resistance focus this week.
If the positive trend does remain, fresh attempts at price strength are possible. It could be worthwhile monitoring how the 24795 all-time high is defended on a closing basis, with successful breaks higher potentially leading to a further phase of price strength.
While a closing break above 24795 doesn’t guarantee further upside, it could trigger fresh attempts to push first towards 24971, the 100% Fibonacci extension, and potentially up to 25347, the 138.2% extension level.
The material provided here has not been prepared accordance with legal requirements designed to promote the independence of investment research and as such is considered to be a marketing communication. Whilst it is not subject to any prohibition on dealing ahead of the dissemination of investment research, we will not seek to take any advantage before providing it to our clients.
Pepperstone doesn’t represent that the material provided here is accurate, current or complete, and therefore shouldn’t be relied upon as such. The information, whether from a third party or not, isn’t to be considered as a recommendation; or an offer to buy or sell; or the solicitation of an offer to buy or sell any security, financial product or instrument; or to participate in any particular trading strategy. It does not take into account readers’ financial situation or investment objectives. We advise any readers of this content to seek their own advice. Without the approval of Pepperstone, reproduction or redistribution of this information isn’t permitted.
NQ Power Range Report with FIB Ext - 9/30/2025 SessionCME_MINI:NQZ2025
- PR High: 24837.75
- PR Low: 24807.75
- NZ Spread: 67.0
Key scheduled economic events:
09:45 | Chicago PMI
10:00 | CB Consumer Confidence
- JOLTS Job Openings
Session Open Stats (As of 12:15 AM)
- Session Open ATR: 267.05
- Volume: 16K
- Open Int: 274K
- Trend Grade: Long
- From BA ATH: -0.7% (Rounded)
Key Levels (Rounded - Think of these as ranges)
- Long: 25204
- Mid: 23571
- Short: 21939
Keep in mind this is not speculation or a prediction. Only a report of the Power Range with Fib extensions for target hunting. Do your DD! You determine your risk tolerance. You are fully capable of making your own decisions.
BA: Back Adjusted
BuZ/BeZ: Bull Zone / Bear Zone
NZ: Neutral Zone
USDJPY – Volatility Returns and 150.00 Could be Within ReachFX markets have been relatively quiet through much of September, taking a backseat to bigger moves in equities and precious metals. However, for USDJPY things may have started to change in the middle of last week, providing a glimpse into opportunities for bigger moves that may lie ahead in a potentially pivotal week for this popular currency.
Looking at the price action, USDJPY had been stuck trading between 148.50 and 146.00 for 3 weeks between September 5th and 23rd, with only a brief false break to the downside on September 17th (145.48, Fed rate cut day) to get traders excited. Then, last Wednesday a deeper dollar squeeze led to a pop above resistance at 148.50 to register a 2-month high of 149.92, before drifting back lower to close at 149.52 on Friday (more in technical section below).
On the open this morning, USDJPY has moved lower again touching a low at 148.71 (0800 BST) after a speech from BoJ policymaker Noguchi indicated he saw the need for further rate hikes. Although he didn’t indicate his preference for the timing of a rate hike it highlights the sensitivity of traders to central bank decision making.
Looking forward, traders may be focused on some key events across the week in the US and Japan that could shape the markets interest rate expectations for the Federal Reserve (BoJ) and Bank of Japan (BoJ) into the end of 2025.
In the US, the current health of the labour market could be the main driver of dollar volatility. There are 4 updates scheduled across the week, starting with the JOLTs Job Openings on Tuesday (1500 BST), followed by the ADP Private Sector Payrolls on Wednesday (1315 BST), then Weekly Jobless Claims on Thursday (1330 BST), all culminating with the critical Non-farm Payrolls release on Friday at 1330 BST.
It seems the consensus thinking may be for the US labour market to continue gradually weakening, opening the door for the Fed to cut interest rates further at upcoming meetings, however there is some nervousness that a stronger update could ruin those plans, potentially boosting the dollar, whereas a much weaker release could shock the market and send the dollar back lower.
In Japan, for those traders hoping the BoJ may raise interest rates again later in October, there is a theory suggesting the release of the Tankan survey, due on Wednesday (0050 BST), a quarterly assessment conducted by the BoJ to evaluate business conditions in Japan, could hold the key to the likelihood of such a move. A strong release could pave the way for BoJ Governor Ueda, who speaks on Friday (0205 BST), to highlight the possibility of a rate hike, potentially boosting the JPY, while a weaker Tankan reading could provide disappointment, weaken the JPY, and open potential for USDJPY to push above 150 for the first time since early August.
As you can see there is a lot for FX traders to consider this week.
Technical Update: Volatility Returns
August and early September marked a quiet phase for USDJPY, with more balanced themes producing choppy, sideways price action. This reflected a tug-of-war between buyers and sellers, with neither side asserting clear dominance.
However, as the chart above shows, Thursday’s upside move may be indicating a shift in tone, with prices producing a successful close above 149.14, the September 3rd session high. Even after the price setback that developed on Friday and so far this morning, traders might now be wondering if this breakout suggests a potential transition from consolidation to renewed upside momentum.
While this type of activity is not a guarantee of continued price strength, it could indicate a return of USDJPY volatility, meaning it may well be useful to be aware of potential support and resistance levels, to gauge where the next directional risks may lie.
Potential Resistance:
Having broken and closed above 149.14, the September 3rd high, it is possible this move may now lead to further attempts at price strength. If that is the case, the first possible resistance could now be 150.92, a level which is equal to the August 1st upside extreme.
Closes above this 150.92 level may now be required to suggest potential for further price strength to higher levels, which could prompt tests of 151.64, the 61.8% Fibonacci retracement of the year-to-date decline.
Potential Support:
Despite last week’s breakout, a downside reaction to the recent price strength in USDJPY still remains a possibility and has so far materialised this morning. This could see a further corrective move, with trader attention now perhaps focused on 148.21, which is the 38.2% Fibonacci retracement of the latest advance, as the first support level.
Should USDJPY close below 148.21 it could trigger further downside. In this case, the next support might then prove to be 147.16, which is the deeper 61.8% retracement level, with scope if this also gives way, for an extended decline toward 145.48, the September 17th low.
The material provided here has not been prepared accordance with legal requirements designed to promote the independence of investment research and as such is considered to be a marketing communication. Whilst it is not subject to any prohibition on dealing ahead of the dissemination of investment research, we will not seek to take any advantage before providing it to our clients.
Pepperstone doesn’t represent that the material provided here is accurate, current or complete, and therefore shouldn’t be relied upon as such. The information, whether from a third party or not, isn’t to be considered as a recommendation; or an offer to buy or sell; or the solicitation of an offer to buy or sell any security, financial product or instrument; or to participate in any particular trading strategy. It does not take into account readers’ financial situation or investment objectives. We advise any readers of this content to seek their own advice. Without the approval of Pepperstone, reproduction or redistribution of this information isn’t permitted.

September 29 - October 3 Market AnalysisHello everyone - it has been a while since I have posted an Idea. I tried to come up with a template for recurring posts earlier in the year that just became too time-consuming so I decided to wait until I worked out something different.
Lately, I have been moving away from purely focusing on technical analysis and more towards building a framework that helps me assess the overall market structure to set my bias before then looking to technicals and other indicators to find trade entries. My current approach utilizes three dashboards for market structure, which I call Macro, FX, & Risk. From there, I have a specific layout on Futures that helps me track order flow and momentum. When I feel like I have a good read on the market and am ready to make a trade, I then look at the 0DTE options chain and AMEX:SPY intraday chart to determine support/resistance and good entry points.
I’m still working on improving using this style of trading, but will try to journal my bias on a weekly basis from here forward if possible, which can help me determine areas where I am succeeding and others that could use improvement. For today, I will try to briefly run through each of my layouts with brief notes about how I am perceiving the market’s activity in context. I’ll look at this on a shorter scale in the future, but for now I am going to look at roughly the last 12 months, going back to October 2024.
Layout 1: Macro
On this layout, the goal is to gauge the overall market backdrop. Here, we can see that TVC:DXY declined until July where it began to flatten. It’s still moving down slightly on average but the slope is not as steep, however I would not yet call this a bottom as the current candlestick setup makes me think more downside is still a possibility.
The next two panes show a comparison of
• TVC:US03MY (risk-free short term yield); black
• TVC:US10Y (risk-free short term yield); white
• FRED:DFII10 (10Y real yield: US10Y minus inflation expectations from TIPS); blue
indexed to 100 and the “Inflation Gauge” which is the difference between the average nominal US bond yield ((US10Y+US03MY)/2) minus the 10Y Real Yield, which provides a rough estimate of inflation expectations. Here we can see that nominal and real yields have been on the decline since June. In the first part of this phase, the inflation gauge was rising, suggesting true risk-on behavior. Fed policy remained unchanged while there was a modest rise in inflation expectations, yet investors did not pile into gold, so equities were the preferred risk asset during this period, especially since the dollar remained flat as previously mentioned.
On the righthand side, inflationary commodities (namely Oil NYMEX:CL1! and Corn CBOT:ZC1! ) have mostly been suppressed during this calendar year, however Oil has remained in a flat range since June and Corn has been on the rise since the middle of August. Copper COPPER1! , which is more of a signal of industrial demand, has been on a steady rise since markets bottomed in April 2025 and may even be accelerating.
Since inflation expectations have been falling, the rise in Copper and Corn may be more of a demand signal, however if something causes Oil or the other two commodities to surge too quickly, these could turn into inflation drivers.
For now, the picture I’m seeing here is that the market’s risk-on appetite may be waning, in favor of safer bets like US Treasuries and Gold, even when inflation expectations are taken into account. Commodities and the Inflation Gauge will be important to keep watching, as correlation to the upside could quickly change the economic backdrop.
Layout 2: FX
Here, I am seeing that US nominal yields remain higher than most other major countries (Germany and Italy are both Blue to match EXY and are the solid and dotted lines, respectively) while the Dollar has seen a steep decline compared to other currency baskets over the same period. The message this sends to me is that investors are demanding a higher return on US debt while betting that monetary policy will ease, growth will slow, or both.
Layout 3: Risk
On this layout I am keeping track of the following
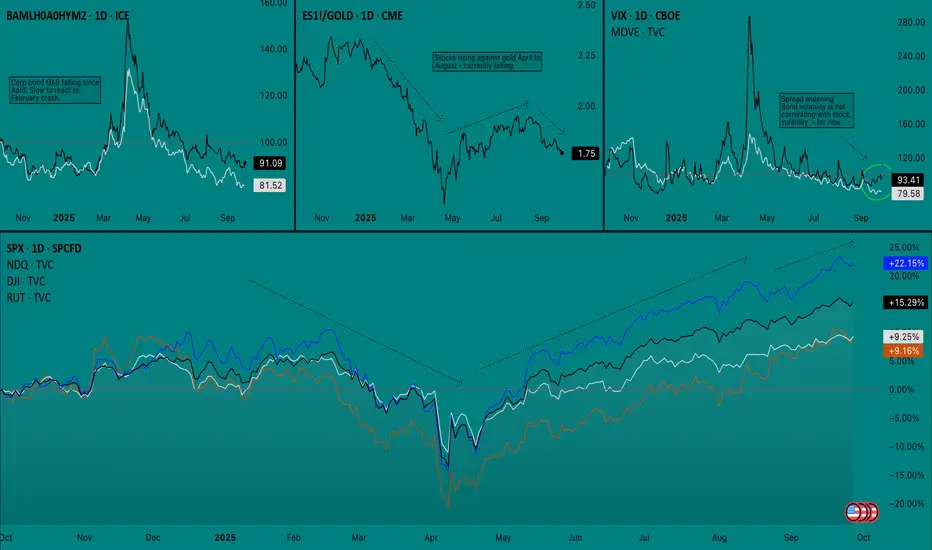
Top Left: Option adjusted spread (OAS) of corporate High Yield bonds/Investment Grade bonds
Top Middle: S&P 500 Futures/Gold spread
Top Right: TVC:VIX and TVC:MOVE overlay
Bottom: Stock index comparison (SPX, NDQ, DJI, RUT)
I should have mentioned earlier that I’m trying to keep the start/end of the arrows on all of the charts aligned. The takeaway here is that the last time we saw CME_MINI:ES1! sharply fall against TVC:GOLD , it provided an early signal for an equity sell off. The sell off Feb-April was a true risk-off event since both High Yield and Investment Grade bond yields surged and there was a simultaneous spike on VIX and MOVE. So far in September, we have seen stock volatility while bond volatility has remained flat. While VIX and MOVE were not leading indicators before, at the very least this indicates that equities are not yet ready to sell off.
Still, I cannot stress the point enough that Gold is very important to watch right now, especially as it relates to stocks since it can suggest that investors view it as the better risk asset, which cold lead them to dump the other (stocks) if an event makes it seem warranted.
——————————
Put simply, I think the market is saying the following:
1. More rate cuts are expected
2. Slower growth may be the bigger fear than inflation (at the moment)
3. Inflation worries are still present, yet diminished
4. Hedging with safe assets (bonds, gold) may be more attractive than stocks
5. Recent stock declines do not have risk-off confirmation
Next, I will take a look at my Bias chart, which right now mostly covers September thus far.
Layout 4: Bias
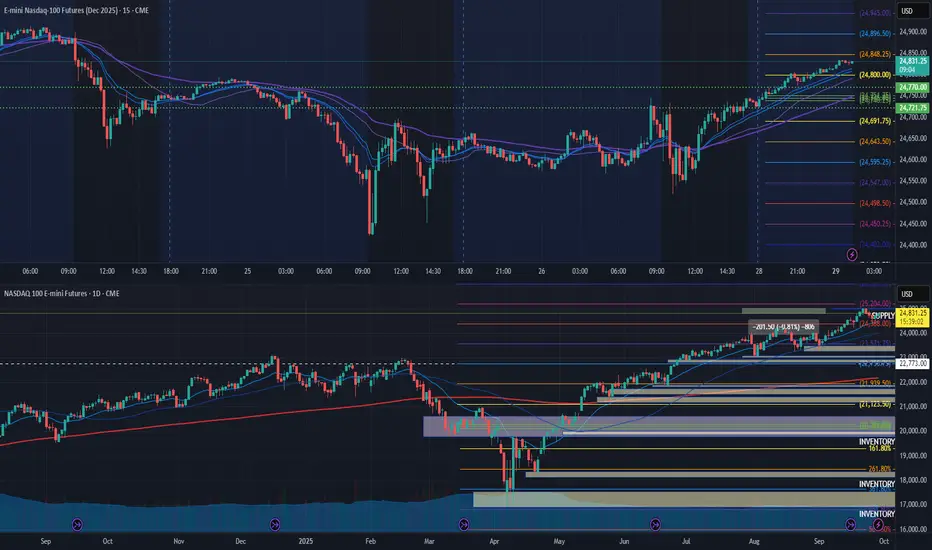
There’s a few things going on here that not everyone may be familiar with, so I’ll break it down pane-by-pane, as I have found this layout for Futures CME_MINI:ES1! to be very effective
Top Left: 50R chart with indicators only. CVD Daily (blue), CVD Weekly (black), Fisher Transform (y-axis log scale), Anchored OBV (daily)
Bottom Left: ES1! Line Break (3 lines, 1h)
Center: ES1! Renko (ATR, 15m)
Right: VIX (1h)
I’m using a 50R chart on the top left pane to filter time-based noise and to provide more data to be calculated into each bar on the CVD indicator, which gives more conviction to each move. CVD is the most important indicator here and I have found that comparing Daily and Weekly CVD becomes more effective as the week progresses and often shows hidden order-flow divergences.
Line Break creates a new line when the price closes in the same direction of the trend. Reversals only occur when the price crosses above or below three lines in the opposite direction. Successions of small boxes (like we see here) are easy to reverse than several long boxes in a row.
Renko is similar to line break but it is filtered by ATR and new boxes only have to clear the filter before a reversal prints.
On this layout, we can see that there was a battle last week on the order flow but buyers ended up finishing on top. Volatility was climbing for six sessions straight but ended up getting dumped on Friday (9/26). Futures are currently climbing back towards ATH on Sunday night, however the print on the Line Break chart has me cautious about if this will be quickly reversed. I’d like to see at least one long bar print heading into Monday if I’m going to go long, as Line Break must be aligned with whichever direction I trade in.
——————————
Conclusion: I’m approaching this week with a good deal of caution. While I do not think that we will see a true risk-off event until the market approaches a point where policy tightening is getting priced in (i.e. Fed is too dovish and accelerates inflation, leading to a quick policy reversal). Still, the market’s defensive positioning and relative waning of interest in stocks cannot be ignored. With Q4 being traditionally strong, the market may sell into the weakness in order to reposition for a bullish end of the year, even if the broader outlook is starting to signal trouble ahead.
I’m not confident about trading either side on Monday, so it could be a volatility rebalancing day. What I will watch for, however, is VIX finding support and whether or not Futures reach new ATHs before pulling back. ATH before a pullback would be the best bullish scenario, while a failure to make new highs could lead to a flat distribution or re-accumulation range. In which case, order flow and daily options positioning will be important to watch.
If this becomes a weekly thing I will definitely not be explaining all of my charts and indicators each time, and will opt to keep it brief but wanted to at least explain it all once in case anyone ends up following along. Let me know if you have any questions or suggestions on how I can sharpen my analysis. Thank you for reading - AP.
NQ Power Range Report with FIB Ext - 9/29/2025 SessionCME_MINI:NQZ2025
- PR High: 24769.75
- PR Low: 24721.75
- NZ Spread: 107.5
No key scheduled economic events
Session Open Stats (As of 1:15 AM 9/29)
- Session Open ATR: 273.59
- Volume: 28K
- Open Int: 273K
- Trend Grade: Long
- From BA ATH: -0.8% (Rounded)
Key Levels (Rounded - Think of these as ranges)
- Long: 25204
- Mid: 23571
- Short: 21939
Keep in mind this is not speculation or a prediction. Only a report of the Power Range with Fib extensions for target hunting. Do your DD! You determine your risk tolerance. You are fully capable of making your own decisions.
BA: Back Adjusted
BuZ/BeZ: Bull Zone / Bear Zone
NZ: Neutral Zone
Both Side Movement on NQ on week 29/09 - 03/10I expect price to move higher clearing those highs at 25000 before starting full corse to the downside.
We could see a 6-7% drop the month of October possibly even 10-12%. Opportunity to get into the market cheaper.
Always remember, Caution, Patience and Risk!
GL!
If you like the content give me a follow on X!
Check Bio. Cheers!

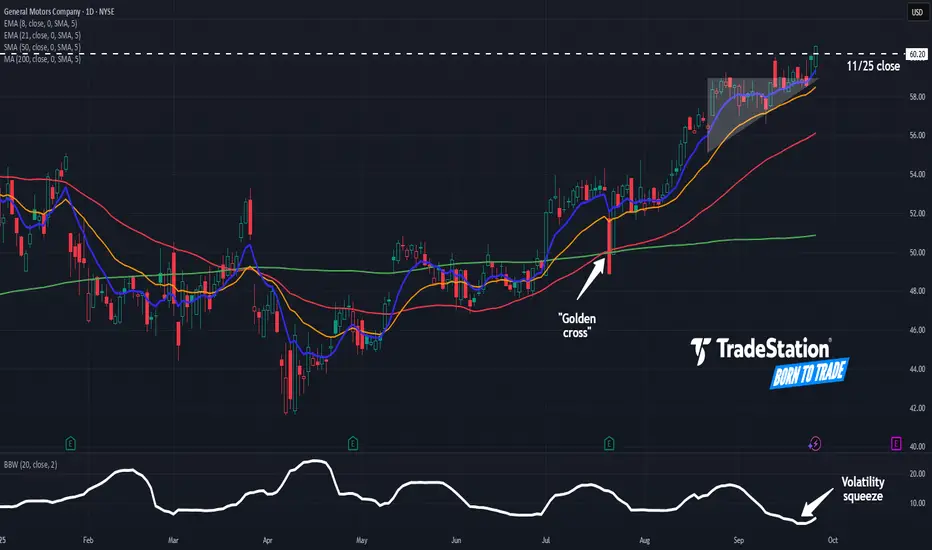
General Motors Could Be AcceleratingGeneral Motors has pushed higher amid low volatility, and some traders may think the automaker is starting to accelerate.
The first pattern on today’s chart is the series of higher lows since mid-August. Prices mostly remained below $59 until last week, creating an ascending triangle. They now seem to be escaping that potentially bullish continuation pattern.
Second, GM ended Thursday at its highest daily closing price since early 2022.
Third, Bollinger Band Width recently fell to its lowest reading since July 2017. Will that price compression give way to expansion?
Next, the 50-day simple moving average (SMA) had a “golden cross” above the 200-day SMA in July and has remained there since. That could reflect a more positive long-term uptrend.
Finally, the 8-day exponential moving average (EMA) has remained above the 21-day EMA since late June. That may be consistent with a short-term uptrend.
TradeStation has, for decades, advanced the trading industry, providing access to stocks, options and futures. If you're born to trade, we could be for you. See our Overview for more.
Past performance, whether actual or indicated by historical tests of strategies, is no guarantee of future performance or success. There is a possibility that you may sustain a loss equal to or greater than your entire investment regardless of which asset class you trade (equities, options or futures); therefore, you should not invest or risk money that you cannot afford to lose. Online trading is not suitable for all investors. View the document titled Characteristics and Risks of Standardized Options at www.TradeStation.com . Before trading any asset class, customers must read the relevant risk disclosure statements on www.TradeStation.com . System access and trade placement and execution may be delayed or fail due to market volatility and volume, quote delays, system and software errors, Internet traffic, outages and other factors.
Securities and futures trading is offered to self-directed customers by TradeStation Securities, Inc., a broker-dealer registered with the Securities and Exchange Commission and a futures commission merchant licensed with the Commodity Futures Trading Commission). TradeStation Securities is a member of the Financial Industry Regulatory Authority, the National Futures Association, and a number of exchanges.
TradeStation Securities, Inc. and TradeStation Technologies, Inc. are each wholly owned subsidiaries of TradeStation Group, Inc., both operating, and providing products and services, under the TradeStation brand and trademark. When applying for, or purchasing, accounts, subscriptions, products and services, it is important that you know which company you will be dealing with. Visit www.TradeStation.com for further important information explaining what this means.
NQ Power Range Report with FIB Ext - 9/26/2025 SessionCME_MINI:NQZ2025
- PR High: 24665.25
- PR Low: 24625.75
- NZ Spread: 88.5
Key scheduled economic events:
08:30 | Core PCE Price Index (MoM|YoY)
Session Open Stats (As of 1:15 AM 9/26)
- Session Open ATR: 276.26
- Volume: 29K
- Open Int: 277K
- Trend Grade: Long
- From BA ATH: -1.7% (Rounded)
Key Levels (Rounded - Think of these as ranges)
- Long: 25204
- Mid: 23571
- Short: 21939
Keep in mind this is not speculation or a prediction. Only a report of the Power Range with Fib extensions for target hunting. Do your DD! You determine your risk tolerance. You are fully capable of making your own decisions.
BA: Back Adjusted
BuZ/BeZ: Bull Zone / Bear Zone
NZ: Neutral Zone
NVIDIA – Bumping Up Against Record HighsNVIDIA’s share price is experiencing an interesting run into the end of September as traders try and work out whether it can extend its run of gains through all time highs sitting just above the 184 level (184.55 Sept 22nd), a line in the sand that has capped the upside since the start of August (more on this in the technical update below).
With NVIDIA being the biggest company in the world by market capitalisation, currently sitting at a huge $4.34 trillion (No.2 Microsoft, $3.79 trillion), and it being the bellwether for AI performance, it’s not short of news flow to create periods of volatility.
Only on Monday, the company announced a $100 billion link up with Open AI to build new data centres and expand AI infrastructure together, which sent its stock price up 4% towards that 184 resistance, only for Federal Reserve Chairman Jerome Powell in a speech on Tuesday to send it back lower again as investors banked profits, when he offered a more cautious outlook towards future Fed rate cuts into the end of the year.
Looking into the end of the week, the focus may be on US economic data again, with the release of the final US Q2 GDP reading at 1330 BST today, and perhaps more importantly, the PCE index, which is the Fed’s preferred inflation gauge, due tomorrow at 1330 BST. Traders seem to be very sensitive to these inflation readings, given that they could determine whether the Fed is able to cut interest rates again before the end of 2025. Any deviation from expectations, to the up or downside could have an outsized impact on sentiment towards the NVIDIA stock price into the Friday close.
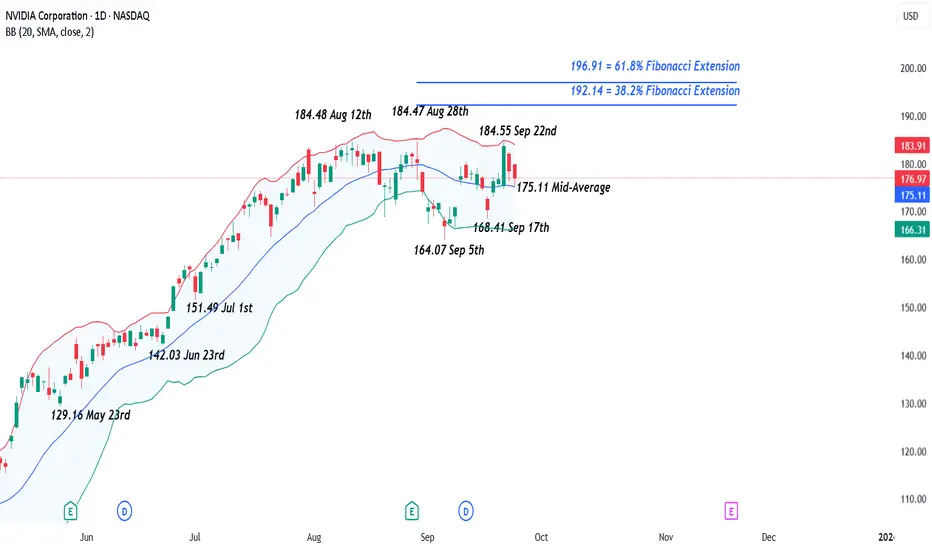
Technical Update: Watching Record Highs
Since reaching its 184.48 high on August 12th, NVIDIA has twice attempted to break and close above this resistance, on August 28th and September 22nd. The latest attempt did set a new intraday high of 184.55, but as the chart below shows, resistance held again by the close, triggering another sell-off from that level.
This price action confirms the 184.48/184.55 range as a potentially key resistance area. A successful close above it could lead to a further phase of price strength.
While not a guarantee of continued upside, a closing break above 184.48/184.55 could open the path to 192.14, a level equal to the 38.2% Fibonacci extension. If this level were to also give way on a closing basis, the next resistance may prove to be 196.91, which is the higher 61.8% extension.
Of course, with resistance at 184.48/184.55 still capping price strength, there's also the risk that support levels could give way, possibly suggesting further downside in price activity.
Initial support may now be marked by 175.11, the Bollinger mid-average, which is currently containing the latest pullback in price. While a close below here may not confirm extended price weakness, it might open the door to test lower supports at 168.41, which is the September 17th low, possibly even 164.07, a level equal to the September 5th extreme.
The material provided here has not been prepared accordance with legal requirements designed to promote the independence of investment research and as such is considered to be a marketing communication. Whilst it is not subject to any prohibition on dealing ahead of the dissemination of investment research, we will not seek to take any advantage before providing it to our clients.
Pepperstone doesn’t represent that the material provided here is accurate, current or complete, and therefore shouldn’t be relied upon as such. The information, whether from a third party or not, isn’t to be considered as a recommendation; or an offer to buy or sell; or the solicitation of an offer to buy or sell any security, financial product or instrument; or to participate in any particular trading strategy. It does not take into account readers’ financial situation or investment objectives. We advise any readers of this content to seek their own advice. Without the approval of Pepperstone, reproduction or redistribution of this information isn’t permitted.
NQ Power Range Report with FIB Ext - 9/25/2025 SessionCME_MINI:NQZ2025
- PR High: 24753.00
- PR Low: 24740.00
- NZ Spread: 29.0
Key scheduled economic events:
08:30 | Initial Jobless Claims
- Durable Goods Orders
- GDP
10:00 | Existing Home Sales
Session Open Stats (As of 12:15 AM 9/25)
- Session Open ATR: 267.80
- Volume: 16K
- Open Int: 274K
- Trend Grade: Long
- From BA ATH: -0.9% (Rounded)
Key Levels (Rounded - Think of these as ranges)
- Long: 25204
- Mid: 23571
- Short: 21939
Keep in mind this is not speculation or a prediction. Only a report of the Power Range with Fib extensions for target hunting. Do your DD! You determine your risk tolerance. You are fully capable of making your own decisions.
BA: Back Adjusted
BuZ/BeZ: Bull Zone / Bear Zone
NZ: Neutral Zone