US 100 Index – Assessing a Crucial Week for Tech StocksAs a trader it can be helpful to spend some time on a Sunday afternoon sitting at your trading desk gathering your thoughts and preparing for the week ahead. Checking the Pepperstone economic calendar to assess the scheduled risk events in terms of timing and importance can be a useful part of this process. This upcoming week is quite impressive, packed with central bank meetings and economic data that could impact many, if not all, of the major markets available to trade on the Pepperstone platform.
The standout event could be the Federal Reserve (Fed) interest rate announcement on Wednesday at 1900 BST, which is followed closely by the press conference led by Chairman Powell, which starts at 1930 BST. However, Thursday’s Bank of England interest rate decision at 1200 BST, or Friday’s Bank of Japan interest rate decision due at 0400 BST, and then the press conference led by Governor Ueda may also keep traders on volatility alert.
The US 100 index is the focus of today’s commentary as it can be more sensitive than other indices to interest rate moves made by the Fed.
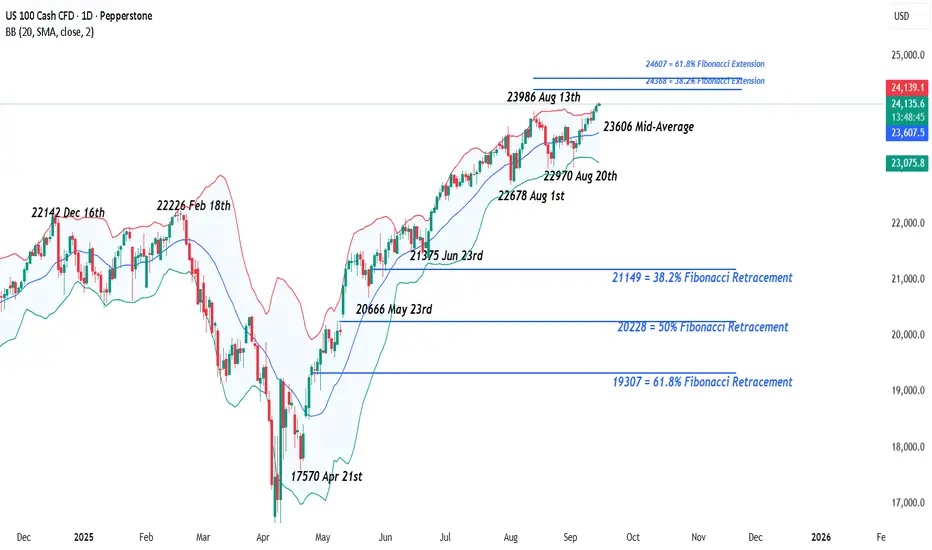
As can be seen on the daily Pepperstone chart above, the US 100 index has experienced a period of higher highs and higher lows since the 2025 low was hit way back at 16290 on April 7th, helped in no small part by a re-engagement of traders with the potential of artificial intelligence and what it could mean for the future earnings of the leading companies in this space. This AI driver is still in very much in play but may take a backseat this week due to the Federal Reserve rate decision.
Since the surprise weaker than expected US employment report on August 1st (Non-farm payrolls) market expectations for Fed rate cuts have increased, helping to support the latest US 100 uptrend from its August 1st lows at 22678 to print numerous record closing highs, the latest being Friday at 24096.
For the Fed interest rate decision on Wednesday, a 25bps (0.25%) cut is fully priced by traders, but there is a small outside chance of a 50bps (0.5%) cut, a decision which, if it happened, could generate equal amounts of uncertainty that policy makers feel they could be behind the curve in supporting the economy and that the labour market is weakening faster than anticipated, but also surprise that the Fed may be willing to cut rates faster, which as a general rule can be supportive of US100 index gains.
The press conference may also be a relevant consideration for US 100 price volatility. Traders will be keen to hear Chairman Powell’s stance on the possibility for further rate cuts, with economists predicting just one more 25bps cut into the end of 2025, while the market is pricing another 2 25bps reductions. Any comments he makes on the independence of the US central bank, with an appeal court ruling expected imminently on whether President Trump has the authority to sack Fed Governor Cook, as well as his thoughts on the deterioration of the US labour markets and direction of inflation could also be important.
Technical Update: New All-Time Highs Posted
After reaching a new all-time high of 24142 on Friday, the market continues to show signs of a positive trend, which has been evident since the low of 16290 recorded on April 7th.
As the chart above shows, the market has formed a pattern of higher highs and higher lows. While this doesn’t guarantee that prices will continue to rise, the recent new peak suggests there might be further upward momentum ahead.
Although positive sentiment appears to remain in place, this week’s upcoming data releases and interest rate decision could significantly impact price movements.
As a result, it may be important to identify and then monitor key support and resistance levels in case an increased spell of volatility emerges.
Potential Resistance Levels:
Following the recording of the latest all-time high at 24142 on Friday, traders may be anticipating continued attempts at upward momentum to extend the current uptrend.
The outlook suggests that further attempts to push toward the next resistance levels could emerge in the coming week.
With the US 100 index now entering uncharted territory, traders may be turning their attention to Fibonacci extension levels based on the August 13th to 20th sell-off. The 38.2% extension is at 24368, and if this level is breached, the next potential resistance could be 24607, the 61.8% extension.
Potential Support Levels:
The US 100 recently closed back above the rising Bollinger mid-average, currently at 23606, and so this level could act as the first initial support for the week. If retested, it may be important to monitor whether the market can hold above it on a closing basis.
A closing break below 23606 wouldn’t necessarily signal a negative shift, but it could open the door for a test of 22970, which is the low from August 20th, and potentially lower if that level fails to hold.
The material provided here has not been prepared accordance with legal requirements designed to promote the independence of investment research and as such is considered to be a marketing communication. Whilst it is not subject to any prohibition on dealing ahead of the dissemination of investment research, we will not seek to take any advantage before providing it to our clients.
Pepperstone doesn’t represent that the material provided here is accurate, current or complete, and therefore shouldn’t be relied upon as such. The information, whether from a third party or not, isn’t to be considered as a recommendation; or an offer to buy or sell; or the solicitation of an offer to buy or sell any security, financial product or instrument; or to participate in any particular trading strategy. It does not take into account readers’ financial situation or investment objectives. We advise any readers of this content to seek their own advice. Without the approval of Pepperstone, reproduction or redistribution of this information isn’t permitted.
Volatility
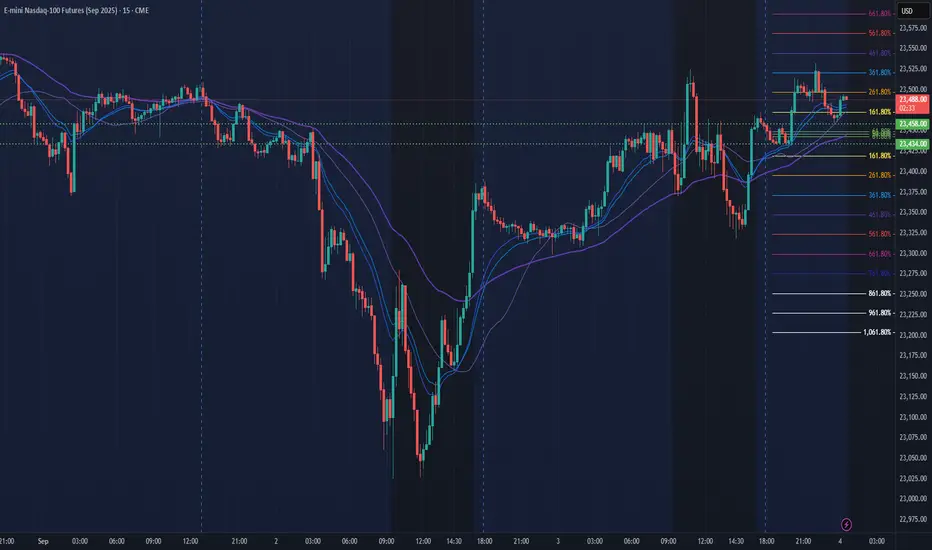
NQ Power Range Report with FIB Ext - 9/15/2025 SessionCME_MINI:NQU2025
- PR High: 24129.50
- PR Low: 24099.75
- NZ Spread: 66.75
No key scheduled economic events
Contract rollover week
- Advertising potential to continue ATH march
Session Open Stats (As of 12:45 AM 9/15)
- Session Open ATR: 270.13
- Volume: 13K
- Open Int: 273K
- Trend Grade: Long
- From BA ATH: -0.1% (Rounded)
Key Levels (Rounded - Think of these as ranges)
- Long: 25217
- Mid: 22503
- Short: 21790
Keep in mind this is not speculation or a prediction. Only a report of the Power Range with Fib extensions for target hunting. Do your DD! You determine your risk tolerance. You are fully capable of making your own decisions.
BA: Back Adjusted
BuZ/BeZ: Bull Zone / Bear Zone
NZ: Neutral Zone
Both Side NQ for the week of 15-20/09/2025NQ will retrace a bit lower just to continue higher. If we reach the 24500 I can see having a bearish close the last two day of the week.
Always remember, Caution, Patience and Risk!
GL!
If you like the content give me a follow on X!
Check Bio. Cheers!

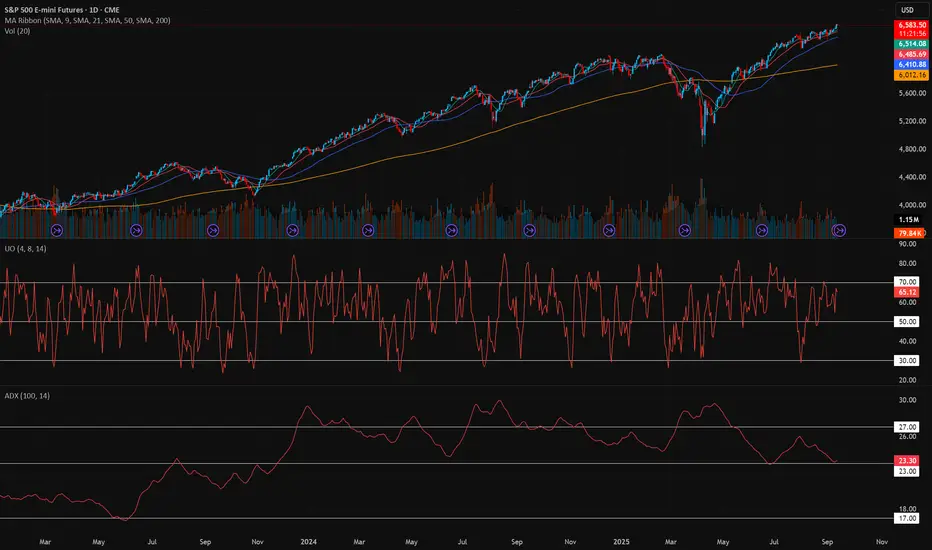
Simple UO + ADX Futures Strategy📚 Trading Plan with UO + ADX + 9/21 MA
1. Indicator Roles
Ultimate Oscillator (UO): Measures momentum across 3 different timeframes (short, medium, long). I use the lengths 4/8/14.
Overbought: > 70
Oversold: < 30
Neutral: 30–70 range
ADX (14-period, 100 smoothed): Measures trend strength, not direction.
Weak trend: < 17~20
Building trend: 20–25
Strong trend: > 27–30, enter on pullback. A bounce from the 9 or 21 MA.
2. Core Trading Logic
We combine momentum (UO) with trend strength (ADX) to avoid false signals.
Long Setup (Buy):
ADX rising above 23 → trend gaining strength.
UO crosses above 30 from below → confirms bullish momentum.
Confirm price is above 21-day MA (optional filter for trend).
📈 Exit:
UO > 50 and turning down, or
ADX below 17, or
Trailing MA.
Short Setup (Sell):
ADX rising above 27 → trend gaining strength.
UO crosses below 70 from above → confirms bearish momentum.
Confirm price is below 9-day MA (optional filter for trend).
📉 Exit:
UO < 30 and turning up, or
ADX drops below 20, or
Trailing stop.
3. Advanced Filters
Avoid false breakouts: If ADX < 20, ignore UO signals (no strong trend).
Divergence filter: If price makes a new high but UO does not → weakening trend.
Scaling:
Add to winners if ADX > 30 and still rising.
Take partial profits if ADX flattens while UO is in extreme zone.
4. Risk Management
Position sizing: Risk 1–2% of account per trade.
Stop loss: Below recent swing low (for longs) or above swing high (for shorts).
Take profit: Risk:Reward 1:2 minimum, or trail with MA.
5. Example Workflow
Case 1 (Bullish):
ADX rises from 18 → 27 (trend forming).
UO crosses 50 → bullish signal.
Enter long.
Exit when UO > 70 and rolls over, or ADX drops < 20.
Case 2 (Bearish):
ADX rises above 25.
UO crosses below 50.
Enter short.
Exit when UO < 30 and turns up, or ADX weakens.
✅ Summary Ruleset
Trade only when ADX > 23–25 (filter out noise).
Go long: UO crosses > 50 with rising ADX.
Go short: UO crosses < 50 with rising ADX.
Exit on momentum extremes (UO < 30 or > 70) or weakening ADX.
Risk: Keep losses capped at 1–2% of equity per trade.
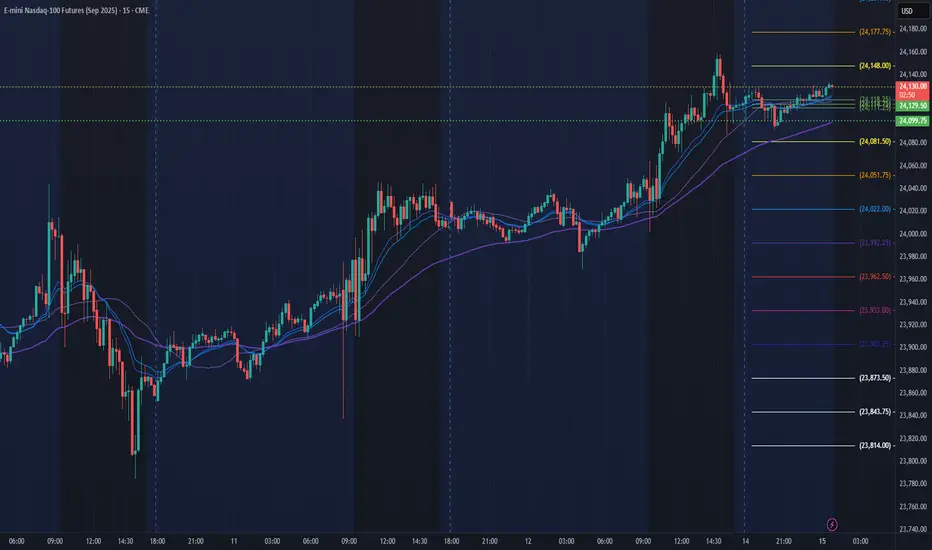
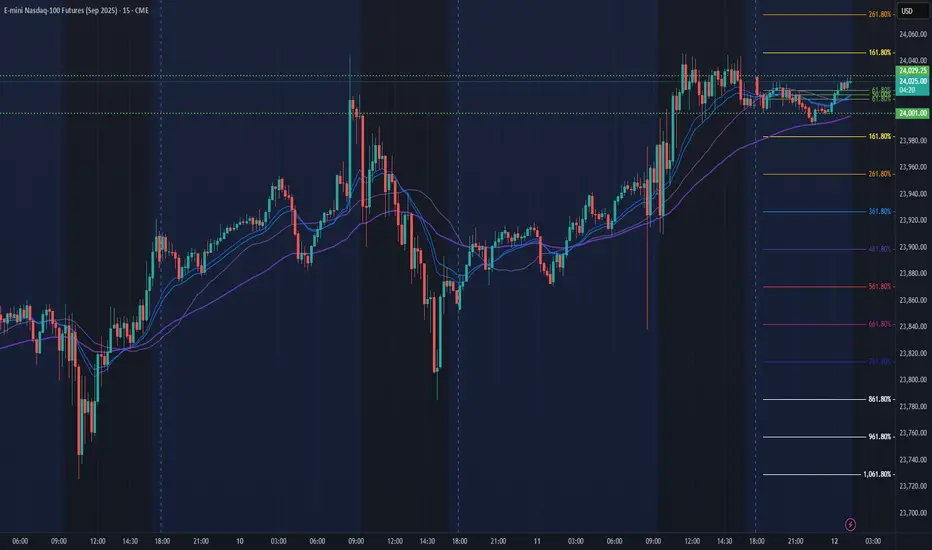
NQ Power Range Report with FIB Ext - 9/12/2025 SessionCME_MINI:NQU2025
- PR High: 24029.25
- PR Low: 24001.00
- NZ Spread: 63.25
No key scheduled economic events
Teasing ATH break
Session Open Stats (As of 12:45 AM 9/12)
- Session Open ATR: 277.00
- Volume: 17K
- Open Int: 283K
- Trend Grade: Long
- From BA ATH: -0.1% (Rounded)
Key Levels (Rounded - Think of these as ranges)
- Long: 24382
- Mid: 23239
- Short: 22096
Keep in mind this is not speculation or a prediction. Only a report of the Power Range with Fib extensions for target hunting. Do your DD! You determine your risk tolerance. You are fully capable of making your own decisions.
BA: Back Adjusted
BuZ/BeZ: Bull Zone / Bear Zone
NZ: Neutral Zone
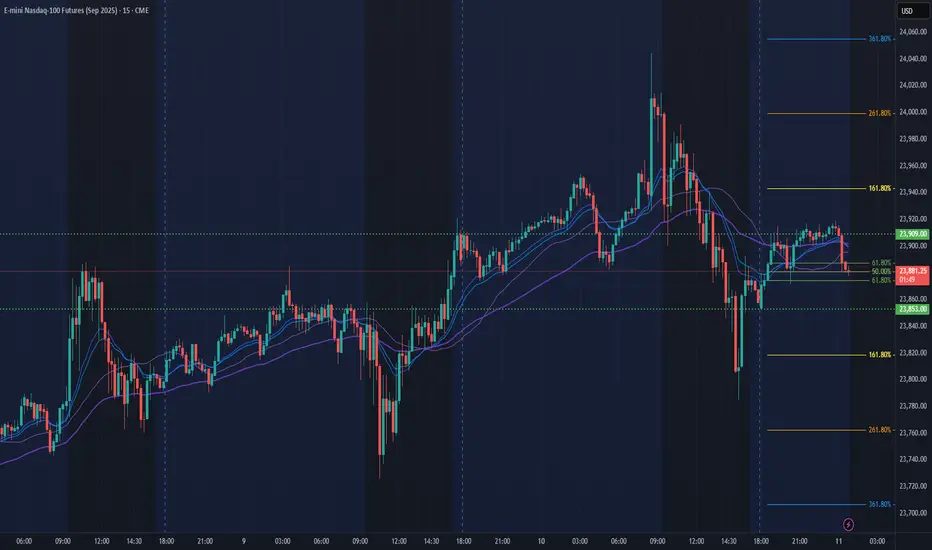
NQ Power Range Report with FIB Ext - 9/11/2025 SessionCME_MINI:NQU2025
- PR High: 23908.75
- PR Low: 23852.75
- NZ Spread: 125.25
Key scheduled economic events:
08:30 | Initial Jobless Claims
- CPI (Core|MoM|YoY)
13:00 | 30-Year Bond Auction
Temp 25% AMP margins increase for expected pre-RTH news-based volatility spike
Session Open Stats (As of 12:15 AM 9/11)
- Session Open ATR: 285.32
- Volume: 17K
- Open Int: 280K
- Trend Grade: Long
- From BA ATH: -0.7% (Rounded)
Key Levels (Rounded - Think of these as ranges)
- Long: 24382
- Mid: 23239
- Short: 22096
Keep in mind this is not speculation or a prediction. Only a report of the Power Range with Fib extensions for target hunting. Do your DD! You determine your risk tolerance. You are fully capable of making your own decisions.
BA: Back Adjusted
BuZ/BeZ: Bull Zone / Bear Zone
NZ: Neutral Zone
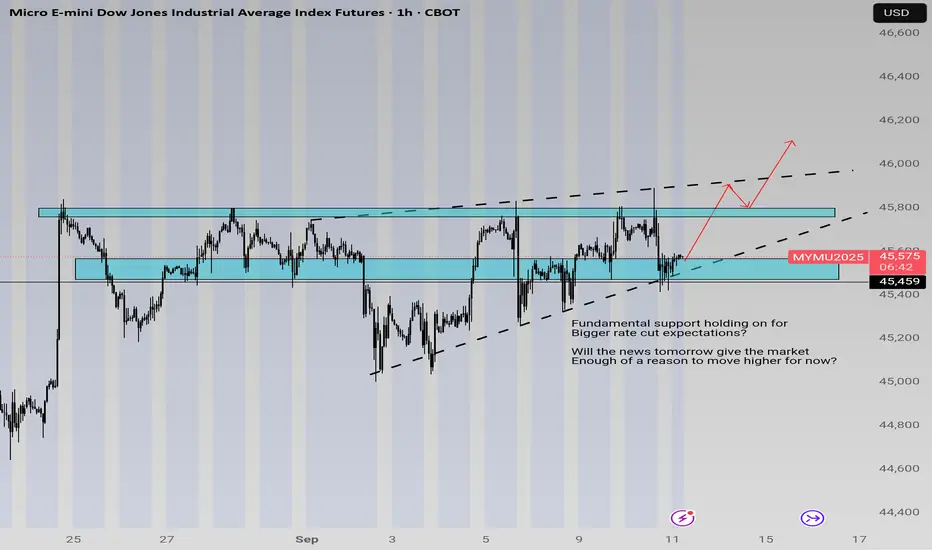
Technicals Illustrating Current Positioning of BullsEquities have bulls building into positions as seen with rising support, and the pressure against the supply zone around ATHs are becoming more squeezed as we get closer to next week.
The zone is main Key Level holding direction. Tomorrow's news will give more volatility and will be the next clue as to what may happen.
BNB - NEW ATH !!!! 🚨 BREAKING: #BNB HITS NEW ALL-TIME HIGH! 💥
REAL FOMO IS KICKING IN!
Is $1,000 the next stop? 🚀
Levels to watch:
$875 - $900
$950 - $960
1000$

$HIFI - Huge breakout incoming? $HIFI - Huge breakout incoming? 🚀
Major buy volume coming in on the daily! 📈
Key resistances to watch:
→$0.0970 & $0.1170
Key demand zone:
→$0.0750 - $0.0760 (see 2nd chart)
If the price consolidates above, that’s a strong green light! 🟢
⚠️ Caution: I’d stay patient, wait for a clean breakout above $0.1200 (D1 close) for true confirmation.
Pump potential:
150%+ (medium term)!🚀
But watch out for short-term volatility.
HLong

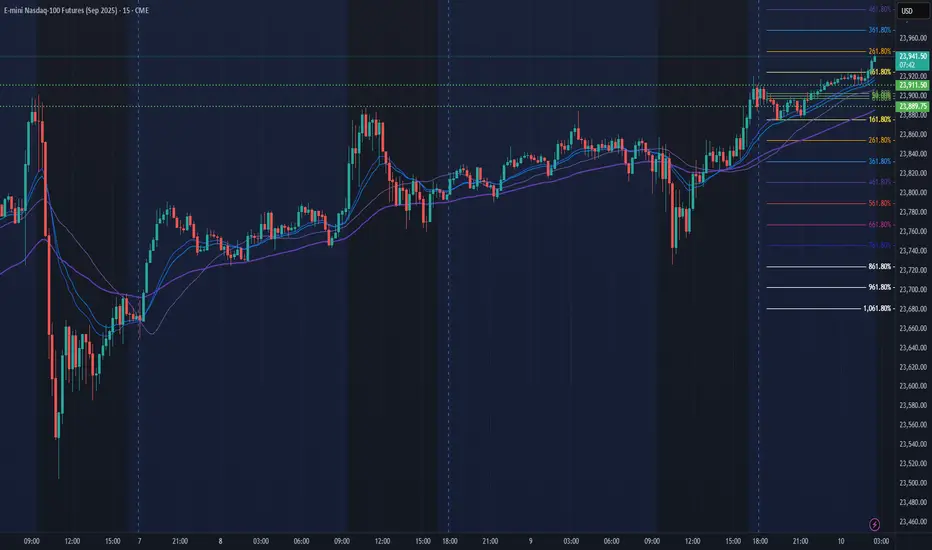
NQ Power Range Report with FIB Ext - 9/10/2025 SessionCME_MINI:NQU2025
- PR High: 23911.50
- PR Low: 23890.00
- NZ Spread: 48.0
Key scheduled economic events:
08:30 | PPI
13:00 | 10-Year Note Auction
Temp 25% AMP margins increase for expected pre-RTH news-based volatility spike
Session Open Stats (As of 12:45 AM 9/10)
- Session Open ATR: 287.29
- Volume: 18K
- Open Int: 287K
- Trend Grade: Long
- From BA ATH: -0.7% (Rounded)
Key Levels (Rounded - Think of these as ranges)
- Long: 24382
- Mid: 23239
- Short: 22096
Keep in mind this is not speculation or a prediction. Only a report of the Power Range with Fib extensions for target hunting. Do your DD! You determine your risk tolerance. You are fully capable of making your own decisions.
BA: Back Adjusted
BuZ/BeZ: Bull Zone / Bear Zone
NZ: Neutral Zone
Apple – Can the Company’s “Awe Dropping” Event Deliver?The Apple share price has been on a roll of late, trading from a low of 224 on August 21st to print a 6 month high of 241 on Friday (Sept 5th), consolidating its position as the third biggest company in the world with a market capitalisation of $3.56 trillion, just behind Microsoft in second place at $3.68 trillion.
However, what happens next for the Apple share price may depend in part on how well traders respond to the company’s biggest product launch of 2025, which is due for release at its “Awe Dropping” event later today.
Apple are due to showcase their next generation iPhone line up, alongside new smartwatches, and other devices. This hardware is seen as important for the future success of the company given Apple has fallen behind its key competitors in the AI space and so needs customers to keep buying these products while it revitalises its plans to catch up.
The Apple Event kicks off at 1800 BST. It could be helpful for traders to monitor the product announcements and keep focused on any impact they have on price action for Apple stock throughout the evening and early trading on Wednesday.
The share price could experience pockets of volatility across this crucial 24 hour period before traders switch their focus to the US inflation releases that are scheduled for 1330 BST Wednesday (PPI) and 1330 BST Thursday (CPI).
Technical Update: Optimism Ahead of the Product Launch?
It might be argued the current price of Apple shares reflects positive investor sentiment ahead of today’s product launch.
Since the April 8th low, traders have consistently bought into price dips, pushing the stock above resistance marked by the previous failure high.
As the chart above shows, improving sentiment has helped form an uptrend in price, with Friday marking the highest trade in Apple shares since March 7th.
While the positive trend is encouraging, it is no guarantee of continued price strength, and much will depend on how the market reacts to this evening’s key sentiment driver.
That said, a close above the 241 high could trigger a further phase of strength toward higher resistance levels.
A successful close above 241 might signal a push toward resistance at 250, which is the February 25th high, or even 260, which is the December 26th peak.
However, if the market reacts negatively to the product launch, breaking key support levels might be an indication for risks of further price declines in Apple’s share price.
As shown in the chart above, the rising Bollinger mid-average, currently at 232, may offer initial support. Last week's decline held at this level, helping to establish fresh buying interest and the latest move to new recovery highs.
As such, the 232 level may serve as the first possible support, with a close below it signalling potential for increased downside risks.
A close below 232 could potentially trigger a deeper decline toward 224, the August 21st low, or even 202, the August monthly downside extreme.
The material provided here has not been prepared accordance with legal requirements designed to promote the independence of investment research and as such is considered to be a marketing communication. Whilst it is not subject to any prohibition on dealing ahead of the dissemination of investment research, we will not seek to take any advantage before providing it to our clients.
Pepperstone doesn’t represent that the material provided here is accurate, current or complete, and therefore shouldn’t be relied upon as such. The information, whether from a third party or not, isn’t to be considered as a recommendation; or an offer to buy or sell; or the solicitation of an offer to buy or sell any security, financial product or instrument; or to participate in any particular trading strategy. It does not take into account readers’ financial situation or investment objectives. We advise any readers of this content to seek their own advice. Without the approval of Pepperstone, reproduction or redistribution of this information isn’t permitted.

NQ Power Range Report with FIB Ext - 9/9/2025 SessionCME_MINI:NQU2025
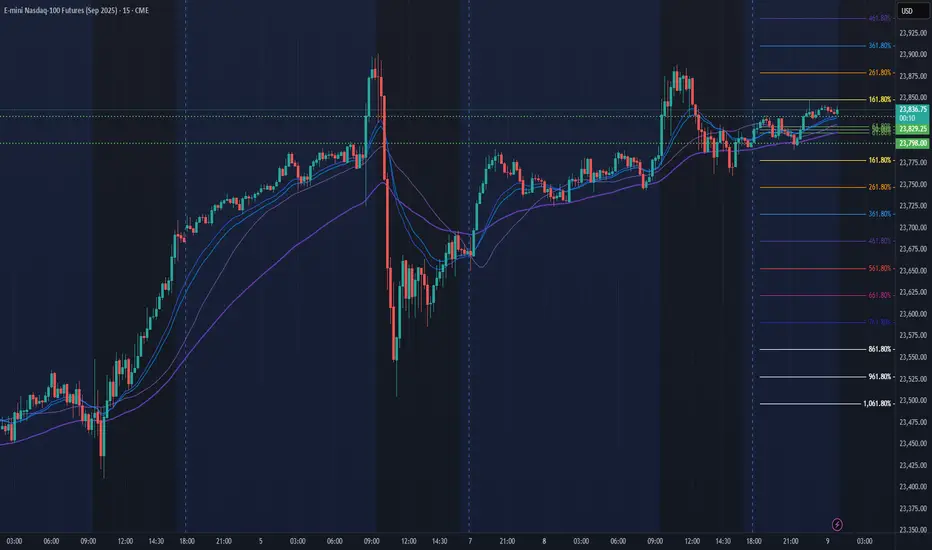
- PR High: 23829.00
- PR Low: 23798.00
- NZ Spread: 69.5
No key scheduled economic events
Session Open Stats (As of 12:25 AM 9/9)
- Session Open ATR: 295.63
- Volume: 18K
- Open Int: 284K
- Trend Grade: Long
- From BA ATH: -0.9% (Rounded)
Key Levels (Rounded - Think of these as ranges)
- Long: 24382
- Mid: 23239
- Short: 22096
Keep in mind this is not speculation or a prediction. Only a report of the Power Range with Fib extensions for target hunting. Do your DD! You determine your risk tolerance. You are fully capable of making your own decisions.
BA: Back Adjusted
BuZ/BeZ: Bull Zone / Bear Zone
NZ: Neutral Zone
EURUSD 1H – Testing Major ResistanceFOREXCOM:EURUSD
Structure | Trend | Key Reaction Zones
Price is testing the 1.1765 resistance zone after a strong bullish recovery. Demand zone remains strong around 1.1610–1.1630.
Market Overview
EURUSD is approaching the upside resistance after breaking through key supports last week. Bulls must sustain momentum above 1.1700 to confirm continuation.
Key Scenarios
❌ Bearish Case 📉
Target 1: 1.1682
Target 2: 1.1650
Target 3: 1.1620
Stop Loss: Above 1.1770
Current Levels to Watch
Resistance 🔴: 1.1765 – 1.1780
Support 🟢: 1.1650 – 1.1620
⚠️ Disclaimer: This analysis is for educational purposes only. Not financial advice.

Follow-Up: Non-Farm Moves from FridayHi All,
Following up on the range (size of the move) after non-farm on Friday to see how close our range expectation estimates were (see the earlier video post linked here for that).
The actual number came in pretty poor and worse than expected at 22k (vs 75k expected).
The move on the Non-farm release itself was actually quite muted with roughly a 20pt move on both sides of our VWAP starting point. But the real move came around 30 minutes into the US open where we saw a quick decline down to our lower boundary (50pts lower at 6470) and then briefly over-ran to 6450. But we settled and that 6470 became support for most of the session before reverting back to that declining VWAP to finish the day around 6490.
So, what's the lesson here: a bit of time pre-framing the possibilities for moves in either direction using a combination of stats (ATR, standard deviation of range), other technical analysis tools (support/resistance, VWAP, vol profile) along with experience can help frame the day and the important levels. Use this to start to decide what tools to pull out of the toolbox (trading strategies) and where to initiate trades.
If you find this helpful and would like to see more please let me know.
Happy Trading!

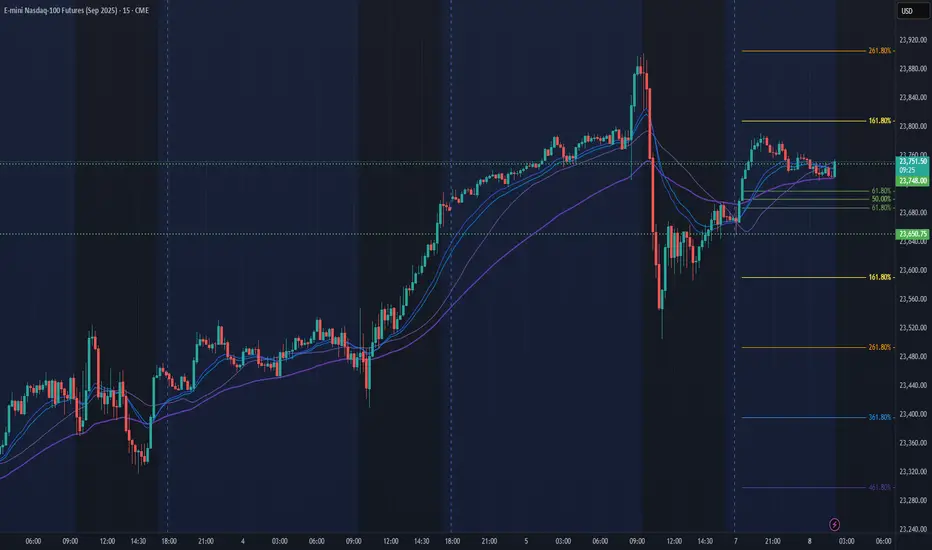
NQ Power Range Report with FIB Ext - 9/8/2025 SessionCME_MINI:NQU2025
- PR High: 23748.00
- PR Low: 23650.25
- NZ Spread: 218.75
No key scheduled economic events
Session Open Stats (As of 1:25 AM 9/8)
- Session Open ATR: 307.04
- Volume: 31K
- Open Int: 285K
- Trend Grade: Long
- From BA ATH: -1.3% (Rounded)
Key Levels (Rounded - Think of these as ranges)
- Long: 24382
- Mid: 23239
- Short: 22096
Keep in mind this is not speculation or a prediction. Only a report of the Power Range with Fib extensions for target hunting. Do your DD! You determine your risk tolerance. You are fully capable of making your own decisions.
BA: Back Adjusted
BuZ/BeZ: Bull Zone / Bear Zone
NZ: Neutral Zone
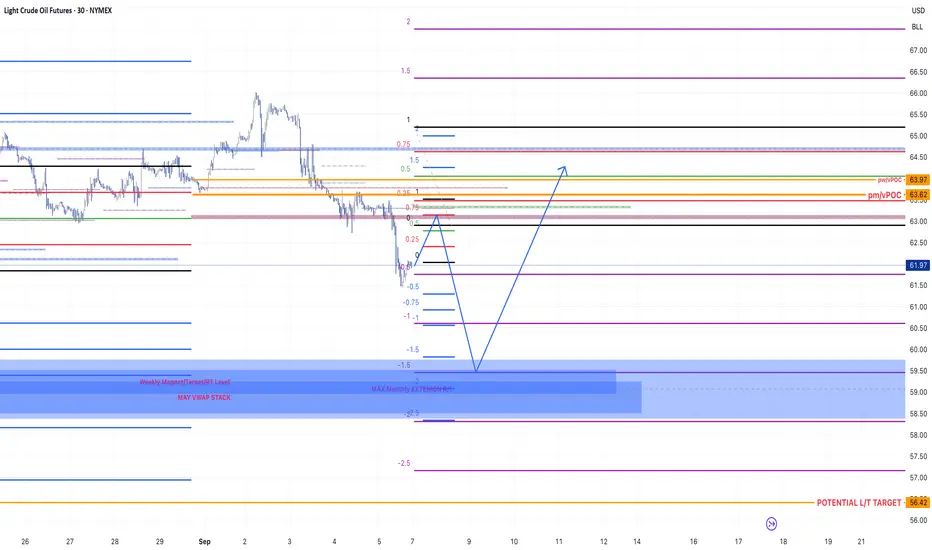
Crude Oil Idea of week 08-12/09/25This week I see Oil continuing lower with a potential bullish reaction after reaching lower price areas of interest. Monitoring price action on Monday to decide what we will attack and trade. I wouldn't be surprised if this week is choppy!
Always caution, patience and risk!
GL!
If you like the content give me a follow on X!
Check Bio. Cheers!
NQ Bearish Idea for week 08-12/09/25I can see 2 higher levels being reached first before price starts collapsing toward mid end of the week. Only taking short setups this week. News will drive us to Target 1,2 and potentially 3.
Always caution, patience and risk!
GL!
If you like the content give me a follow on X!
Check Bio. Cheers!

The Reversal Overture: " Bitcoin's Ascent from the Depths"In the quiet hum of the market's pulse, a story begins to unfold on the 4-hour chart of Bitcoin (BTC/USD). Like a phoenix rising from the ashes, the price stirs from the depths of recent lows, hinting at a shift — a new bullish tale whispered through candlelight.
The Setup
This chart paints a scene of recovery and hope. A descending trendline, once a symbol of persistent decline, has been decisively broken. The price now emerges above it — a clear sign of strength. From the valley of support around $107,270 and a wick low near $105,692, Bitcoin claws its way upward, challenging resistance with fresh momentum.
Marked clearly are two destinations:
Destination 1: $117,218 — a waypoint on this journey, where price may briefly rest.
Destination 2: $123,125 — a higher peak, nestled beneath the looming **Major Resistance** zone that stretches toward $124,517.
The trend is now bullish, supported by a clean breakout and the formation of higher lows — the market's silent nod of approval.
The Bullish Causes are :
1. Break of the Descending Trendline
Like the first light after a storm, this break signals a potential change in character — from fear to optimism.
2. Strong Support Reaction
Price bounced with conviction from the $107K–$105K support zone. Buyers stepped in with purpose, defending a key level.
3. Higher Highs & Higher Lows in Formation
The rhythm of the market now beats in a bullish cadence — stair-stepping upward, each level stronger than the last.
4. Momentum Builds into Resistance
As the chart eyes the major resistance zone, it does so not with hesitation, but with increasing volume and energy — the lifeblood of bullish continuation.
Timeless truth:
"If there is no managed risk, one cannot take profit."
This is no flash-in-the-pan rally. It is a setup for the long run, crafted with patience and vision. The path may be winding, but the direction is clear — Bitcoin is trending, and the bulls are once again writing their chapter in this ever-evolving market tale.

$avax - Bullish pennant & accumulation under Monthly resistanceCRYPTOCAP:AVAX - Bullish pennant & accumulation under 215 days range zone resistance! 📈
Once it will flip & consolidate above the 26.50$ level, I expect to see a 20%+ move upward! 🚀
🎯27.30
🎯28.25
🎯31.10
🎯33.00
🎯35.00
Remember my view, I again called for few green days, even weeks on #alts because stabilize above 110k!
Key support to be maintained: 22.0 & 21.00$.
Bulls are in full control above.
#AVAX #trading

Its Non-Farm: How much will ES Move?Hi all - Happy Non-Farm Friday!
I haven't done this in a while and thought it might be helpful to share my process for estimating the size of the move that we may get on ES after the Non-Farm Payrolls data is released.
I'm not trying to make a prediction on direction here - but more understand where the boundaries could be so I can determine how to trade this (what trading tool I can pull out of my box) once the announcement comes out.
Hope it helps and please let me know if you find it useful and I'll create more posts .
Cheers,
Jeff

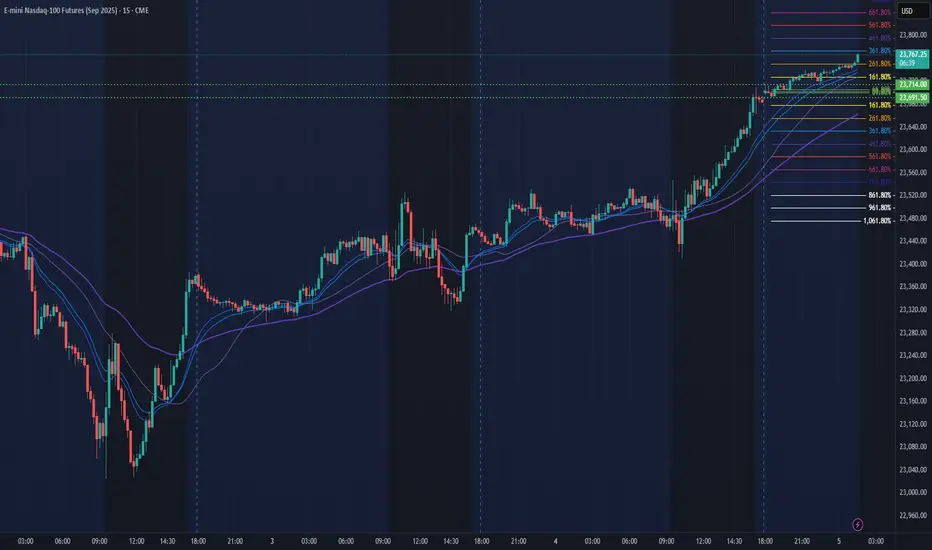
NQ Power Range Report with FIB Ext - 9/5/2025 SessionCME_MINI:NQU2025
- PR High: 23713.75
- PR Low: 23691.75
- NZ Spread: 49.0
Key scheduled economic events:
08:30 | Average Hourly Earnings
- Nonfarm Payrolls
- Unemployment Rate
AMP temp margins increase for pre-RTH jobs reports
Session Open Stats (As of 1:25 AM 9/5)
- Session Open ATR: 296.83
- Volume: 20K
- Open Int: 283K
- Trend Grade: Long
- From BA ATH: -1.3% (Rounded)
Key Levels (Rounded - Think of these as ranges)
- Long: 24382
- Mid: 23239
- Short: 22096
Keep in mind this is not speculation or a prediction. Only a report of the Power Range with Fib extensions for target hunting. Do your DD! You determine your risk tolerance. You are fully capable of making your own decisions.
BA: Back Adjusted
BuZ/BeZ: Bull Zone / Bear Zone
NZ: Neutral Zone
Bitcoin to $500K by 2028–2030Institutional Adoption, Scarcity, and the Devaluation of the Dollar
The question of whether Bitcoin could reach the half‑million mark within the next five to seven years is increasingly debated among investors, economists, and institutions alike. While such projections still carry uncertainty, several converging trends suggest that a $500,000 valuation for Bitcoin by 2028–2030 is within the realm of possibility. These drivers include the rapid pace of institutional adoption, Bitcoin’s fixed supply, its growing narrative as a store of value, the potential role of national reserves, and a macroeconomic backdrop defined by inflation and dollar devaluation. Additionally, the long‑term holding behavior of Bitcoin investors has reduced circulating supply, further amplifying the scarcity effect.
1. Institutional Adoption via ETFs and Beyond
The approval and growth of Bitcoin exchange-traded funds (ETFs) in major financial markets mark a watershed moment in the asset’s mainstream acceptance. These vehicles simplify access for institutional investors that were previously constrained by custody and regulatory hurdles. Pension funds, endowments, and sovereign wealth funds are now able to allocate to Bitcoin through regulated channels.
As demand from professional investors grows, the inflows through ETFs act as a continual buy‑side force. Unlike speculative retail buying sprees of previous cycles, institutional allocations are more structured and long‑term oriented, potentially anchoring a more stable demand floor. This steady absorption of supply is expected to become one of the strongest catalysts for Bitcoin price growth this decade.
2. Fixed Supply: The Scarcity Engine
Bitcoin’s most unique feature is its hard‑coded supply cap: only 21 million coins will ever exist . This mathematical certainty contrasts starkly with fiat currencies, where central banks can expand money supply indefinitely. Halving events, which reduce the block rewards of mining BTC roughly every four years, further accelerate scarcity.
By 2030 , the annual mining of Bitcoin will be minuscule compared to today, limiting fresh supply even as institutional demand scales up. In classical economic terms, a growing demand against a fixed or declining supply can only result in upward price pressure.
3. Store of Value in an Inflationary World
The past decade has demonstrated how inflation and monetary expansion distort asset markets. As governments print more money to finance debt and expenditures, investors increasingly seek hedges against the erosion of purchasing power. Historically, gold has played this role.
Bitcoin, with its transportability, divisibility, verifiability, and digital-native characteristics, is now increasingly seen as a modern alternative or complement to gold. If Bitcoin even partially captures the $13+ trillion gold market as a store of value, valuations well above $500,000 per coin become mathematically plausible.
4. Bitcoin as a Component of National Reserves
While still early, several nations are exploring or experimenting with holding Bitcoin in their reserves. For countries facing dollar dependency or geopolitical pressures, Bitcoin provides a neutral, censorship‑resistant reserve asset that reduces reliance on the U.S. financial system.
Should more governments follow El Salvador’s lead or allocate even a small percentage of their foreign reserves to Bitcoin, global reserve demand could represent a massive new buyer base. Even marginal allocations at a sovereign level would create outsized effects due to Bitcoin’s relatively small market capitalization compared to global reserves.
5. The Dollar, Inflation, and Asset Price Revaluation
The U.S. dollar, while still dominant, faces structural challenges: ballooning government debt, persistent fiscal deficits, and the need for monetary expansion to sustain growth. Increased money supply historically leads to currency debasement. As purchasing power erodes, asset prices, from equities to real estate to scarce stores of value like Bitcoin, tend to reprice higher in nominal dollar terms.
Thus, Bitcoin’s potential ascent to $500,000 is not solely about Bitcoin “going up,” but also about the dollar “going down.” In this sense, the milestone is as much a reflection of fiat devaluation as it is of Bitcoin adoption.
6. The Supply Dynamics: 80% Already Parked
On‑chain analytics highlight another critical factor: roughly 80% of Bitcoin supply is currently held by long‑term investors in “dormant” wallets, seldom moved or sold. This indicates that a large portion of the supply is illiquid, effectively taken off the market.
When institutions, retail newcomers, or governments try to acquire Bitcoin in size, they will be competing over the thin slice of supply available for trade. This dynamic creates a potential supply squeeze, which historically has been one of the key drivers of Bitcoin’s parabolic price advances.
Conclusion: A Plausible Milestone, But With Volatility Along the Way
Projecting Bitcoin to $500,000 by 2028–2030 is not simply speculation, it is a thesis grounded in identifiable trends: institutional adoption through ETFs, a mathematically capped supply, Bitcoin’s emerging status as digital gold, the potential for sovereign reserve adoption, and macroeconomic tailwinds fueled by dollar debasement.
However, it is important to note that Bitcoin’s journey will not be linear. Volatility, regulatory battles, and shifts in global macro conditions will shape the trajectory. Yet, the combination of structural scarcity and rising global demand makes the possibility of half‑a‑million per coin a credible long‑term scenario.
#crypto #bitcoin #finance #defi #economy #portfolio #digital #blockchain #trading #asset

NQ Power Range Report with FIB Ext - 9/4/2025 SessionCME_MINI:NQU2025
- PR High: 23458.25
- PR Low: 23434.25
- NZ Spread: 53.5
Key scheduled economic events:
08:15 | ADP Nonfarm Employment Change
08:30 | Initial Jobless Claims
09:45 | S&P Global Services PMI
10:00 | ISM Non-Manufacturing PMI
- ISM Non-Manufacturing Prices
12:00 | Crude Oil Inventories
Session Open Stats (As of 12:25 AM 9/4)
- Session Open ATR: 299.73
- Volume: 26K
- Open Int: 277K
- Trend Grade: Long
- From BA ATH: -2.3% (Rounded)
Key Levels (Rounded - Think of these as ranges)
- Long: 24382
- Mid: 23239
- Short: 22096
Keep in mind this is not speculation or a prediction. Only a report of the Power Range with Fib extensions for target hunting. Do your DD! You determine your risk tolerance. You are fully capable of making your own decisions.
BA: Back Adjusted
BuZ/BeZ: Bull Zone / Bear Zone
NZ: Neutral Zone