NQ Power Range Report with FIB Ext - 6/2/2025 SessionCME_MINI:NQM2025
- PR High: 21348.50
- PR Low: 21295.25
- NZ Spread: 119.25
Key scheduled economic events:
09:45 | S&P Global Manufacturing PMI
10:00 | ISM Manufacturing PMI
- ISM Manufacturing Prices
13:00 | Fed Chair Powell Speaks
Holding inside Friday's range
Session Open Stats (As of 12:15 AM 6/2)
- Session Open ATR: 440.37
- Volume: 29K
- Open Int: 267K
- Trend Grade: Neutral
- From BA ATH: -6.2% (Rounded)
Key Levels (Rounded - Think of these as ranges)
- Long: 22096
- Mid: 20383
- Short: 19246
Keep in mind this is not speculation or a prediction. Only a report of the Power Range with Fib extensions for target hunting. Do your DD! You determine your risk tolerance. You are fully capable of making your own decisions.
BA: Back Adjusted
BuZ/BeZ: Bull Zone / Bear Zone
NZ: Neutral Zone
Volatility

Bitcoin analysis based on market liquidity and M2 money supply This trade enters Bitcoin in the $101,500–$102,200 zone, aiming to capture a high-probability bounce from a dense liquidity pocket formed by recent long liquidations. This region has historically acted as a bull market reaccumulation zone, typically holding after 5–8% drawdowns during major trend continuations.
The trade is structured to ride a macro continuation leg toward $125,000, targeting the next major expansion phase driven by both short squeezes (clustered above $106K) and a broader surge in demand following increasing M2 money supply and institutional inflows.
The stop-loss is placed at $97,000, a deliberate distance below local support but above the deeper liquidity sweep zone at $89K–$92K. That level is unlikely to be reached unless the market undergoes a full liquidation cascade, which would likely bypass $97K altogether in a fast move. This stop protects against structural failure while avoiding premature exits in normal volatility.
The setup is designed for maximum reward with acceptable risk, offering a risk-reward ratio of over 4:1, and aligns with the thesis that Bitcoin is entering its final acceleration phase toward a new macro high.

iBIT - Weekly Volatility SnapshotGood Afternoon,
Here is my weekly perspective for NASDAQ:IBIT ---
IV (48.31%) entering this week is holding in the 24th percent range for the year and has been climbing weekly from putting in new lows at the beginning of the year. We essentially have been seeing rising IV with rising price action, the best of the best. Premium increases from price action climbing and IV rising affects Vega positively increasing premium too.
Bi-weekly trends (27.64%) show a cooling off entering the week and contraction under IV, but it might not last long as there could be major macro news in the crypto world at any moment. This could be a big week on continued regression towards quarterly means (51.52%).
If this happens the range will continue to expand in my option and hold a +3.21% value per move on premium over stated IV, but weekly trends would be expanding 23.89% -- A huge move.
As always --
For those interested in volatility analysis and the application of weighted HV ranges to IV, I encourage you to BOOST and share this post, leave a comment, or follow me to join me on this journey.

BITx - Weekly Volatility SnapshotGood Afternoon,
Here is my weekly perspective for CBOE:BITX
IV (96.75%) entering this week is holding in the 18th percent range for the year and has been climbing weekly from putting in new lows at the beginning of the year. We essentially have been seeing rising IV with rising price action, the best of the best. Premium increases from price action climbing and IV rising affects Vega positively increasing premium too.
Bi-weekly trends (56.07%) show a cooling off entering the week and contraction under IV, but it might not last long as there could be major macro news in the crypto world at any moment. This could be a big week on continued regression towards quarterly means (104.06%).
If this happens the range will continue to expand in my option and hold a +7.31% value per move on premium over stated IV, but weekly trends would be expanding 47.99% -- A huge move.
As always --
For those interested in volatility analysis and the application of weighted HV ranges to IV, I encourage you to BOOST and share this post, leave a comment, or follow me to join me on this journey.

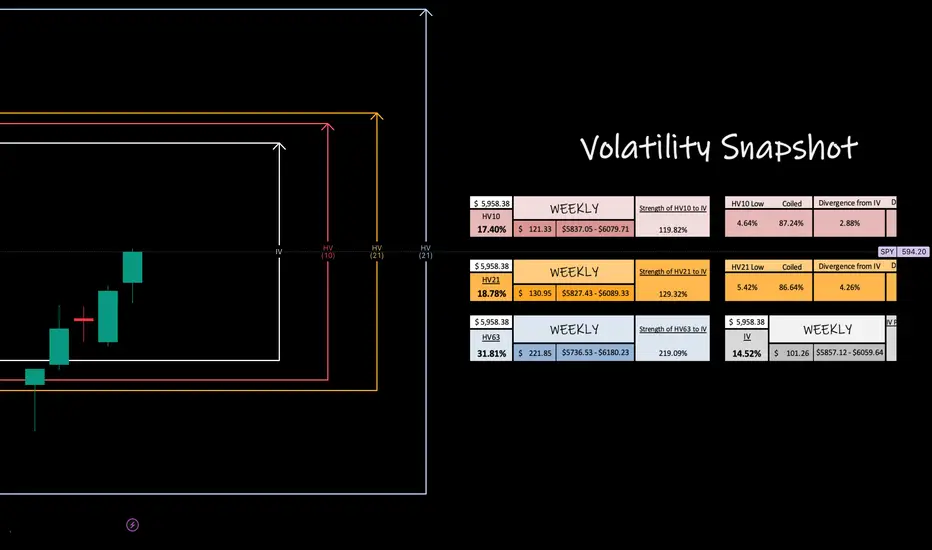
S&P 500 Index -- Weekly Volatility Potential Good Afternoon!
This week, I want to talk about the CBOE:SPX and its weekly potential for how I read historical volatility to weight it then to implied volatility -- this creates my custom trading ranges.
Implied ranges for this week are calculated at 4 DTE using my strength of IV method. You can find out more how I do this over at my highlights page on 'X' - Find me @askHVtobidIV
We are entering a short week, with IV currently in the 89th percentile for the year ( 18.31% ) and resonating between bi-weekly ( 19.36% ) and monthly ( 15.13% ) historical values. Quarterly volatility trends ( 31.79% ) have risen more than 10% this year alone due to macro concerns and increased news from tariff uncertainties. This is creating a volatile environment that, in turn, only increases our trading ranges. Something I personally like.
Near-term trends are above the currently high IV environment, suggesting further expansion. This provides premium value on what is happening to what is projected to happen and a “strength of IV” of >100% indicating rising volatility, slowly towards quarterly means, while resonating around monthly trends.
If price action drives downwards, our gap from May 16th could fill around $5,692.56 with confluence of HV21 trends at $5,710.91.
Conversely, I can see HV10 ranges with rising pricing action and good macro news with EU tariffs breaking $5,971.33—Expanding to the price of $5,995.95 with continuing expansion and regression towards means.
Come back next weekend as I will review the chart to see how we developed!
For those interested in volatility analysis and the application of weighted HV ranges to IV, I encourage you to BOOST and share this post, leave a comment, or follow me to join me on this journey.

NQ Power Range Report with FIB Ext - 5/30/2025 SessionCME_MINI:NQM2025
- PR High: 21395.25
- PR Low: 21335.25
- NZ Spread: 134.0
Key scheduled economic events:
08:30 | Core PCE Price Index (YoY|MoM)
09:45 | Chicago PMI
Rotation off 21850
- Previous session print advertising decline back to week low
Session Open Stats (As of 1:25 AM 5/30)
- Session Open ATR: 446.48
- Volume: 33K
- Open Int: 267K
- Trend Grade: Neutral
- From BA ATH: -5.6% (Rounded)
Key Levels (Rounded - Think of these as ranges)
- Long: 22096
- Mid: 20383
- Short: 19246
Keep in mind this is not speculation or a prediction. Only a report of the Power Range with Fib extensions for target hunting. Do your DD! You determine your risk tolerance. You are fully capable of making your own decisions.
BA: Back Adjusted
BuZ/BeZ: Bull Zone / Bear Zone
NZ: Neutral Zone

EU Bull runJust some simple bullish movement. Nothing much to really say about it other then looks like a good opportunity.
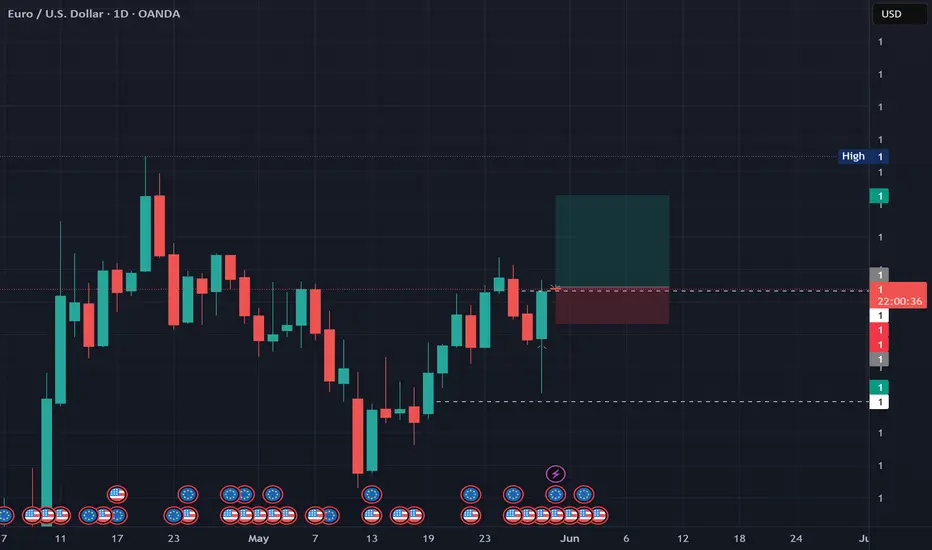
Bullish sentiment There is some bullish activity picking up on the Daily as the 4h is in a stand still. A good dollar cost average entry if riskier than expected.
AUDUSD – Recoil Back into the Range After Failed BreakoutOn Monday, AUDUSD briefly threatened a breakout from its May trading range, evident between 0.6356 (May 12th low) up to 0.6514 (May 7th high) with an early push up to a new monthly peak of 0.6537 on the Asia open. However, that move failed quickly after news of President Trump’s decision to extend the deadline for 50% tariffs on the EU from June 1st to July 9th hit the newswires.
While this update boosted risk sentiment and global stock prices, it removed the immediate downside pressure that had been starting to build again on the US dollar. AUDUSD has since fallen victim to position rebalancing which saw prices fall as low as 0.6407 on Wednesday, before a slightly higher than expected Australian CPI reading, led to some fresh buying.
Looking forward, with their short term trade concerns alleviated further this morning by a US Court ruling that the vast majority of President Trump's global tariffs were illegal, the question for traders into the end of the week, is whether AUDUSD can hold current levels and push higher again, or if it could retest the bottom of its May trading range at 0.6356, perhaps even further.
After all, market pricing currently places the chances of another rate cut from the RBA at their next meeting in early July at about 70%, which continues to weigh on AUDUSD if any new strength is seen.
Friday’s release of the Fed’s preferred inflation gauge (PCE Index) could also be relevant to the direction of the dollar (and therefore impact AUDUSD) into the weekend. Traders are waiting to see if inflation is still moderating or whether there are signs that President Trump’s tariffs are starting to push prices higher again.
Technical Update – More Balanced Themes Emerge
It might have been argued that on May 26th 2025, AUDUSD was attempting to break higher, especially as moves above 0.6519, the May 7th previous price high were seen.
However, as the chart below shows, this proved to be a failed breakout, as selling pressure quickly emerged, meaning the 0.6519 upside extreme held on a closing basis.
An inability of AUDUSD buyers to extend recent price strength is suggested by this activity, resulting in the development of a possible sideways price range.
This also appears to be supported by the current Bollinger Bands set-up, where the mid-average is flat and the bands are parallel to it.
This highlights something of a decision-making process between both buyers and sellers, with a closing breakout of either required to suggest the direction of the next more sustained phase of price activity.
What technical levels might AUDUSD traders find useful to watch?
Potential Resistance Levels:
Upper extremes of the current sideways range could now be marked by 0.6519/37, which is combination of the May 7th and May 26th price highs, levels where sellers have previously been active and may be again.
While any close above the 0.6519/37 resistance is not a guarantee of further upside, it may then lead to price strength towards 0.6688, the November 7th 2024 high.
Potential Support Levels:
With current evidence suggesting AUDUSD is developing a more balanced range, traders may well be focusing on the last correction price low, as the lower limit of the range. If this is the case, 0.6357 the May 12th 2025 session low, might be the support to monitor.
Closes under 0.6357, if seen, may then be an indication of a deeper decline in price, possibly towards 0,6298, which is equal to the 38.2% Fibonacci retracement of April 9th to May 26th 2025 strength, even the 50% retracement level which stands at 0.6224.
The material provided here has not been prepared in accordance with legal requirements designed to promote the independence of investment research and as such is considered to be a marketing communication. Whilst it is not subject to any prohibition on dealing ahead of the dissemination of investment research, we will not seek to take any advantage before providing it to our clients.
Pepperstone doesn’t represent that the material provided here is accurate, current or complete, and therefore shouldn’t be relied upon as such. The information, whether from a third party or not, isn’t to be considered as a recommendation; or an offer to buy or sell; or the solicitation of an offer to buy or sell any security, financial product or instrument; or to participate in any particular trading strategy. It does not take into account readers’ financial situation or investment objectives. We advise any readers of this content to seek their own advice. Without the approval of Pepperstone, reproduction or redistribution of this information isn’t permitted.

NQ Power Range Report with FIB Ext - 5/29/2025 SessionCME_MINI:NQM2025
- PR High: 21597.00
- PR Low: 21489.00
- NZ Spread: 241.5
Key scheduled economic events:
08:30 | Initial Jobless Claims
- GDP
12:00 | Crude Inventories
Open session with momentum break beyond 21600
- 2% value increase before London hours
Session Open Stats (As of 1:15 AM 5/29)
- Session Open ATR: 455.84
- Volume: 81K
- Open Int: 267K
- Trend Grade: Neutral
- From BA ATH: -3.7% (Rounded)
Key Levels (Rounded - Think of these as ranges)
- Long: 22096
- Mid: 20383
- Short: 19246
Keep in mind this is not speculation or a prediction. Only a report of the Power Range with Fib extensions for target hunting. Do your DD! You determine your risk tolerance. You are fully capable of making your own decisions.
BA: Back Adjusted
BuZ/BeZ: Bull Zone / Bear Zone
NZ: Neutral Zone

[05/27] Weekly GEX Outlook for SPX⚠️ Unbalanced GEX & Institutional Hedging – A Closer Look
I haven’t seen such an asymmetric GEX setup in quite a while — and it’s definitely not a pretty one 😬. The current profile suggests a highly skewed positioning in the market:
📍 Massive upside expectation:
It feels like the market is almost exclusively preparing for a move toward 6000.
🛑 Limited downside protection:
Below the current level, there's very little hedging in place — especially unusual with Friday’s expiry approaching.
🔻 Current Key Zone: 5925-5930
The largest put open interest is sitting right around 5925, which is also close to spot.
Below that? Things get murky. The GEX profile becomes fragmented and mixed, with no clear put support until much lower.
Interestingly, most of the current downside hedging is clustered around the 5900–5925 range, which includes ITM puts — not OTM, as you’d typically expect from retail.
🧠 Institutional Footprint vs. Retail
This hedging pattern — closer to ATM rather than deep OTM — suggests institutional players are managing downside risk with precision.
In contrast, retail traders don’t seem to be actively hedging the downside with OTM puts, which is a notable shift from typical behavior in high-IV weeks like this.
🔼 What to Watch: The 5930 Breakout
If SPX can break and hold above 5930, it enters a clear, call-dominated zone.
From there, the path to 6000 looks much cleaner, with lighter resistance and the potential for a gamma-driven push 📈.
The details show the same picture when examining more details:
SPX conclusion
😬 In short: we’re at a tipping point.
Below 5900, hedging is tactical and institutional.
Above 5900, the path is open to 6000 — but only if bulls can take control at 5930!

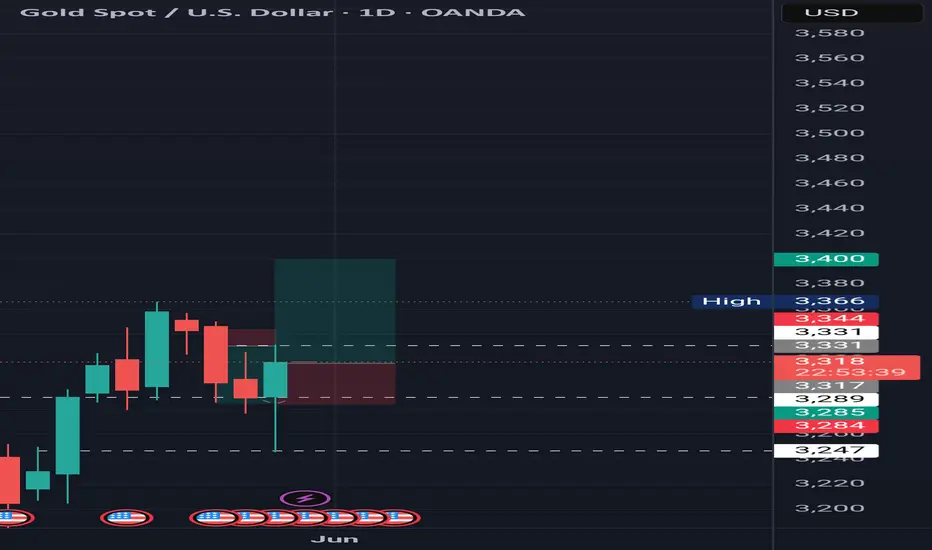
Against All OddsThis highlights the importance of the Daily time frame as if we did not notice it's movements along side the 4h greed zone we would not have been on top like many others who have fallen today.

Buying the greed indicationAfter the fear fall catch it hit a greed area where price is rallies often so this is a favorable price to get in at as everyone seems to think it cheap.

I had already taken this trade, just documenting itNothing significant to mention, just that it is a good opportunity of a bounce

NQ Power Range Report with FIB Ext - 5/28/2025 SessionCME_MINI:NQM2025
- PR High: 21480.00
- PR Low: 21453.50
- NZ Spread: 59.5
Key scheduled economic events:
14:00 | FOMC Meeting Minutes
Follow-through on daily print value increase rotation
- Closing in on 21600 front run pivot from previous week
Session Open Stats (As of 12:15 AM 5/28)
- Session Open ATR: 450.12
- Volume: 19K
- Open Int: 274K
- Trend Grade: Neutral
- From BA ATH: -5.3% (Rounded)
Key Levels (Rounded - Think of these as ranges)
- Long: 22096
- Mid: 20383
- Short: 19246
Keep in mind this is not speculation or a prediction. Only a report of the Power Range with Fib extensions for target hunting. Do your DD! You determine your risk tolerance. You are fully capable of making your own decisions.
BA: Back Adjusted
BuZ/BeZ: Bull Zone / Bear Zone
NZ: Neutral Zone

Best Practice: Prepare, Assess, Plan Then TradeTraders are often eager to jump straight into the next trading session but this may not always be the best option to chose. It can be more beneficial to follow a regular pre-trading routine to note down important scheduled events, establish current trends, as well as meaningful support and resistance price levels, and importantly this doesn’t have to be time consuming.
This is not meant to be that trading ‘holy grail’ but more of an addition to your existing trading process or plan. Having a regular routine to establish important levels, indicator set-ups and price trends to be aware of during your trading day may help you make trading decisions in a more effective way.
This pre trading routine can also be helpful for traders that take longer term positions, as it’s still important to consider the longer-term weekly perspectives as well.
This routine can be carried out at the weekend and then monitored and, where necessary, modified during the week as price action develops for the particular CFD(s) you are trading.
1. Keep Informed of Important Data Releases
If there are several CFD’s you regularly trade and tend to stick with, make sure you have as much information about those assets as possible before you start trading.
Consider utilising the Pepperstone trading calendar to help keep you informed of any economic releases/company earnings data that might impact the CFD you are trading before the week/session starts.
Once you know the scheduled events ahead, you can ask yourself,
Could these impact my trading?
Could the market reaction to this new information increase the volatility of the CFD I am about to trade or already have a position in?
How may this impact my risk?
Knowing what it is expected by the market before a particular important economic data release, such as US Non-farm Payrolls, can help you assess positioning going into the release, gauge market reaction to the data, and then be prepared for any potential price sentiment change and/or increased volatility.
2. Be Aware of Potential Support and Resistance Levels
Ahead of your trading day, consider running through the Pepperstone charts of the CFD’s you are considering trading and make a note of 3 support and resistance levels, that you identify as being meaningful. To help you we have set out an example Trading Template below.
Daily: Level: Reason: Current Trend: Current Thoughts:
Support
1st:
2nd:
3rd
Resistance
1st
2nd
3rd
Keep this next to your trading screen, so you are aware of particular levels that may act as support and resistance, if prices move in that direction. This can help you to improve trade entry or assist you with the placement of a stop loss or take profit order.
If these levels are broken at any time, you can update the template with any new support/resistance levels during the trading period.
3. Be Aware of the Daily Trends – Focus on Bollinger Bands
Using the direction of the daily Bollinger mid-average can be helpful to gauge the direction of the daily trend.
If the,
Mid-average is moving up = price uptrend
Mid-average is moving down = price downtrend
Mid-average is flat = possible price sideways range
The daily and weekly perspectives are the most important to be aware of, so it can be beneficial to analyse the charts from the longest timeframe into the shortest as this allows you to build a better understanding of the dominant trends.
You can also note these trends on the Trading Template, so it’s available to you when you are trading.
4. Follow the Same Process for All Other Timeframes - 4 Hour, 1 Hour, Even Shorter if it Suits Your Trading.
You can carry out the routine outlined in point 3, for any timeframes you are trading.
Things to note,
Are there any new trends suggested within a shorter term perspective by the Bollinger mid-average?
If the direction of a shorter term mid-average has changed, it may be an indication of either a change or resumption of a longer term price trend.
If this trend change also looks to be resuming within the longer term perspectives, this could be a more important signal, as the resumption of an existing longer term trend may mean a more extended move in that direction.
Be aware, confirmation of a price trend change within a longer term perspective might mean it could take longer and offer less trading opportunities, as initially price moves may be less aggressive in nature.
5. Where, Within the Various Timeframes is Price in Relation to the Bollinger Bands?
As we have highlighted in a previous commentary (please take a look our past posts), Bollinger Bands can highlight increasing price volatility within a trend.
Things to note regarding Bollinger Bands,
Are the upper or lower bands being touched by prices within any of the timeframes?
Within a sideways range (flat mid-average) this might suggest price has reached either a support or resistance level, with potential for a reversal.
While being touched, are the upper and lower bands starting to widen which indicates increasing price volatility, or contract, which indicates decreasing price volatility?
Remember - widening bands within a confirmed trend highlight increasing volatility, suggesting the current price move might continue for longer than you may anticipate, while contracting bands, point to decreasing volatility, which may lead to a reduction in a particular CFDs price movement.
Do the timeframes align?
If they do it may suggest a stronger trading opportunity is evident. CFDs within trending markets seeing increasing volatility tend to offer greater potential than those that aren’t.
In this scenario it maybe worthwhile considering only trading with the trend, not trying to pick bottoms or tops of markets, or if you do, consider a more cautious approach to your trading by reducing the size of your position and risk.
The material provided here has not been prepared in accordance with legal requirements designed to promote the independence of investment research and as such is considered to be a marketing communication. Whilst it is not subject to any prohibition on dealing ahead of the dissemination of investment research, we will not seek to take any advantage before providing it to our clients.
Pepperstone doesn’t represent that the material provided here is accurate, current or complete, and therefore shouldn’t be relied upon as such. The information, whether from a third party or not, isn’t to be considered as a recommendation; or an offer to buy or sell; or the solicitation of an offer to buy or sell any security, financial product or instrument; or to participate in any particular trading strategy. It does not take into account readers’ financial situation or investment objectives. We advise any readers of this content to seek their own advice. Without the approval of Pepperstone, reproduction or redistribution of this information isn’t permitted.

NQ Power Range Report with FIB Ext - 5/27/2025 SessionCME_MINI:NQM2025
- PR High: 21292.00
- PR Low: 21224.00
- NZ Spread: 152.0
Key scheduled economic events:
08:30 | Durable Goods Orders
10:00 | CB Consumer Confidence
Value increase and expected high volume following holiday weekend.
- Auctioning at Friday's high
Session Open Stats (As of 12:15 AM 5/27)
- Session Open ATR: 468.28
- Volume: 119K
- Open Int: 271K
- Trend Grade: Neutral
- From BA ATH: -6.6% (Rounded)
Key Levels (Rounded - Think of these as ranges)
- Long: 22096
- Mid: 20383
- Short: 19246
Keep in mind this is not speculation or a prediction. Only a report of the Power Range with Fib extensions for target hunting. Do your DD! You determine your risk tolerance. You are fully capable of making your own decisions.
BA: Back Adjusted
BuZ/BeZ: Bull Zone / Bear Zone
NZ: Neutral Zone

Nifty50 Market Update – Resistance AlertMy proprietary option pricing model, OptionSigma , identifies 25,200 as a key resistance level in the Nifty50 Index. Until this barrier is decisively broken, I won’t adopt a bullish stance.
🚨 Disclaimer: This is not a trade recommendation. Always conduct thorough research before making any trading decisions.
#nifty

Personal Trade Plan – Nifty50 25100 June Call OptionToday, I entered a long position in the Nifty50 25100 June (Monthly) Call option , securing an average price of ₹469.10 . I plan to accumulate additional lots at lower prices, with a strategy to hold until expiry.
📌 Disclaimer: This is not a trade recommendation. Please conduct independent research and assess risk factors before making any trading decisions.
#nifty50

Total3 Crypto Market CapWe know very well that Trump, at the moment, is able to move markets overnight. We also know well that such a market is difficult to navigate.
Nevertheless, we do have chart indications, as in this case:
- volatility, money inflow and others are in the middle.
- on the weekly, Total3 has bounced from the underlying structure, which may signify strength.
- the candle resting on the weekly FVG will be closed later.
- the indicators look good but not too good. Based on some altcoins (weekly), I see hope there.
- gray and delicate situation.
- best strategy: scalp, small profits, buy the dip and hold. Little or no leverage. Don't get hurt.
I will update to keep you posted on developments.

Weekly Volatility SnapshotVolatility, expressed through standard deviation, quantifies market elasticity and presents a level of probability and precision that humbles us all.
In my analysis, I track trending volatility to discern historical patterns (HV) and utilize them to anticipate future outcomes (IV). This weighted indicator provides a comprehensive and accurate range for observation.
When trending historical volatility expands or contracts around implied volatility, price action can be interpreted as positively or negatively compounded within the predicted implied range.
I measure this concept using the ‘strength’ of IV and calculate my implied range based on the current market elasticity. This system is adaptable to any IV condition, as it allows for a fair assessment of market movements and potential outcomes.
__________________________________
Last week, volatility increased slightly as bi-weekly trends picked up over monthly values -- the same near term trends with the major indices show strength within 8% of IV into this next week.
One thing to note: NASDAQ:MSFT NASDAQ:NVDA and NASDAQ:TSLA all show near term contraction under stated IV within the magnificent 7 while the rest show shorter term volatility as expansive.
What do you think the CBOE:VIX will do this next week?
___________________________________
For those interested in volatility analysis and the application of my system using weighted HV ranges to IV, I encourage you to BOOST and share this post, leave a comment, or follow me to join me on this journey!
We will weekly analyze our ranges under the VIX and engage in discussions.

S&P 500 Weekly PotentialVolatility, expressed through standard deviation, quantifies market elasticity and presents a level of probability and precision that humbles us all.
This week with SP:SPX bi-weekly trends have risen to just below our monthly values and are currently expansive over the markets IV prediction. Right now as I see it, HV10 is going resonate alongside our monthly values showing continued strength over IV. We could full regression to quarterly means as we move our of corrective territory then see consolidation to cool the markets down.
BOOST the post, drop a follow and comment, BUT don't circle back at the end of the week to revisit and observe how our trending markets preformed!

SPY Weekly PotentialVolatility, expressed through standard deviation, quantifies market elasticity and presents a level of probability and precision that humbles us all.
This week with AMEX:SPY bi-weekly trends have risen to just below our monthly values and are currently expansive over the markets IV prediction. Right now as I see it, HV10 is going resonate alongside our monthly values showing continued strength over IV. We could full regression to quarterly means as we move our of corrective territory then see consolidation to cool the markets down.
BOOST the post, drop a follow and comment, BUT don't forget to circle back at the end of the week to revisit and observe how our trending markets preformed!